| Param | Original file | Final file |
|---|---|---|
| Filename | modeM0/AS1C07_001T10_9000005678_41585cztM0_level2.fits | modeM0/AS1C07_001T10_9000005678_41585cztM0_level2_quad_clean.evt |
| Size (bytes) | 371,557,440 | 90,979,200 |
| Size | 354.3 MB | 86.8 MB |
| Events in quadrant A | 3,111,521 | 618,725 |
| Events in quadrant B | 2,647,392 | 637,705 |
| Events in quadrant C | 3,123,725 | 580,813 |
| Events in quadrant D | 4,426,321 | 517,830 |
| Mode SS | |||
|---|---|---|---|
| Quadrant | BADHDUFLAG | Total packets | Discarded packets |
| A | 0 | 116 | 0 |
| B | 0 | 116 | 0 |
| C | 0 | 116 | 0 |
| D | 0 | 116 | 0 |
| Mode M0 | |||
|---|---|---|---|
| Quadrant | BADHDUFLAG | Total packets | Discarded packets |
| A | 0 | 12625 | 2 |
| B | 0 | 11666 | 2 |
| C | 0 | 12917 | 2 |
| D | 0 | 17099 | 2 |
| Mode M9 | |||
|---|---|---|---|
| Quadrant | BADHDUFLAG | Total packets | Discarded packets |
| A | 0 | 18 | 0 |
| B | 0 | 19 | 0 |
| C | 0 | 19 | 0 |
| D | 0 | 19 | 0 |
| Quadrant | Total seconds | Saturated seconds | Saturation percentage |
|---|---|---|---|
| A | 5715 | 16 | 0.279965% |
| B | 5715 | 7 | 0.122485% |
| C | 5715 | 183 | 3.202100% |
| D | 5715 | 466 | 8.153981% |
Noise dominated data is calculated using 1-second bins in cleaned event files. If a bin has >2000 counts, and if more than 50% of those come from <1% of pixels, then it is considered to be noise-dominated and hence unusable.
| Quadrant | # 1 sec bins | Bins with >0 counts | Bins with >2000 counts | High rate bins dominated by noise | Noise dominated (total time) | Noise dominated (detector-on time) | Marked lightcurve |
|---|---|---|---|---|---|---|---|
| A | 7297 | 5716 | 3 | 3 | 0.04% | 0.05% | 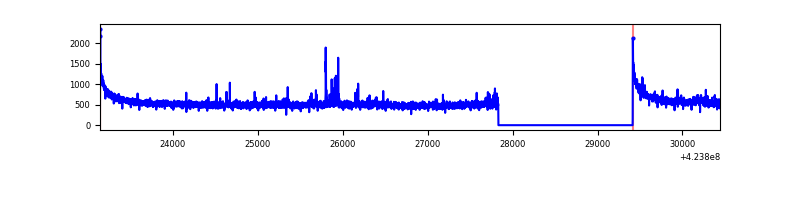 |
| B | 7297 | 5716 | 0 | 0 | 0.00% | 0.00% | 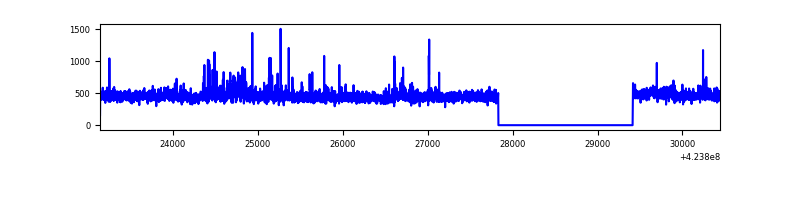 |
| C | 7297 | 5716 | 183 | 183 | 2.51% | 3.20% | 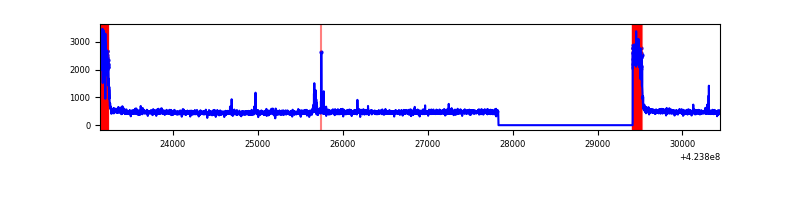 |
| D | 7297 | 5716 | 371 | 371 | 5.08% | 6.49% | 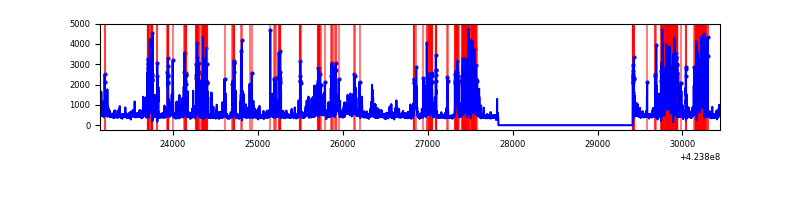 |
Top three noisy pixels from each quadrant. If the there are fewer than three noisy pixels in the level2.evt file, extra rows are filled as -1
| Pixel properties | Quadrant properties | ||||||
|---|---|---|---|---|---|---|---|
| Quadrant | DetID | PixID | Counts | Sigma | Mean | Median | Sigma |
| A | 10 | 83 | 591215 | 4561.37 | 628 | 616 | 129.5 |
| A | 14 | 235 | 29794 | 225.35 | 628 | 616 | 129.5 |
| A | 15 | 223 | 28265 | 213.54 | 628 | 616 | 129.5 |
| B | 0 | 245 | 96378 | 796.67 | 624 | 607 | 120.2 |
| B | 0 | 155 | 22884 | 185.31 | 624 | 607 | 120.2 |
| B | 0 | 190 | 22063 | 178.48 | 624 | 607 | 120.2 |
| C | 0 | 10 | 500501 | 3602.52 | 597 | 599 | 138.8 |
| C | 15 | 214 | 248849 | 1789.0 | 597 | 599 | 138.8 |
| C | 15 | 159 | 21497 | 150.6 | 597 | 599 | 138.8 |
| D | 13 | 249 | 1560483 | 10779.7 | 588 | 571 | 144.7 |
| D | 1 | 47 | 161406 | 1111.44 | 588 | 571 | 144.7 |
| D | 2 | 120 | 117906 | 810.84 | 588 | 571 | 144.7 |
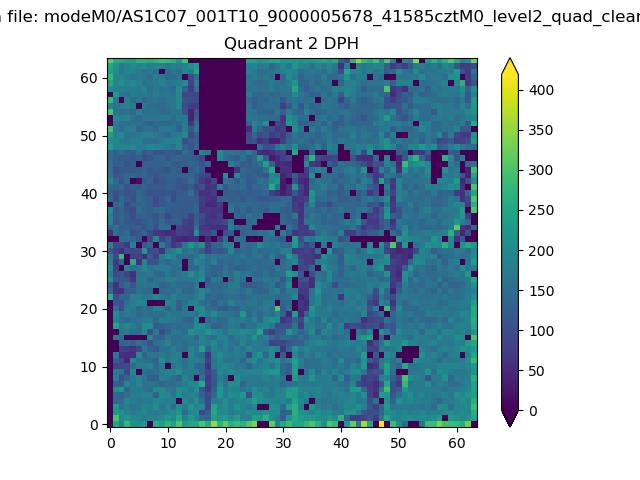
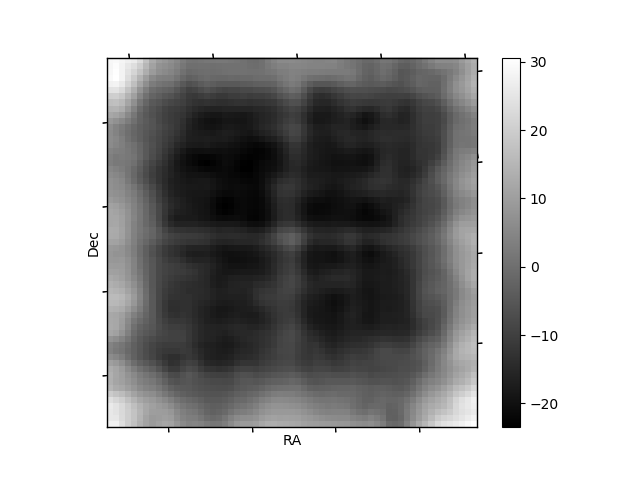
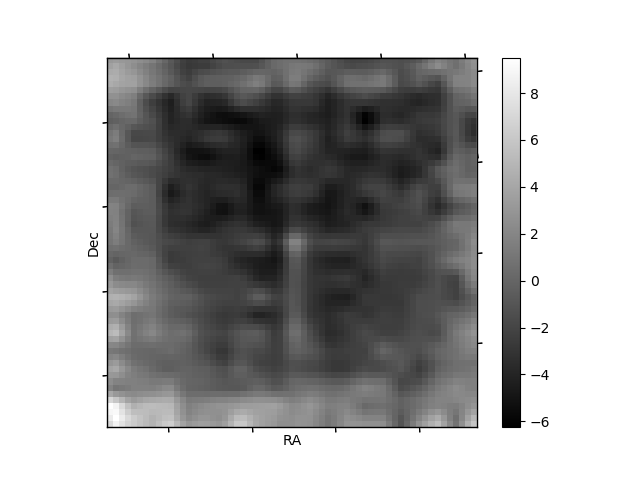
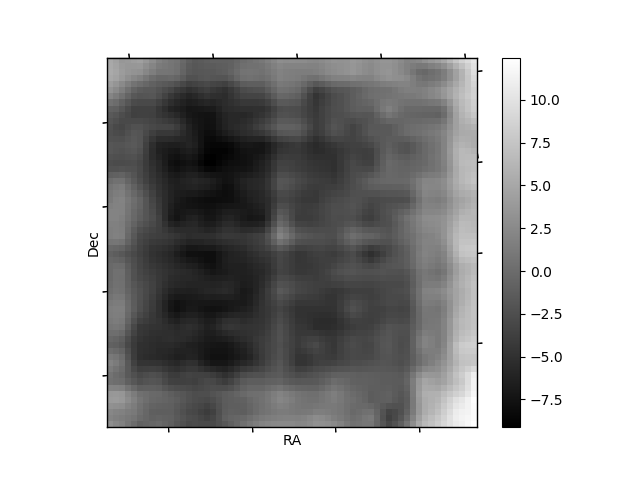
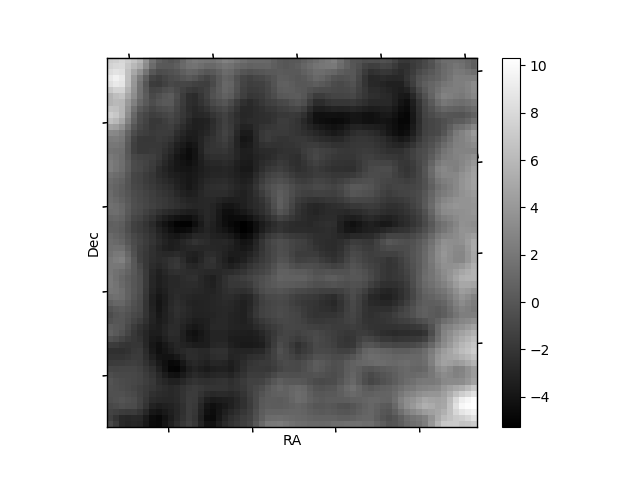
Histogram calculated using DETX and DETY for each event in the final _common_clean file
| Quadrant A | 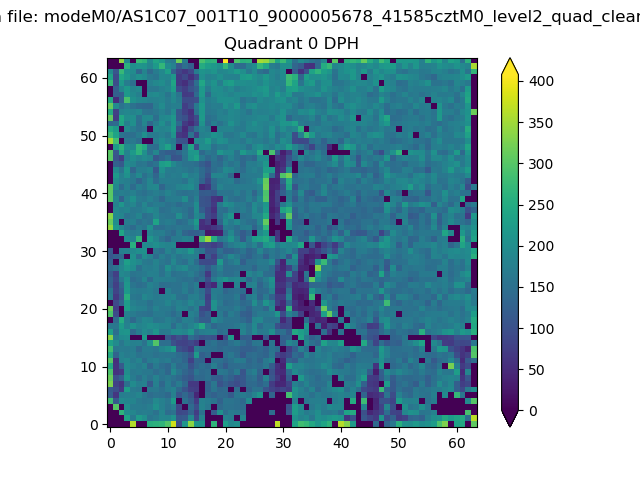 |
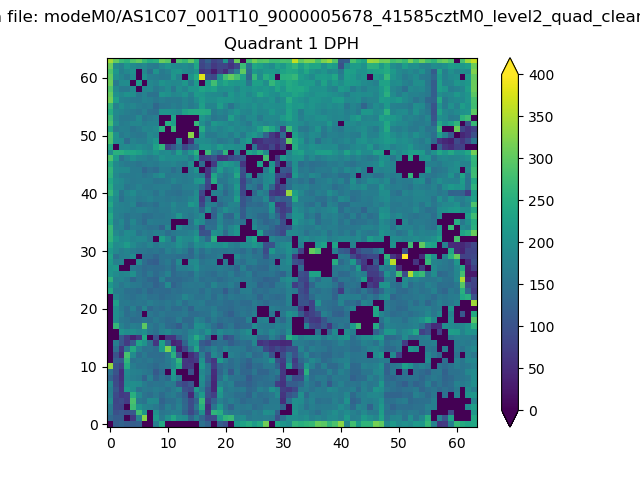 |
Quadrant B |
|---|---|---|---|
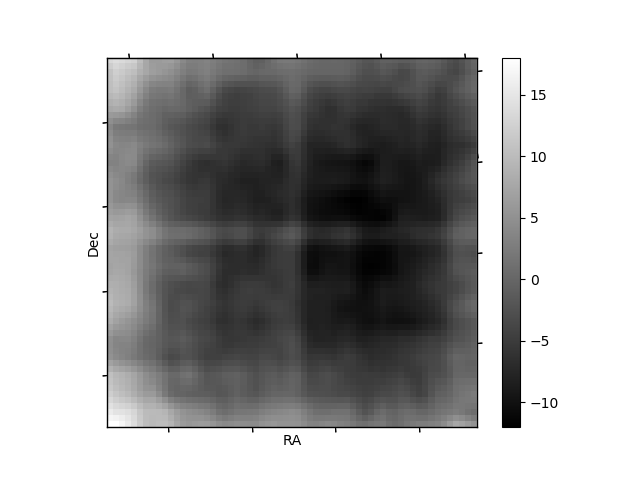
| Quadrant D | 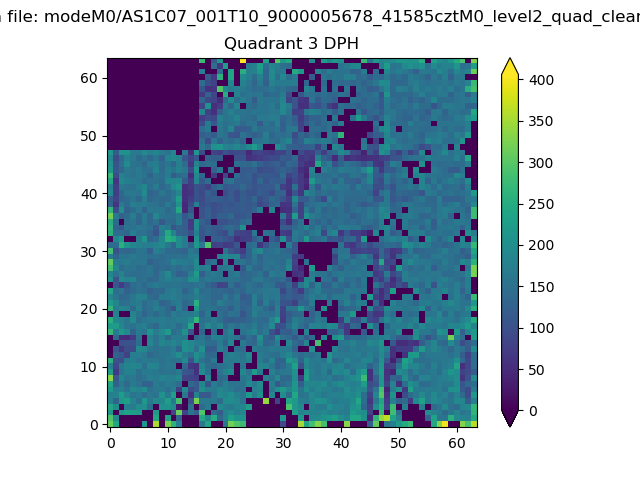 |
 |
Quadrant C |
| Plot type | Count rate plots | Images |
|---|---|---|
| Comparison with Poisson distribution Blue bars denote a histogram of data divided into 1 sec bins. Red curve is a Poisson curve with rate = median count rate of data. |
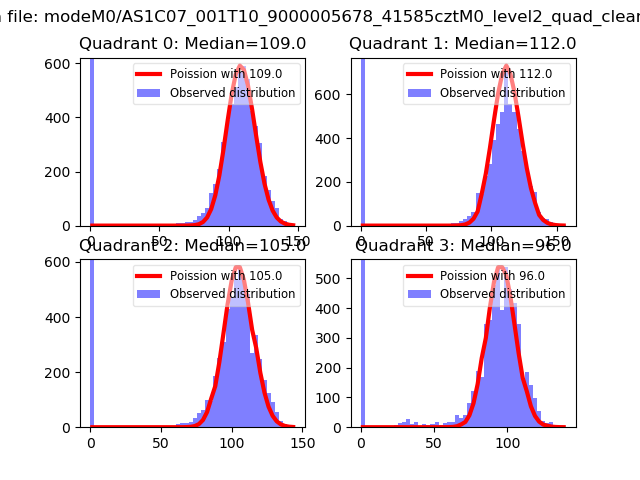 |
 |
| Quadrant-wise count rates Data is divided into 100 sec bins |
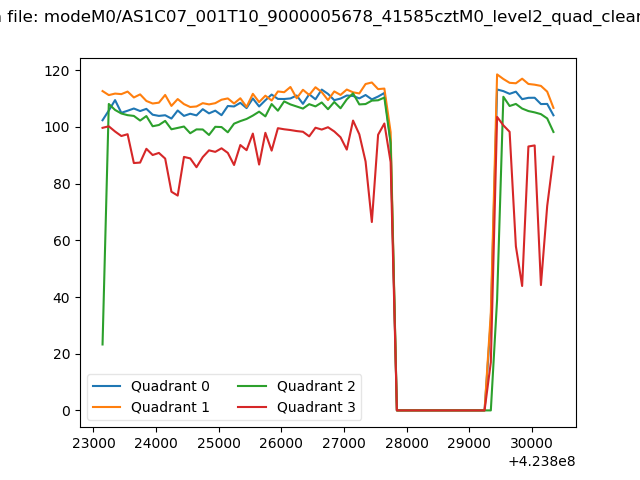 |
|
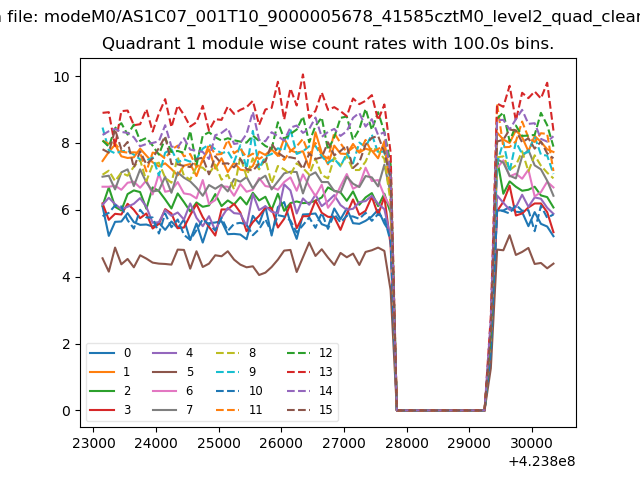
| Module-wise count rates for Quadrant A Data is divided into 100 sec bins |
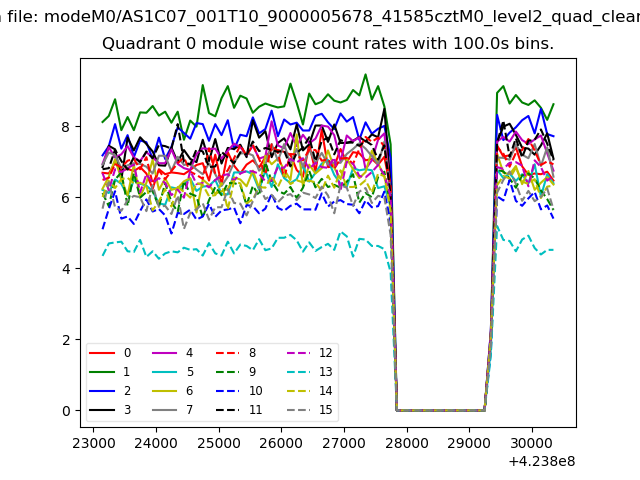 |
 |
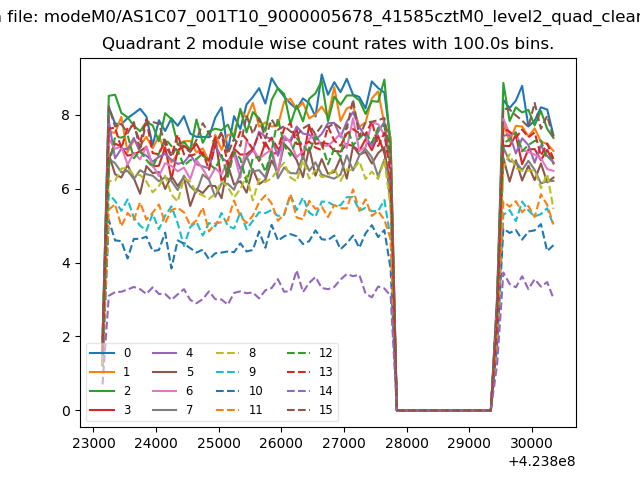
| Module-wise count rates for Quadrant B Data is divided into 100 sec bins |
 |
 |
| Module-wise count rates for Quadrant C Data is divided into 100 sec bins |
 |
 |
| Module-wise count rates for Quadrant D Data is divided into 100 sec bins |
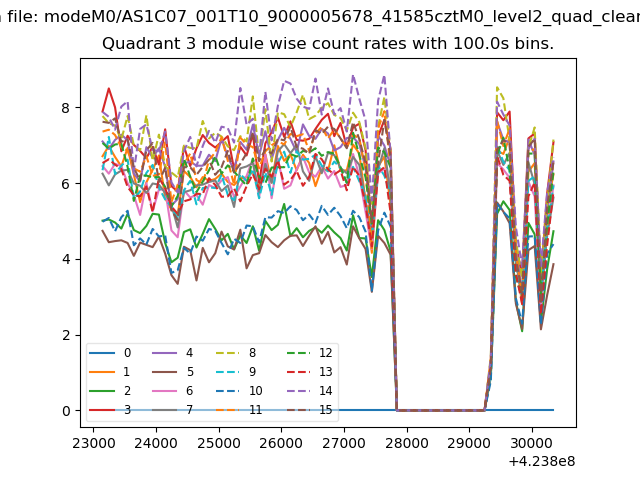 |
 |
| Parameter | Plot |
|---|---|
| CZT HV Monitor | 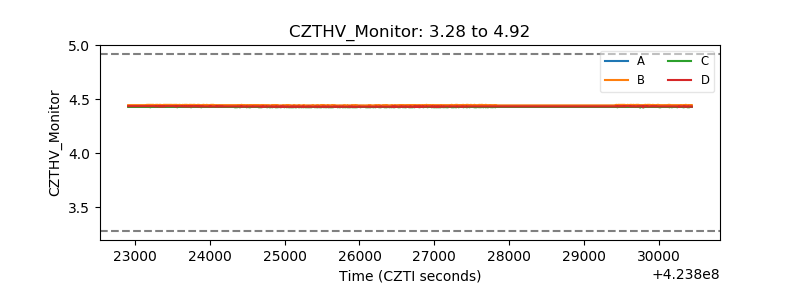 |
| D_VDD | 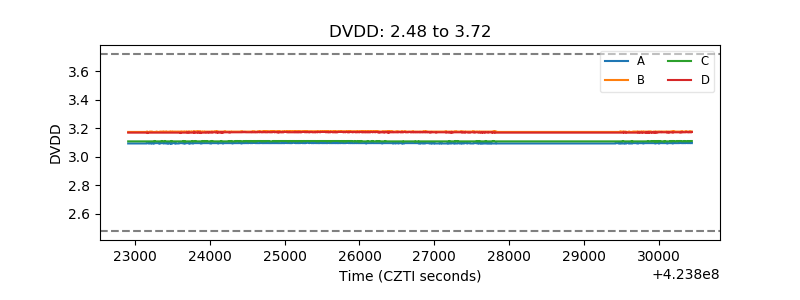 |
| Temperature 1 | 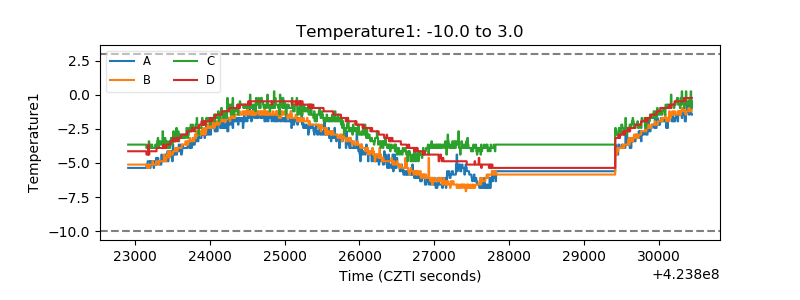 |
| Veto HV Monitor | 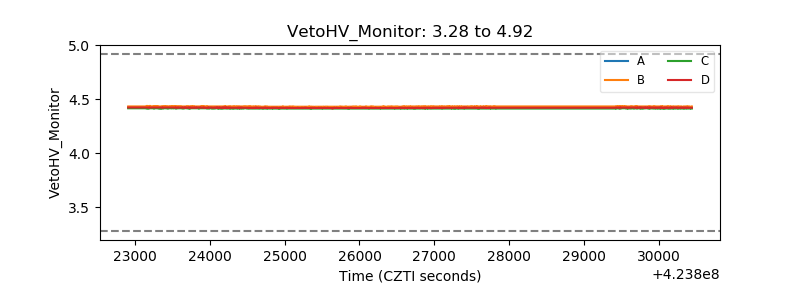 |
| Veto LLD | 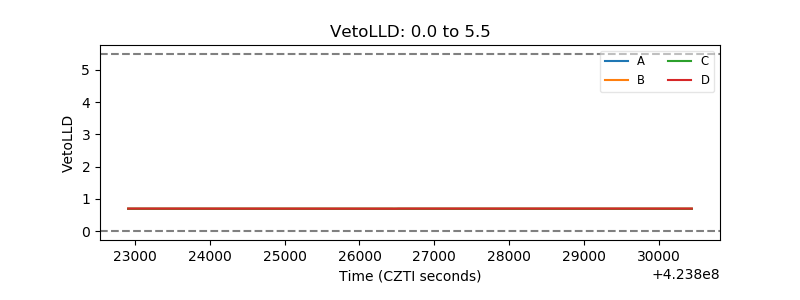 |
| Alpha Counter | 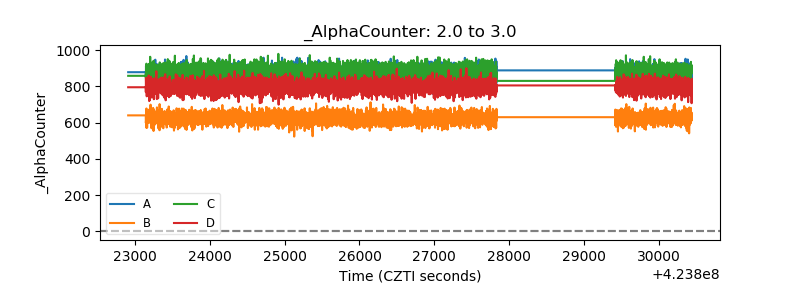 |
| _CPM_Rate | 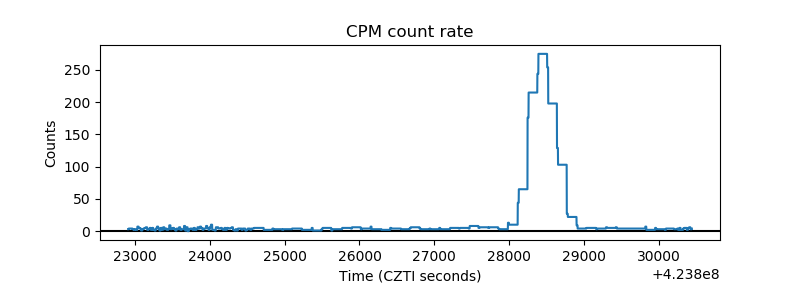 |
| CZT Counter | 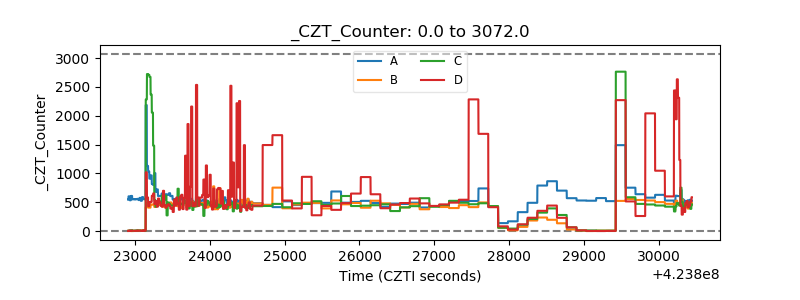 |
| +2.5 Volts monitor | 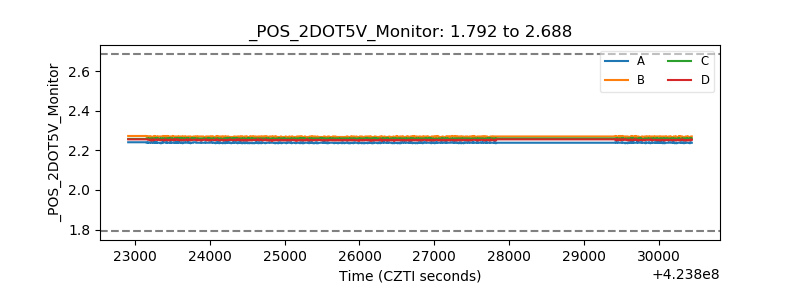 |
| +5 Volts monitor | 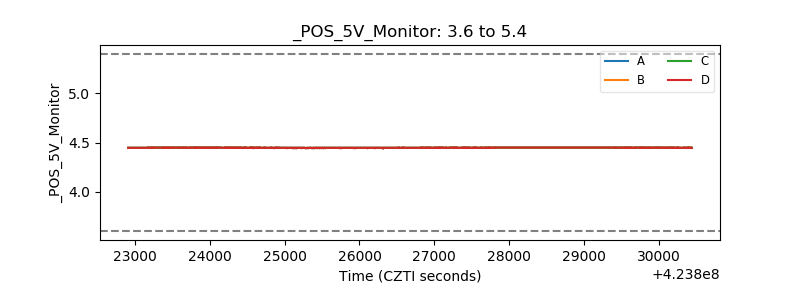 |
| _ROLL_ROT | 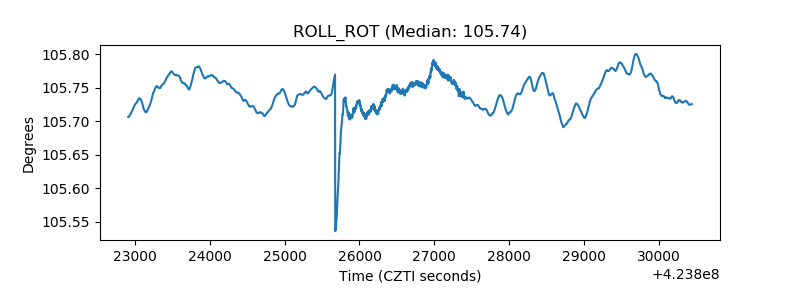 |
| _Roll_DEC | 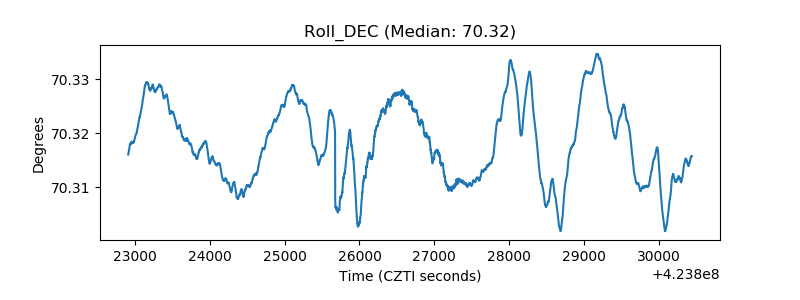 |
| _Roll_RA | 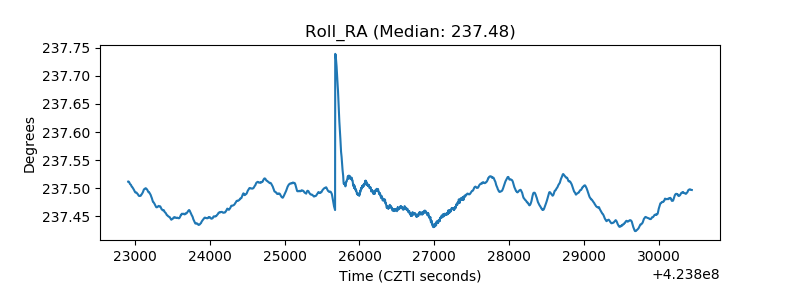 |
| Veto Counter | 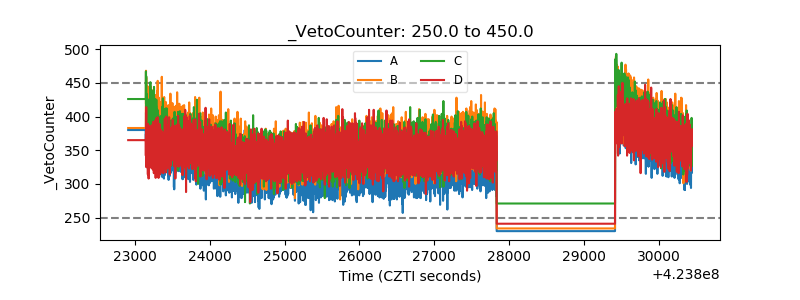 |