| Param | Original file | Final file |
|---|---|---|
| Filename | modeM0/AS1C07_001T10_9000005678_41586cztM0_level2.fits | modeM0/AS1C07_001T10_9000005678_41586cztM0_level2_quad_clean.evt |
| Size (bytes) | 387,285,120 | 89,654,400 |
| Size | 369.3 MB | 85.5 MB |
| Events in quadrant A | 3,302,316 | 619,196 |
| Events in quadrant B | 2,662,001 | 638,471 |
| Events in quadrant C | 3,252,346 | 576,516 |
| Events in quadrant D | 4,683,262 | 488,818 |
| Mode SS | |||
|---|---|---|---|
| Quadrant | BADHDUFLAG | Total packets | Discarded packets |
| A | 0 | 114 | 0 |
| B | 0 | 114 | 0 |
| C | 0 | 114 | 0 |
| D | 0 | 114 | 0 |
| Mode M0 | |||
|---|---|---|---|
| Quadrant | BADHDUFLAG | Total packets | Discarded packets |
| A | 0 | 13278 | 2 |
| B | 0 | 11652 | 2 |
| C | 0 | 13225 | 2 |
| D | 0 | 17851 | 2 |
| Mode M9 | |||
|---|---|---|---|
| Quadrant | BADHDUFLAG | Total packets | Discarded packets |
| A | 0 | 27 | 0 |
| B | 0 | 27 | 0 |
| C | 0 | 28 | 0 |
| D | 0 | 28 | 0 |
| Quadrant | Total seconds | Saturated seconds | Saturation percentage |
|---|---|---|---|
| A | 5599 | 83 | 1.482408% |
| B | 5599 | 14 | 0.250045% |
| C | 5599 | 256 | 4.572245% |
| D | 5599 | 793 | 14.163243% |
Noise dominated data is calculated using 1-second bins in cleaned event files. If a bin has >2000 counts, and if more than 50% of those come from <1% of pixels, then it is considered to be noise-dominated and hence unusable.
| Quadrant | # 1 sec bins | Bins with >0 counts | Bins with >2000 counts | High rate bins dominated by noise | Noise dominated (total time) | Noise dominated (detector-on time) | Marked lightcurve |
|---|---|---|---|---|---|---|---|
| A | 7301 | 5600 | 50 | 50 | 0.68% | 0.89% | 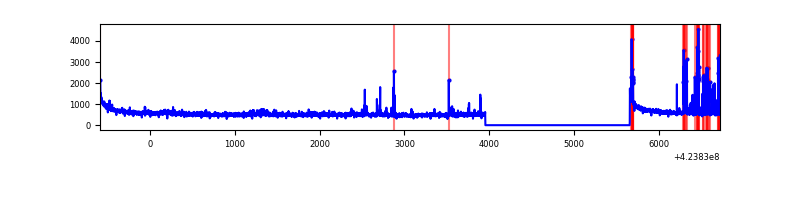 |
| B | 7301 | 5600 | 6 | 6 | 0.08% | 0.11% | 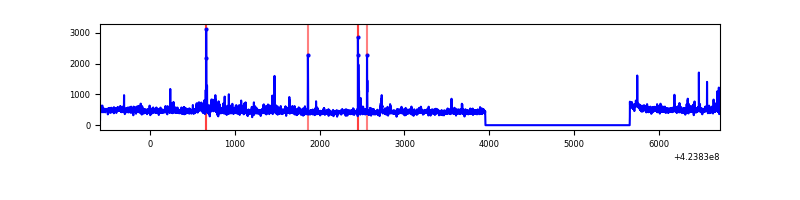 |
| C | 7301 | 5600 | 229 | 229 | 3.14% | 4.09% | 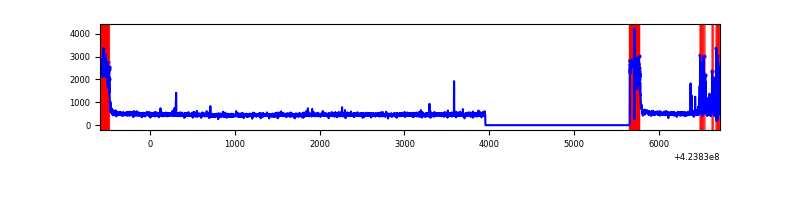 |
| D | 7301 | 5600 | 547 | 547 | 7.49% | 9.77% | 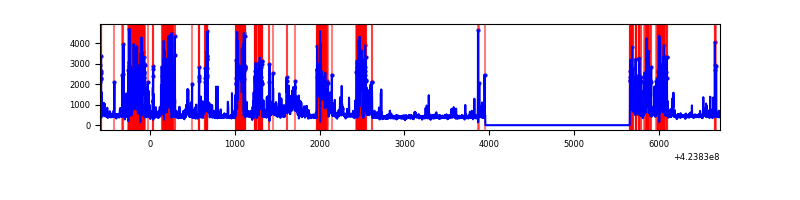 |
Top three noisy pixels from each quadrant. If the there are fewer than three noisy pixels in the level2.evt file, extra rows are filled as -1
| Pixel properties | Quadrant properties | ||||||
|---|---|---|---|---|---|---|---|
| Quadrant | DetID | PixID | Counts | Sigma | Mean | Median | Sigma |
| A | 10 | 83 | 589529 | 4618.98 | 618 | 607 | 127.5 |
| A | 2 | 79 | 242976 | 1900.93 | 618 | 607 | 127.5 |
| A | 15 | 223 | 49784 | 385.7 | 618 | 607 | 127.5 |
| B | 0 | 245 | 49276 | 412.71 | 614 | 597 | 117.9 |
| B | 0 | 189 | 48565 | 406.68 | 614 | 597 | 117.9 |
| B | 5 | 255 | 46053 | 385.38 | 614 | 597 | 117.9 |
| C | 0 | 10 | 564751 | 4184.14 | 585 | 587 | 134.8 |
| C | 15 | 214 | 243551 | 1801.95 | 585 | 587 | 134.8 |
| C | 4 | 254 | 145111 | 1071.87 | 585 | 587 | 134.8 |
| D | 13 | 249 | 2005458 | 14582.65 | 557 | 539 | 137.5 |
| D | 10 | 199 | 118783 | 860.04 | 557 | 539 | 137.5 |
| D | 2 | 120 | 112404 | 813.64 | 557 | 539 | 137.5 |
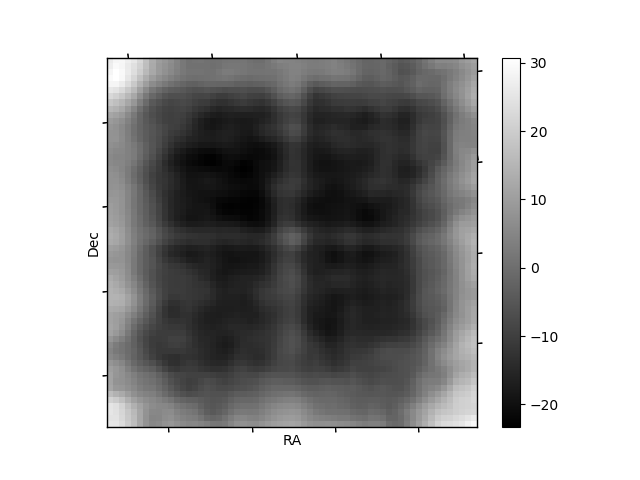
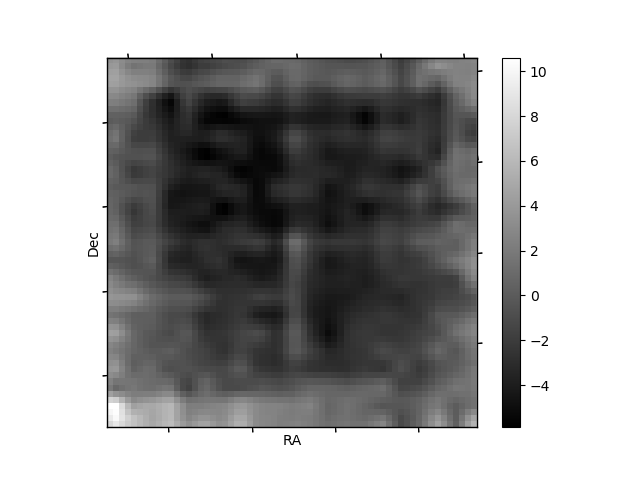
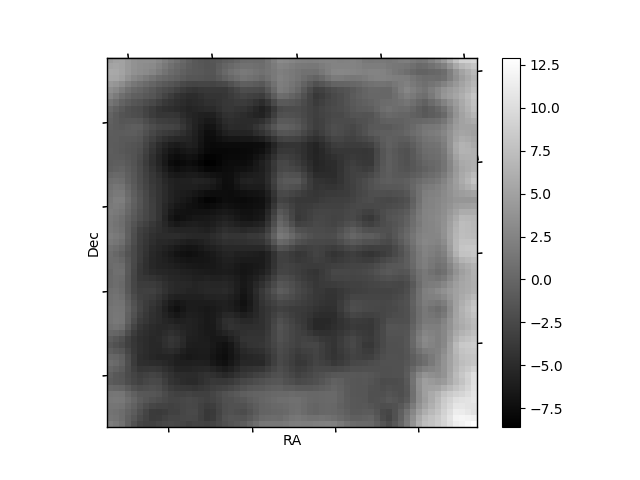
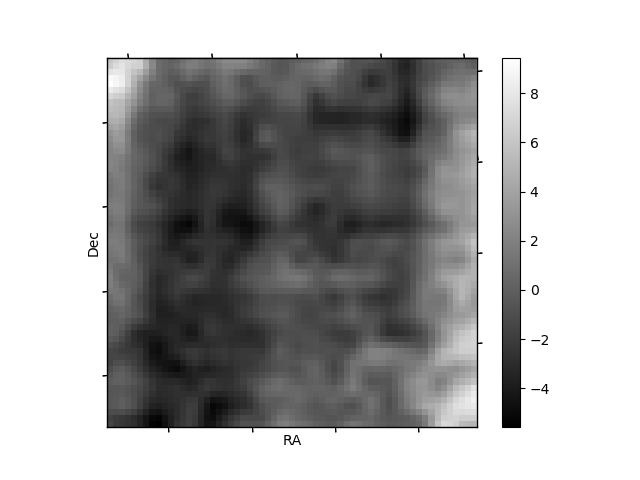
Histogram calculated using DETX and DETY for each event in the final _common_clean file
| Quadrant A | 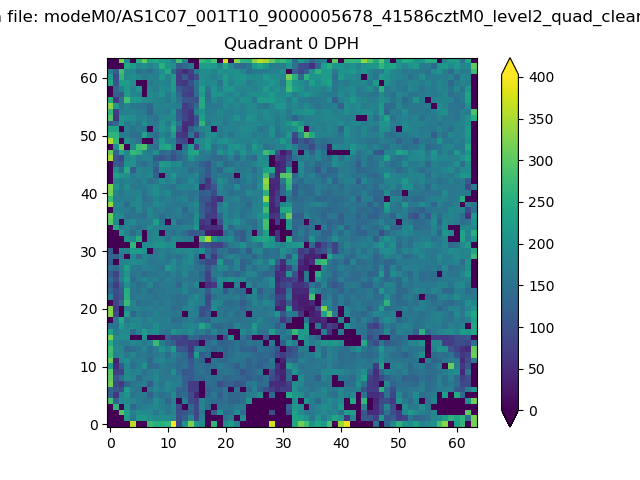 |
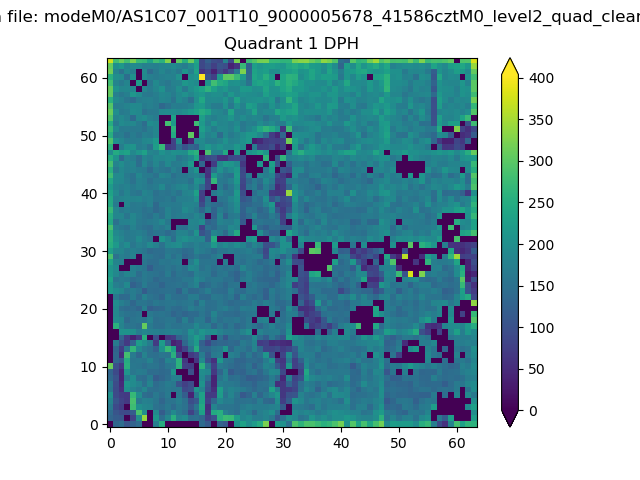 |
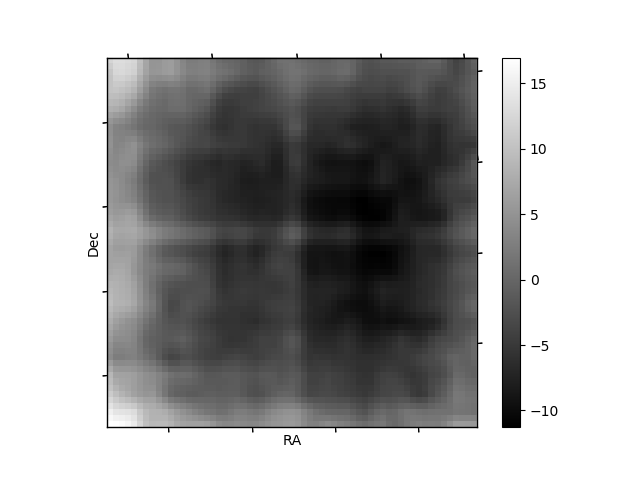
Quadrant B |
|---|---|---|---|
| Quadrant D | 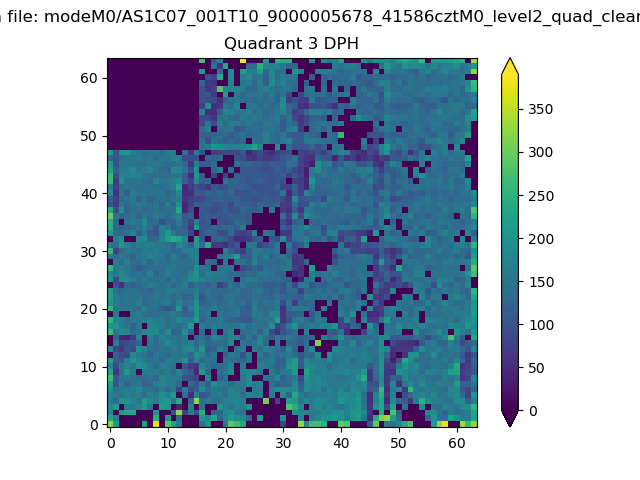 |
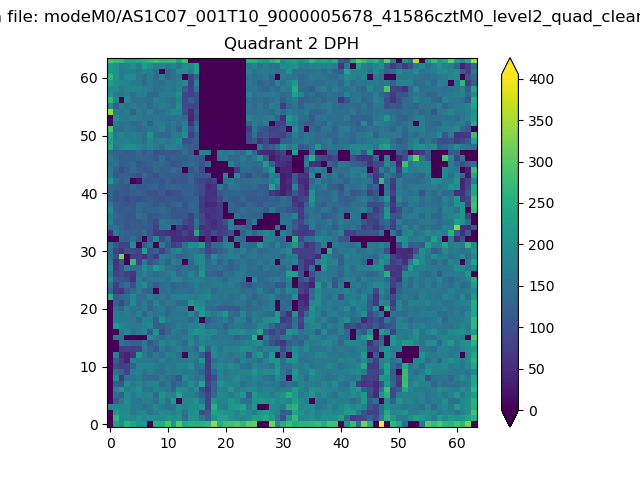 |
Quadrant C |
| Plot type | Count rate plots | Images |
|---|---|---|
| Comparison with Poisson distribution Blue bars denote a histogram of data divided into 1 sec bins. Red curve is a Poisson curve with rate = median count rate of data. |
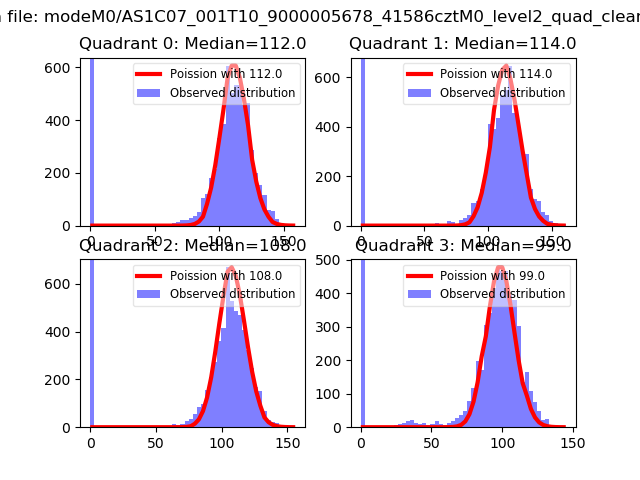 |
 |
| Quadrant-wise count rates Data is divided into 100 sec bins |
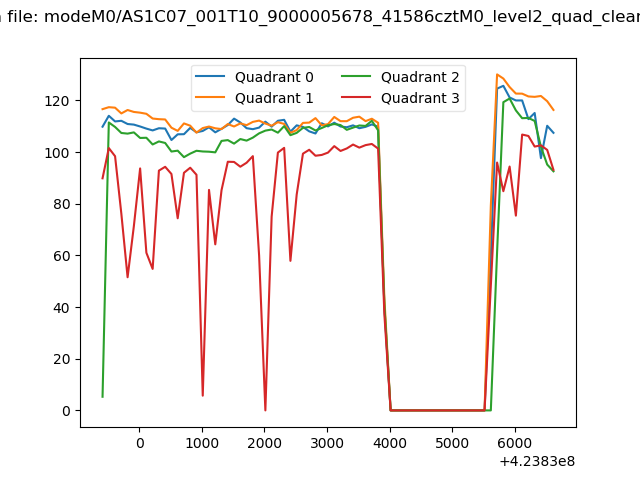 |
|
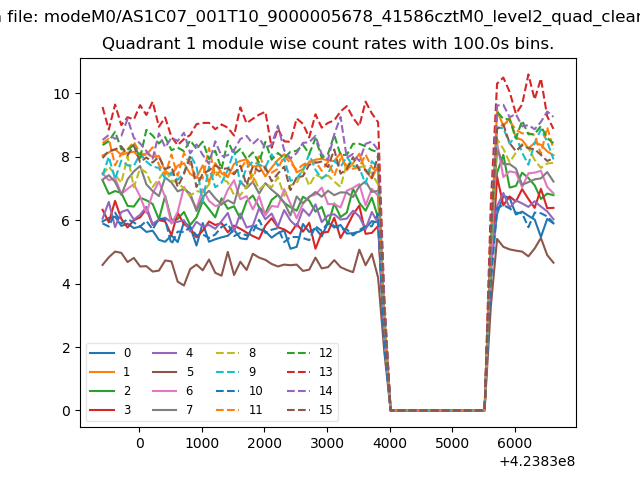
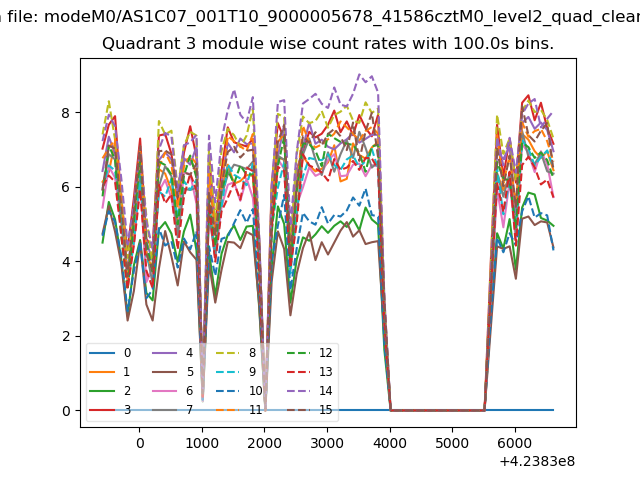
| Module-wise count rates for Quadrant A Data is divided into 100 sec bins |
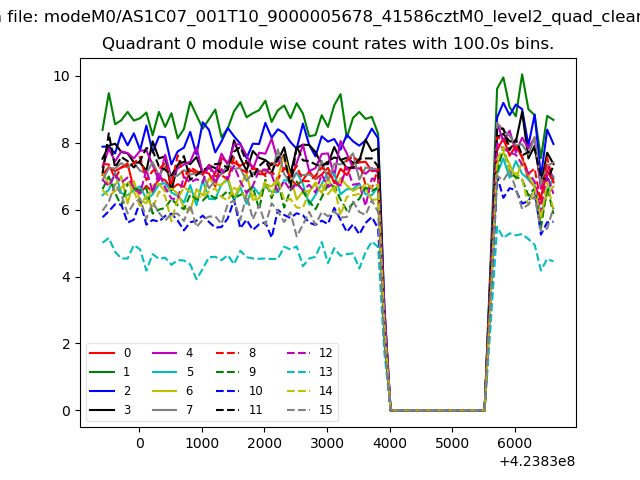 |
 |
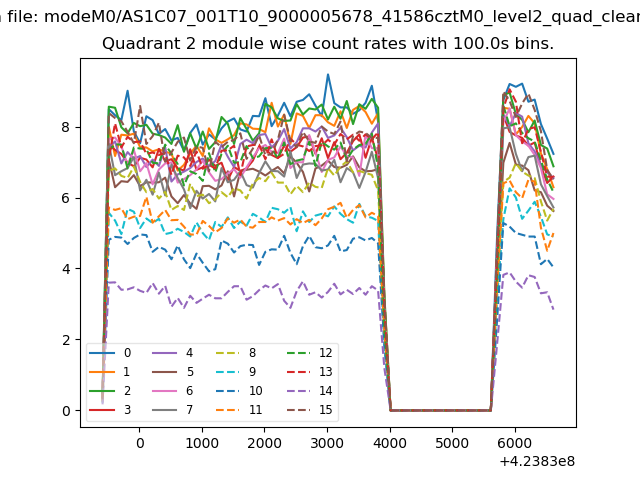
| Module-wise count rates for Quadrant B Data is divided into 100 sec bins |
 |
 |
| Module-wise count rates for Quadrant C Data is divided into 100 sec bins |
 |
 |
| Module-wise count rates for Quadrant D Data is divided into 100 sec bins |
 |
 |
| Parameter | Plot |
|---|---|
| CZT HV Monitor | 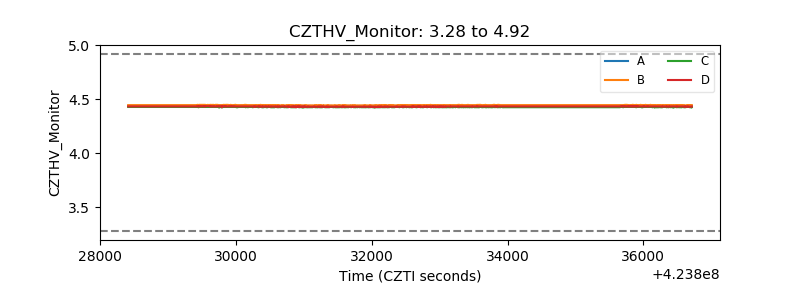 |
| D_VDD | 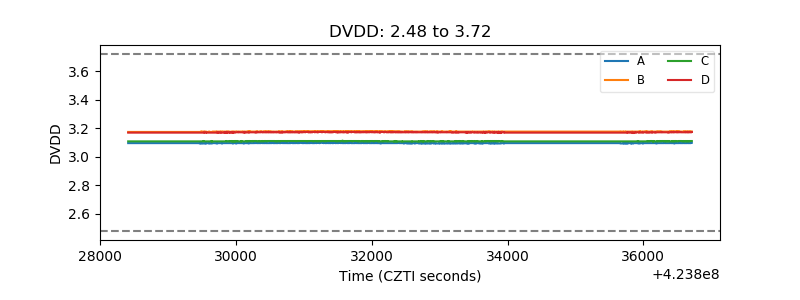 |
| Temperature 1 | 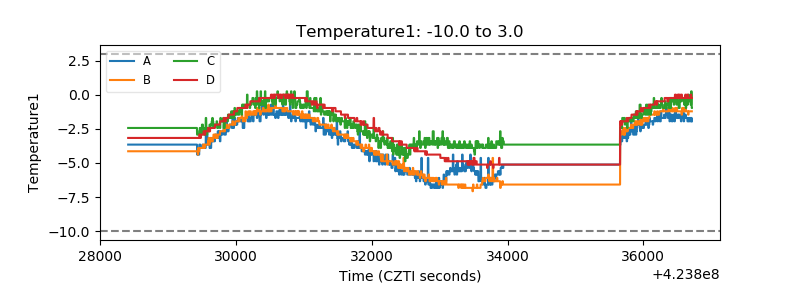 |
| Veto HV Monitor |  |
| Veto LLD | 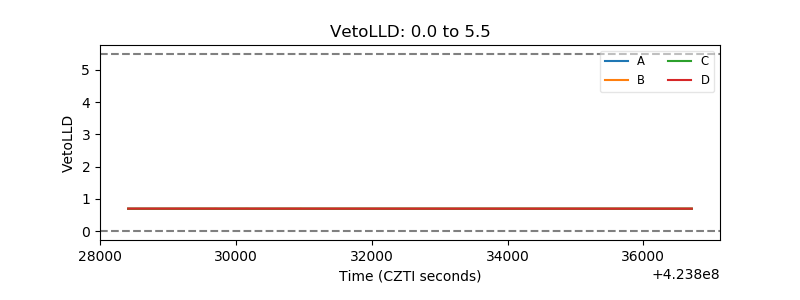 |
| Alpha Counter | 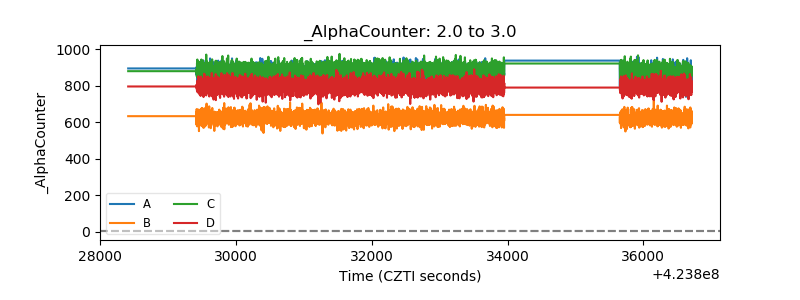 |
| _CPM_Rate | 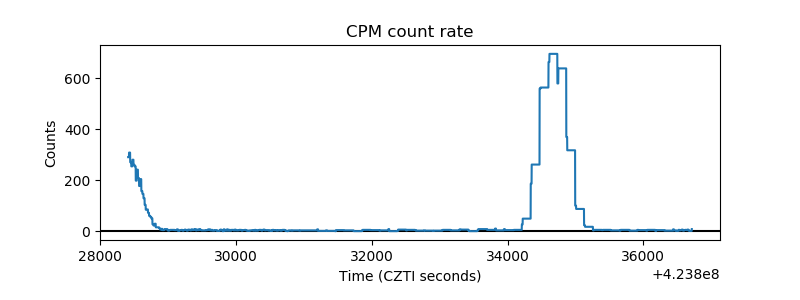 |
| CZT Counter | 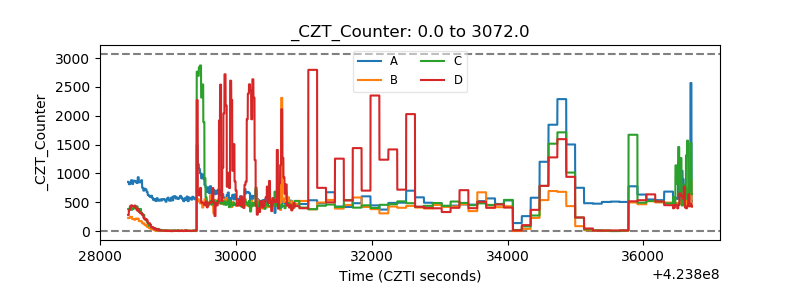 |
| +2.5 Volts monitor | 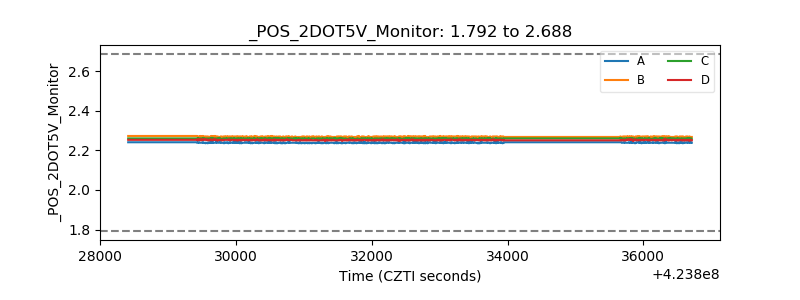 |
| +5 Volts monitor | 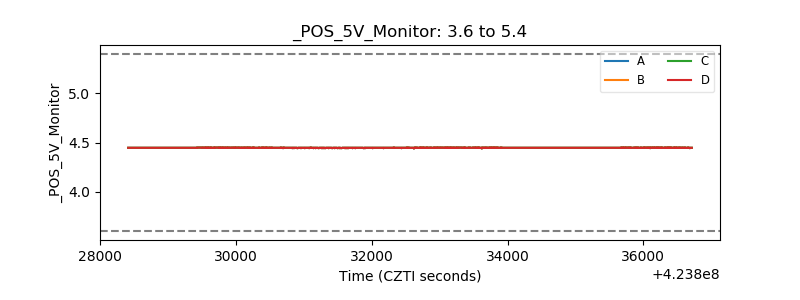 |
| _ROLL_ROT | 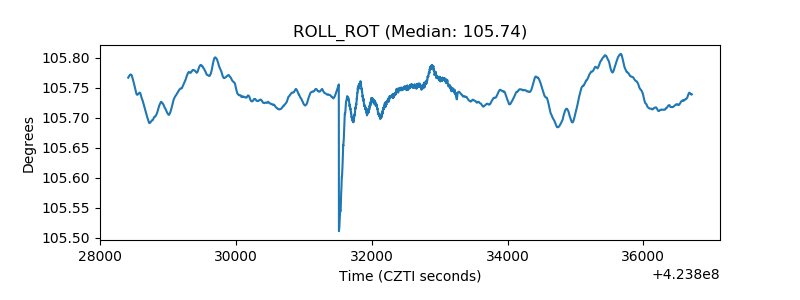 |
| _Roll_DEC | 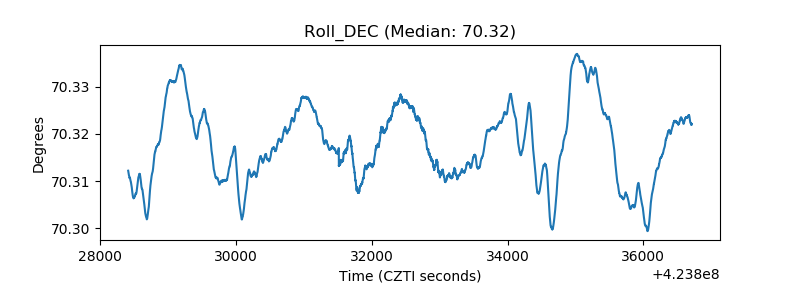 |
| _Roll_RA | 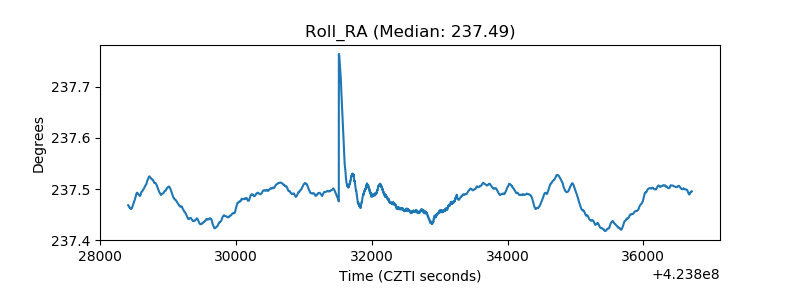 |
| Veto Counter | 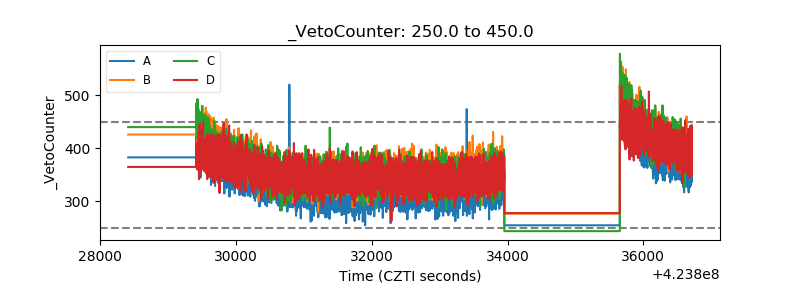 |