| Param | Original file | Final file |
|---|---|---|
| Filename | modeM0/AS1C07_001T10_9000005678_41588cztM0_level2.fits | modeM0/AS1C07_001T10_9000005678_41588cztM0_level2_quad_clean.evt |
| Size (bytes) | 389,096,640 | 90,478,080 |
| Size | 371.1 MB | 86.3 MB |
| Events in quadrant A | 3,246,889 | 627,855 |
| Events in quadrant B | 2,723,317 | 645,804 |
| Events in quadrant C | 4,720,441 | 533,845 |
| Events in quadrant D | 3,289,925 | 553,093 |
| Mode SS | |||
|---|---|---|---|
| Quadrant | BADHDUFLAG | Total packets | Discarded packets |
| A | 0 | 108 | 0 |
| B | 0 | 108 | 0 |
| C | 0 | 108 | 0 |
| D | 0 | 108 | 0 |
| Mode M0 | |||
|---|---|---|---|
| Quadrant | BADHDUFLAG | Total packets | Discarded packets |
| A | 0 | 13137 | 2 |
| B | 0 | 11795 | 2 |
| C | 0 | 17419 | 2 |
| D | 0 | 13533 | 2 |
| Mode M9 | |||
|---|---|---|---|
| Quadrant | BADHDUFLAG | Total packets | Discarded packets |
| A | 0 | 24 | 0 |
| B | 0 | 24 | 0 |
| C | 0 | 24 | 0 |
| D | 0 | 24 | 0 |
| Quadrant | Total seconds | Saturated seconds | Saturation percentage |
|---|---|---|---|
| A | 5424 | 89 | 1.640855% |
| B | 5424 | 12 | 0.221239% |
| C | 5424 | 832 | 15.339233% |
| D | 5424 | 229 | 4.221976% |
Noise dominated data is calculated using 1-second bins in cleaned event files. If a bin has >2000 counts, and if more than 50% of those come from <1% of pixels, then it is considered to be noise-dominated and hence unusable.
| Quadrant | # 1 sec bins | Bins with >0 counts | Bins with >2000 counts | High rate bins dominated by noise | Noise dominated (total time) | Noise dominated (detector-on time) | Marked lightcurve |
|---|---|---|---|---|---|---|---|
| A | 7246 | 5425 | 53 | 53 | 0.73% | 0.98% | 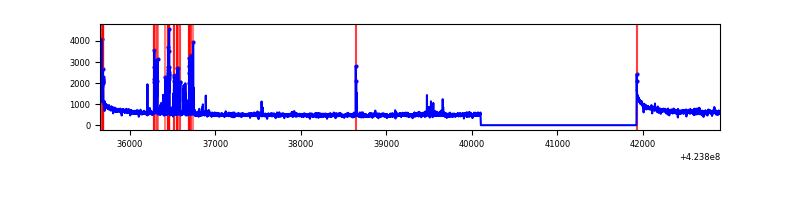 |
| B | 7246 | 5425 | 3 | 3 | 0.04% | 0.06% | 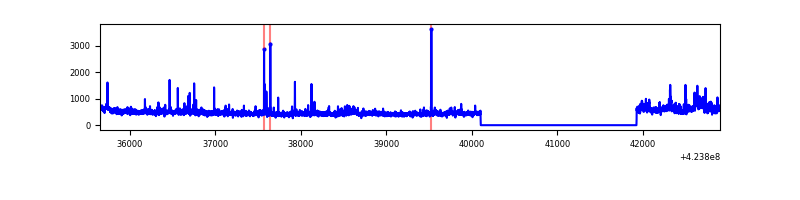 |
| C | 7246 | 5425 | 616 | 616 | 8.50% | 11.35% | 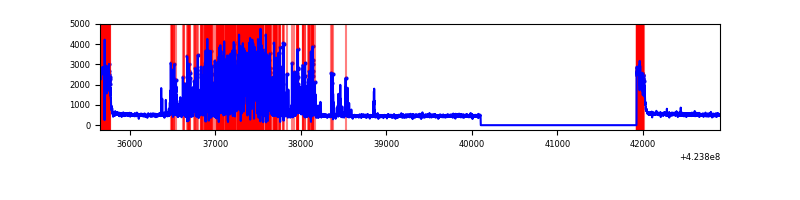 |
| D | 7246 | 5425 | 182 | 182 | 2.51% | 3.35% | 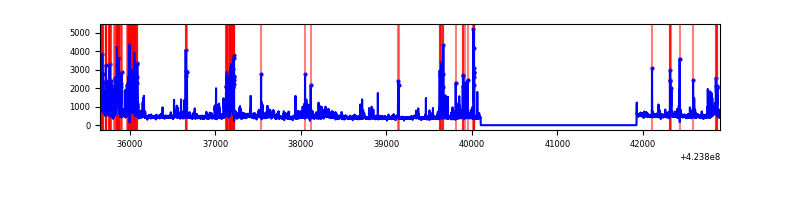 |
Top three noisy pixels from each quadrant. If the there are fewer than three noisy pixels in the level2.evt file, extra rows are filled as -1
| Pixel properties | Quadrant properties | ||||||
|---|---|---|---|---|---|---|---|
| Quadrant | DetID | PixID | Counts | Sigma | Mean | Median | Sigma |
| A | 10 | 83 | 574181 | 4603.44 | 608 | 596 | 124.6 |
| A | 2 | 79 | 231554 | 1853.61 | 608 | 596 | 124.6 |
| A | 15 | 223 | 46233 | 366.27 | 608 | 596 | 124.6 |
| B | 0 | 186 | 125616 | 1083.62 | 605 | 589 | 115.4 |
| B | 0 | 190 | 42493 | 363.19 | 605 | 589 | 115.4 |
| B | 0 | 245 | 38849 | 331.6 | 605 | 589 | 115.4 |
| C | 4 | 254 | 1828861 | 14309.25 | 552 | 555 | 127.8 |
| C | 0 | 10 | 511893 | 4001.99 | 552 | 555 | 127.8 |
| C | 15 | 214 | 222269 | 1735.25 | 552 | 555 | 127.8 |
| D | 13 | 249 | 573559 | 4011.44 | 589 | 571 | 142.8 |
| D | 12 | 6 | 81224 | 564.64 | 589 | 571 | 142.8 |
| D | 2 | 120 | 77078 | 535.62 | 589 | 571 | 142.8 |
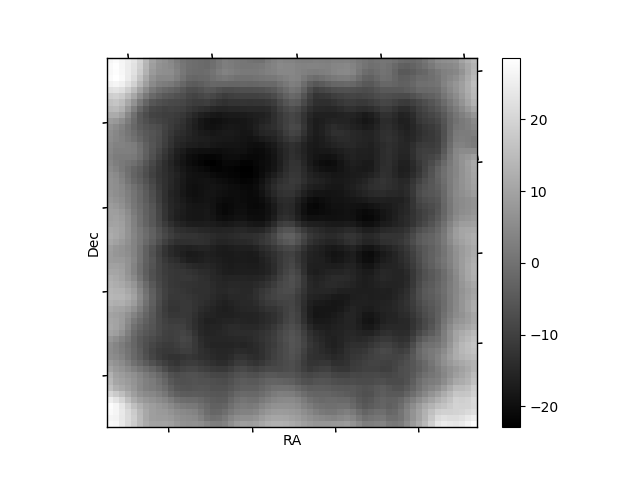
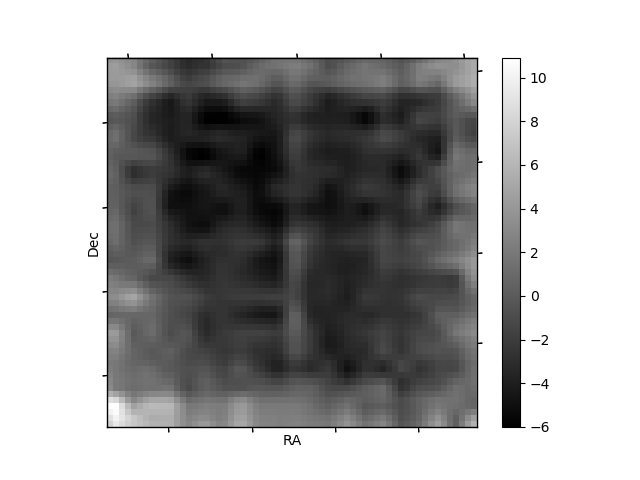
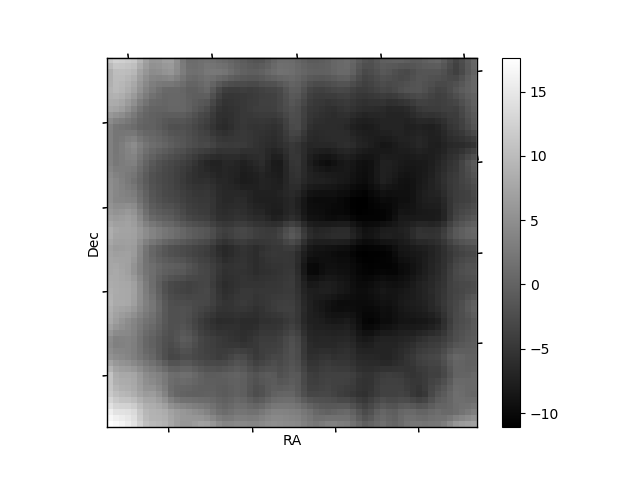
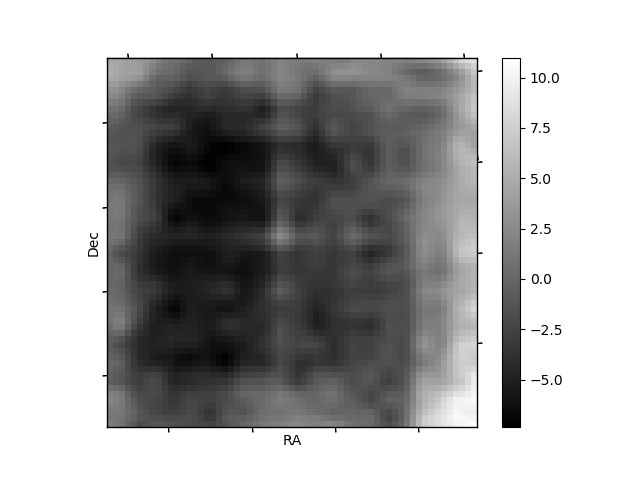
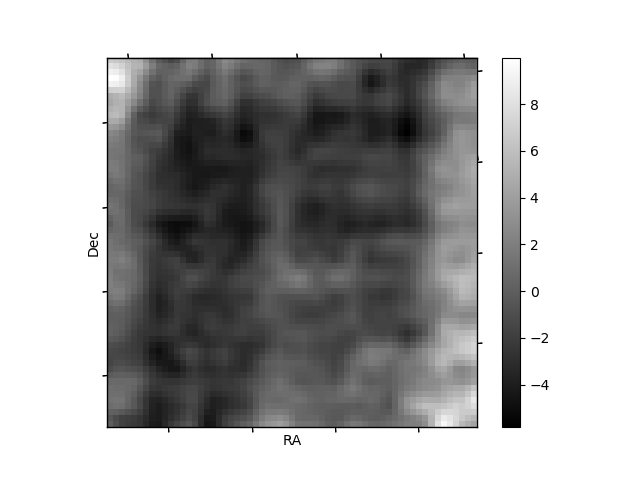
Histogram calculated using DETX and DETY for each event in the final _common_clean file
| Quadrant A | 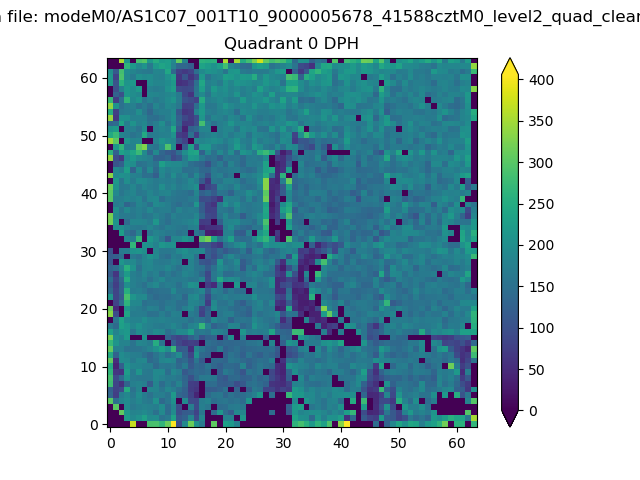 |
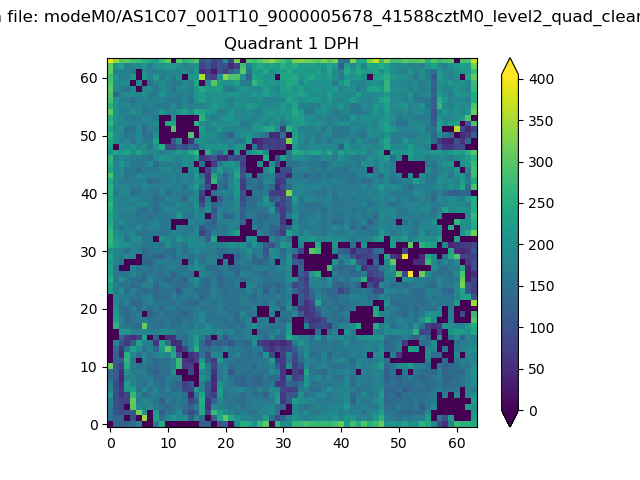 |
Quadrant B |
|---|---|---|---|
| Quadrant D | 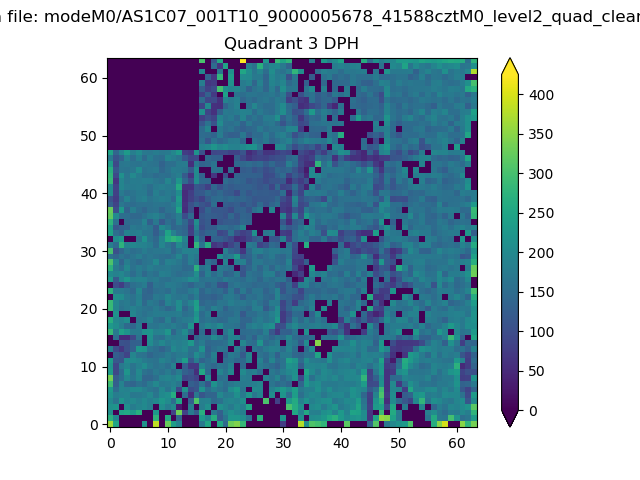 |
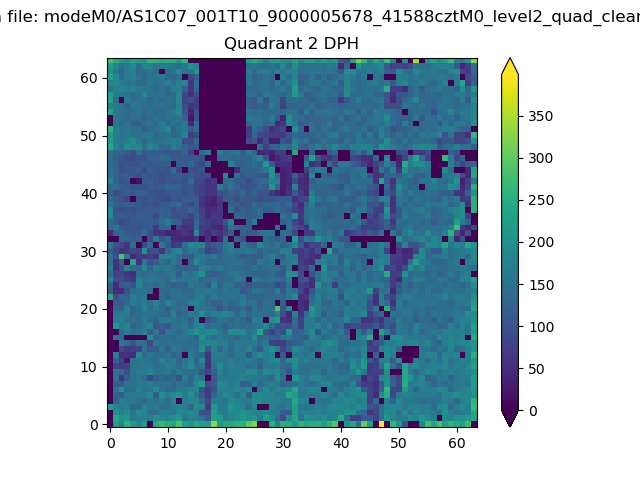 |
Quadrant C |
| Plot type | Count rate plots | Images |
|---|---|---|
| Comparison with Poisson distribution Blue bars denote a histogram of data divided into 1 sec bins. Red curve is a Poisson curve with rate = median count rate of data. |
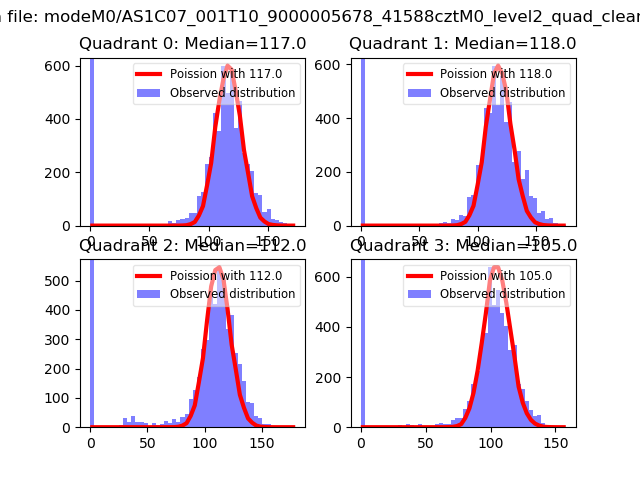 |
 |
| Quadrant-wise count rates Data is divided into 100 sec bins |
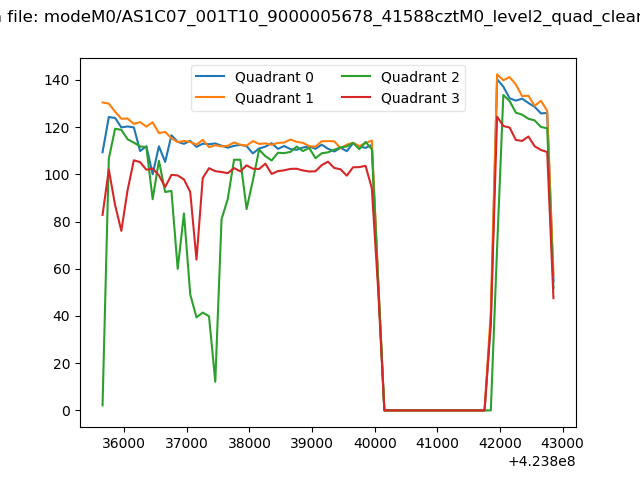 |
|
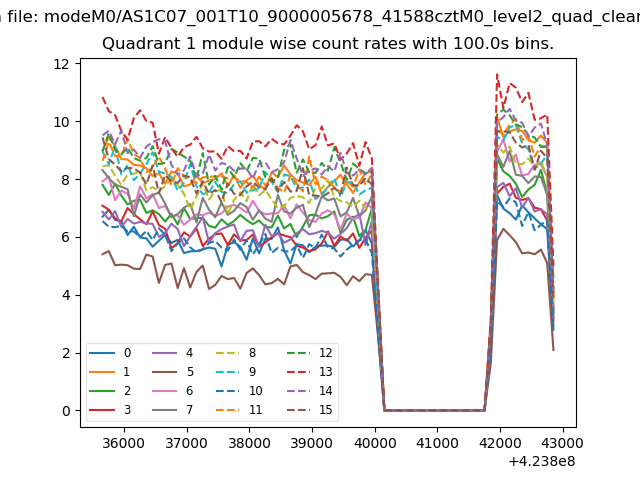
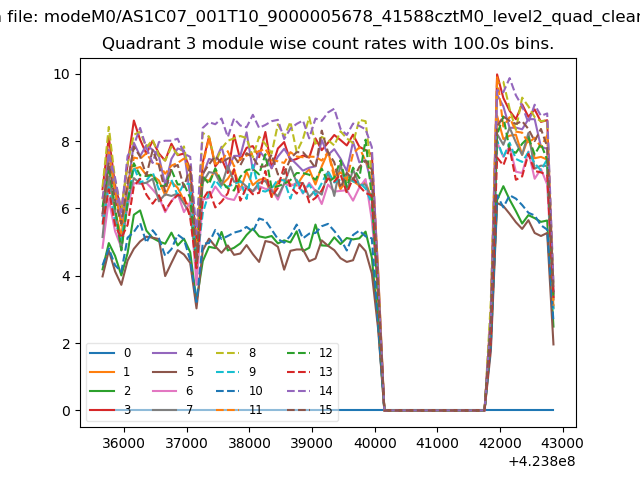
| Module-wise count rates for Quadrant A Data is divided into 100 sec bins |
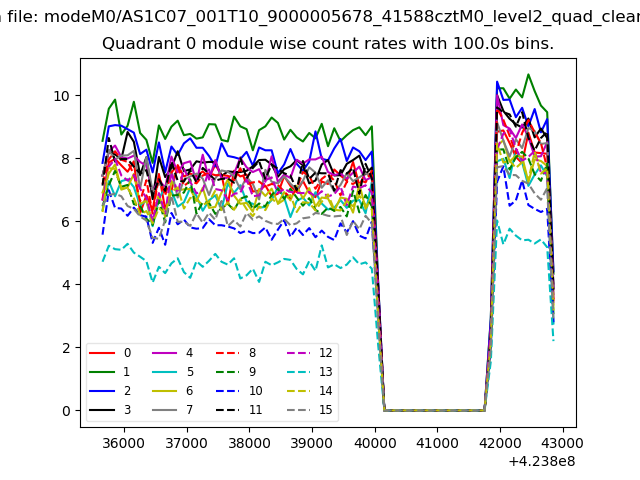 |
 |
| Module-wise count rates for Quadrant B Data is divided into 100 sec bins |
 |
 |
| Module-wise count rates for Quadrant C Data is divided into 100 sec bins |
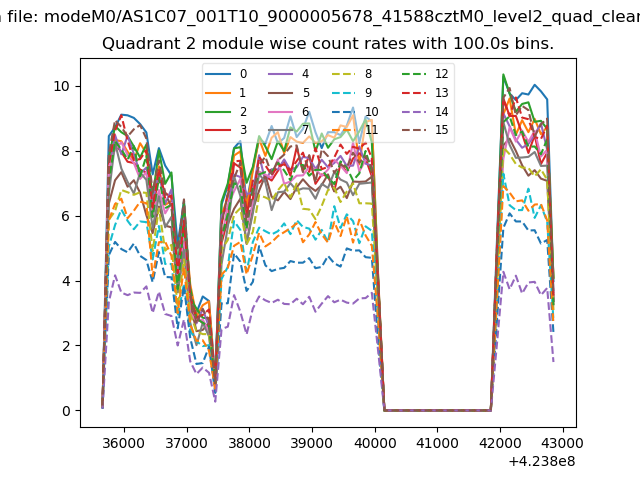 |
 |
| Module-wise count rates for Quadrant D Data is divided into 100 sec bins |
 |
 |
| Parameter | Plot |
|---|---|
| CZT HV Monitor | 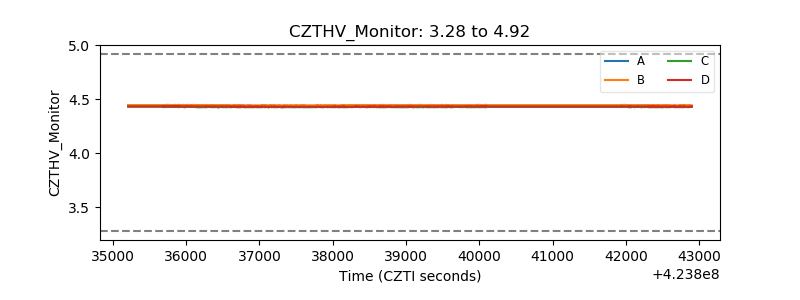 |
| D_VDD | 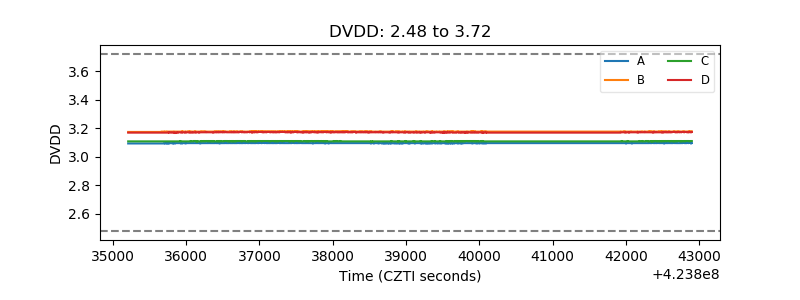 |
| Temperature 1 | 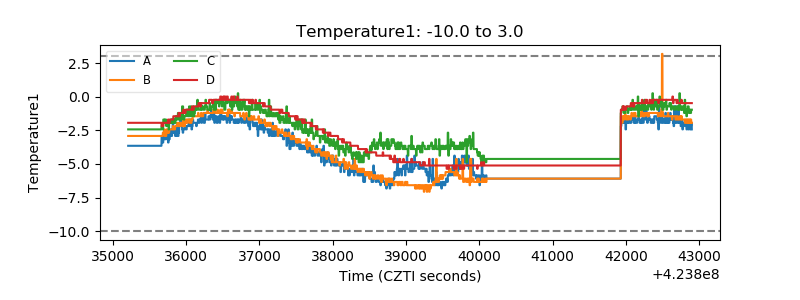 |
| Veto HV Monitor | 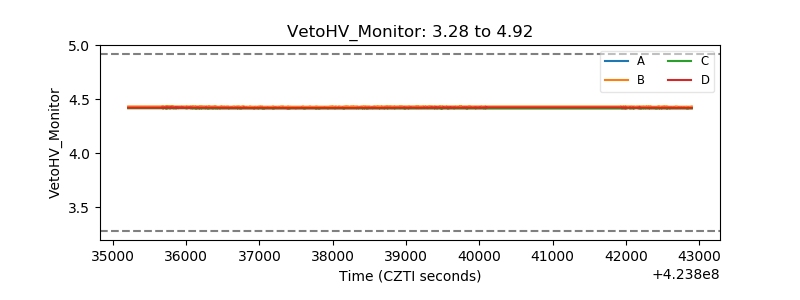 |
| Veto LLD | 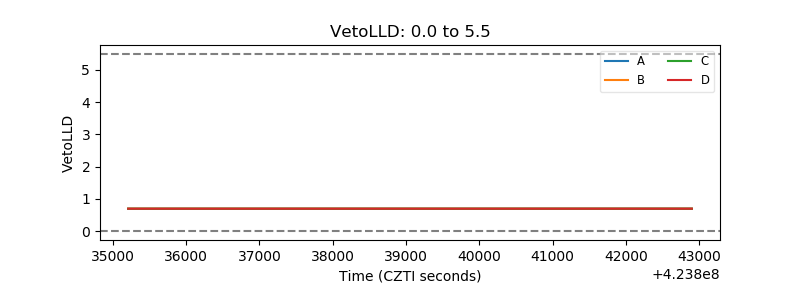 |
| Alpha Counter | 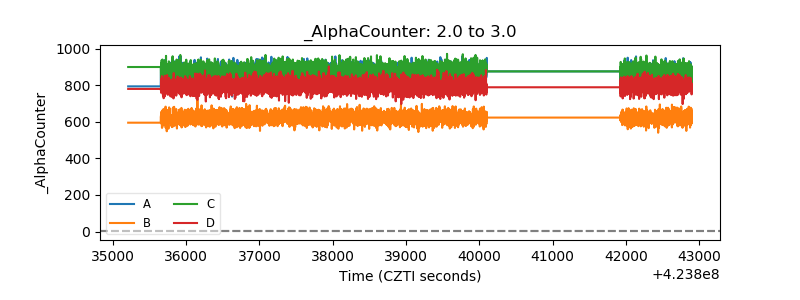 |
| _CPM_Rate | 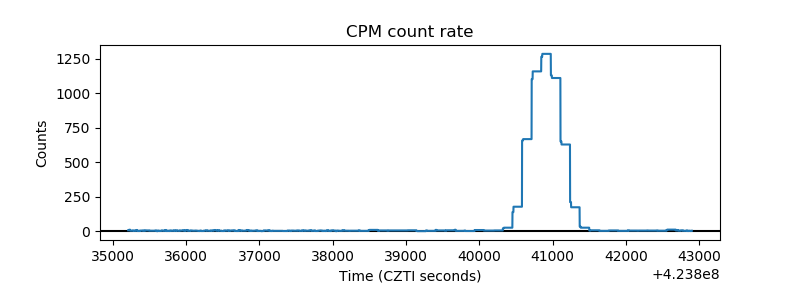 |
| CZT Counter | 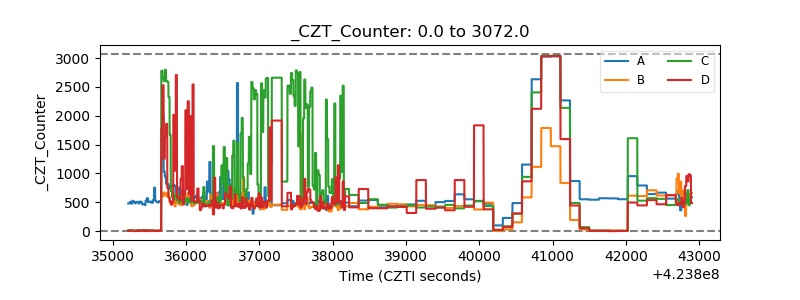 |
| +2.5 Volts monitor | 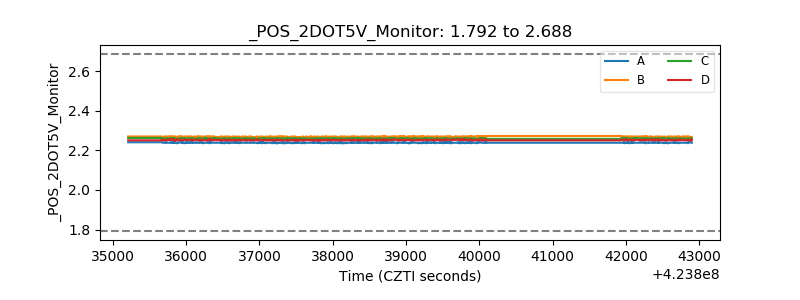 |
| +5 Volts monitor | 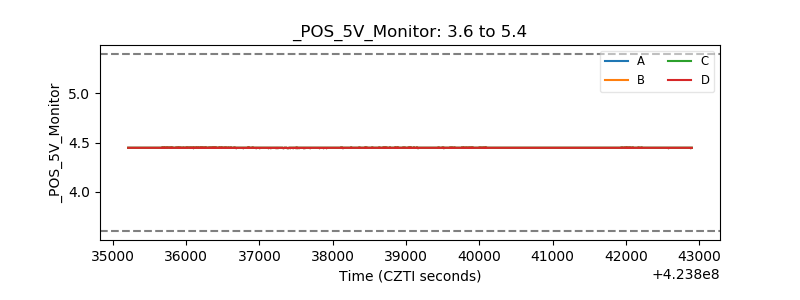 |
| _ROLL_ROT | 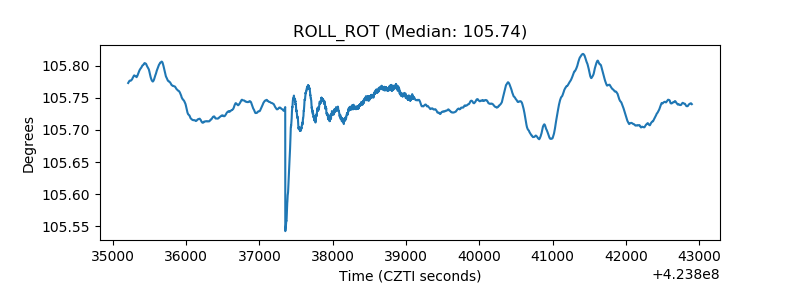 |
| _Roll_DEC | 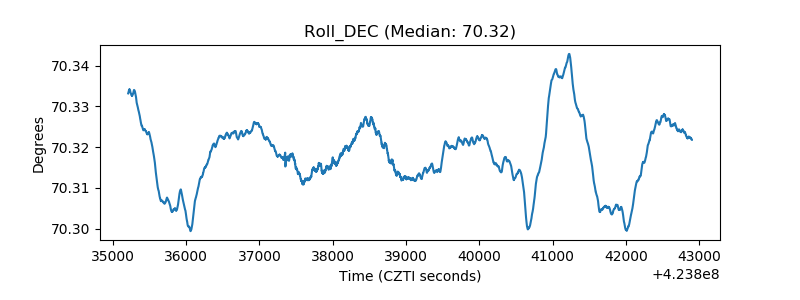 |
| _Roll_RA | 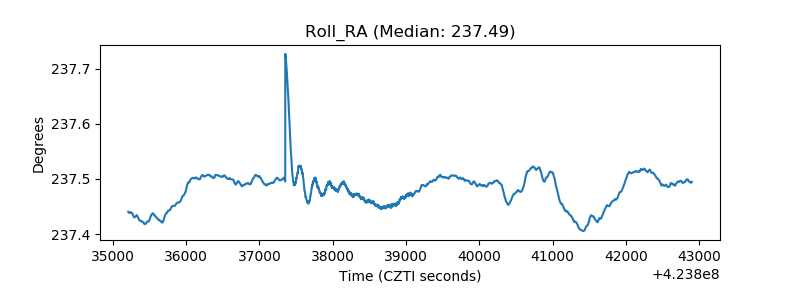 |
| Veto Counter | 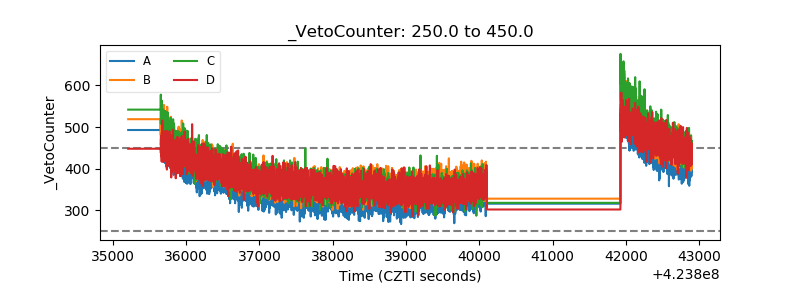 |