| Param | Original file | Final file |
|---|---|---|
| Filename | modeM0/AS1C07_001T10_9000005678_41590cztM0_level2.fits | modeM0/AS1C07_001T10_9000005678_41590cztM0_level2_quad_clean.evt |
| Size (bytes) | 325,990,080 | 91,906,560 |
| Size | 310.9 MB | 87.6 MB |
| Events in quadrant A | 2,853,594 | 628,092 |
| Events in quadrant B | 2,816,651 | 641,567 |
| Events in quadrant C | 2,918,261 | 597,712 |
| Events in quadrant D | 3,088,582 | 564,981 |
| Mode SS | |||
|---|---|---|---|
| Quadrant | BADHDUFLAG | Total packets | Discarded packets |
| A | 0 | 102 | 0 |
| B | 0 | 102 | 0 |
| C | 0 | 102 | 0 |
| D | 0 | 102 | 0 |
| Mode M0 | |||
|---|---|---|---|
| Quadrant | BADHDUFLAG | Total packets | Discarded packets |
| A | 0 | 11605 | 2 |
| B | 0 | 11849 | 2 |
| C | 0 | 11696 | 2 |
| D | 0 | 12647 | 2 |
| Mode M9 | |||
|---|---|---|---|
| Quadrant | BADHDUFLAG | Total packets | Discarded packets |
| A | 0 | 27 | 0 |
| B | 0 | 27 | 0 |
| C | 0 | 28 | 0 |
| D | 0 | 28 | 0 |
| Quadrant | Total seconds | Saturated seconds | Saturation percentage |
|---|---|---|---|
| A | 5004 | 12 | 0.239808% |
| B | 5004 | 25 | 0.499600% |
| C | 5004 | 204 | 4.076739% |
| D | 5004 | 134 | 2.677858% |
Noise dominated data is calculated using 1-second bins in cleaned event files. If a bin has >2000 counts, and if more than 50% of those come from <1% of pixels, then it is considered to be noise-dominated and hence unusable.
| Quadrant | # 1 sec bins | Bins with >0 counts | Bins with >2000 counts | High rate bins dominated by noise | Noise dominated (total time) | Noise dominated (detector-on time) | Marked lightcurve |
|---|---|---|---|---|---|---|---|
| A | 7066 | 5005 | 7 | 7 | 0.10% | 0.14% | 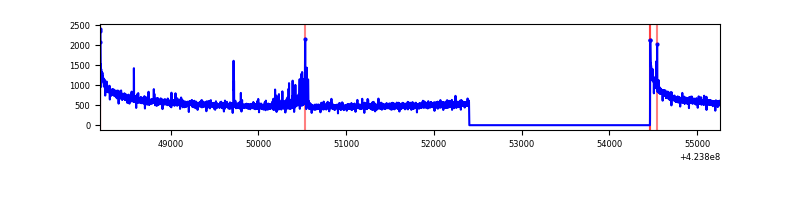 |
| B | 7066 | 5005 | 6 | 6 | 0.08% | 0.12% | 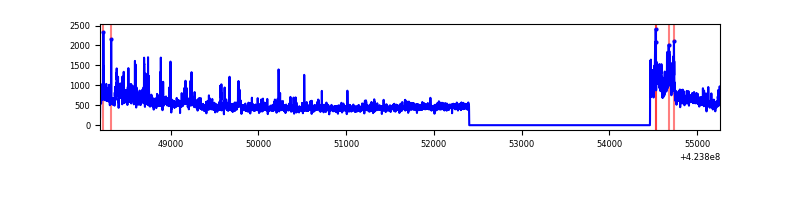 |
| C | 7066 | 5005 | 187 | 187 | 2.65% | 3.74% | 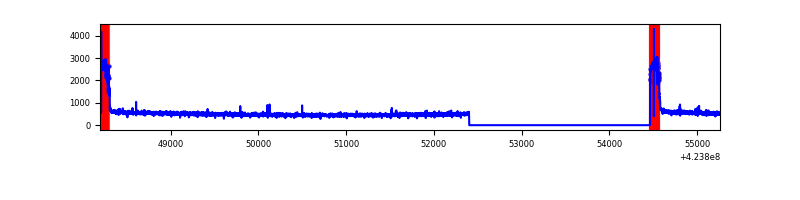 |
| D | 7066 | 5005 | 111 | 111 | 1.57% | 2.22% | 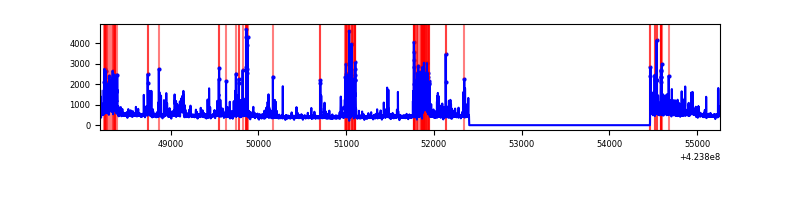 |
Top three noisy pixels from each quadrant. If the there are fewer than three noisy pixels in the level2.evt file, extra rows are filled as -1
| Pixel properties | Quadrant properties | ||||||
|---|---|---|---|---|---|---|---|
| Quadrant | DetID | PixID | Counts | Sigma | Mean | Median | Sigma |
| A | 10 | 83 | 546353 | 4696.64 | 573 | 560 | 116.2 |
| A | 7 | 3 | 54084 | 460.58 | 573 | 560 | 116.2 |
| A | 2 | 79 | 17177 | 142.99 | 573 | 560 | 116.2 |
| B | 0 | 186 | 386106 | 3604.22 | 573 | 559 | 107.0 |
| B | 0 | 189 | 52311 | 483.8 | 573 | 559 | 107.0 |
| B | 0 | 245 | 31874 | 292.74 | 573 | 559 | 107.0 |
| C | 0 | 10 | 513990 | 4018.09 | 558 | 564 | 127.8 |
| C | 15 | 214 | 215036 | 1678.47 | 558 | 564 | 127.8 |
| C | 14 | 67 | 5393 | 37.79 | 558 | 564 | 127.8 |
| D | 13 | 249 | 357605 | 2560.34 | 568 | 554 | 139.5 |
| D | 2 | 249 | 164347 | 1174.52 | 568 | 554 | 139.5 |
| D | 12 | 218 | 102168 | 728.65 | 568 | 554 | 139.5 |
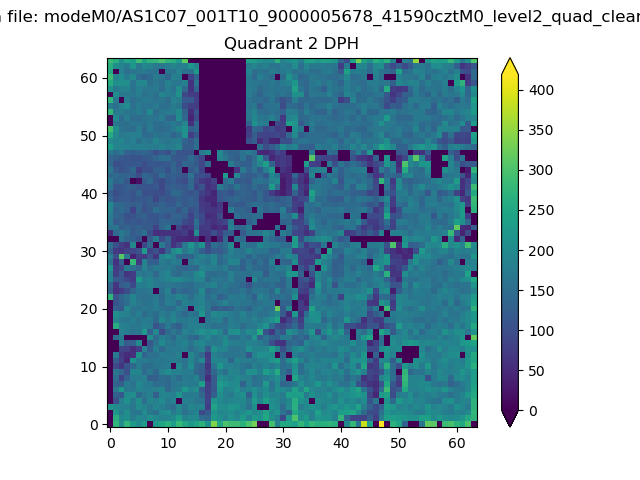
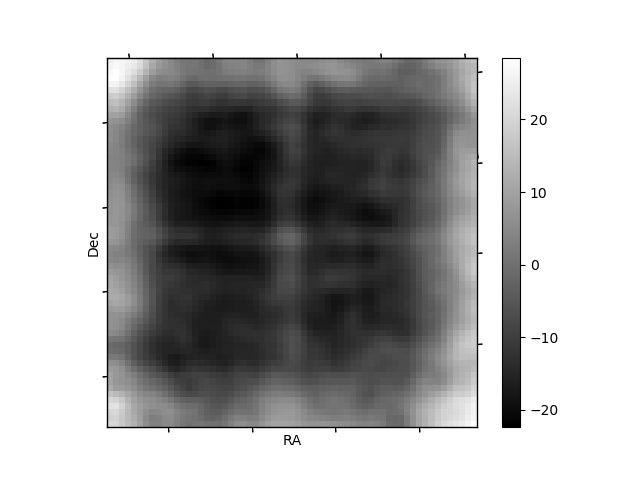
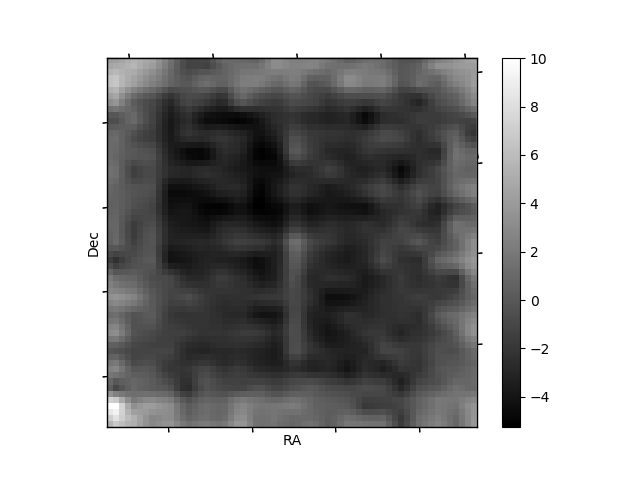
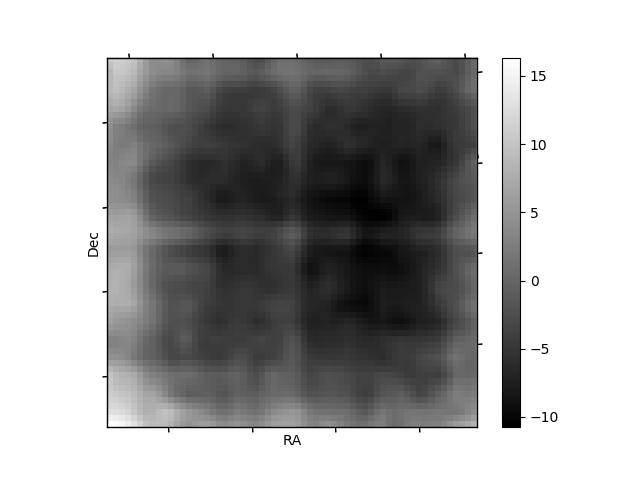
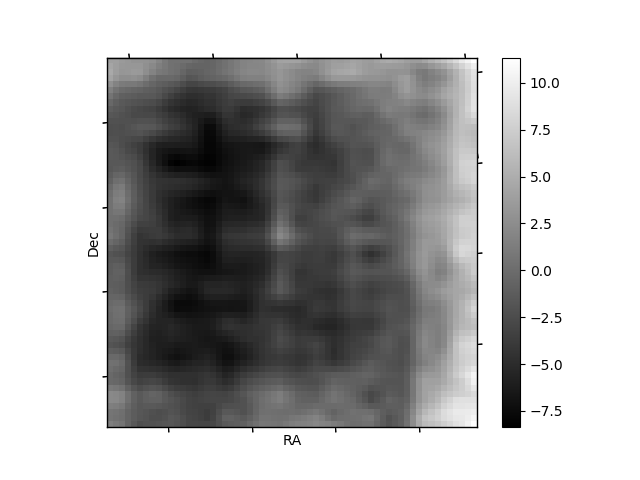
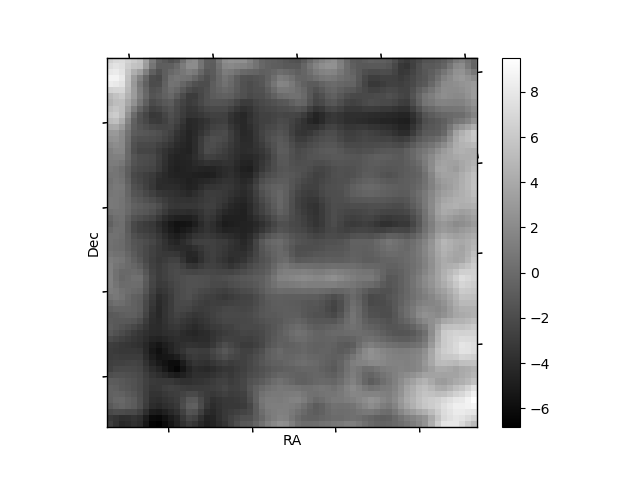
Histogram calculated using DETX and DETY for each event in the final _common_clean file
| Quadrant A | 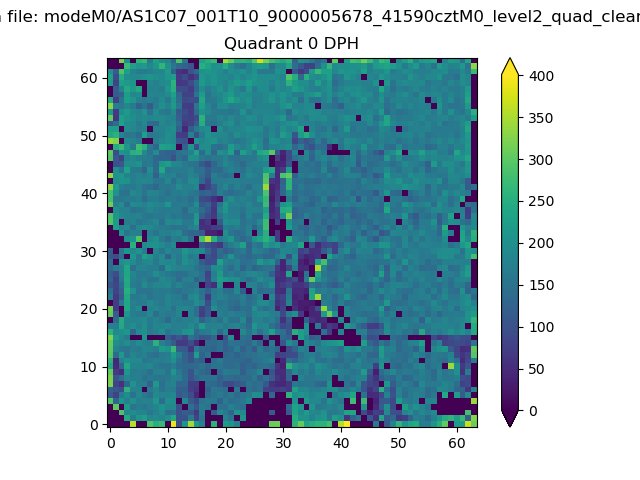 |
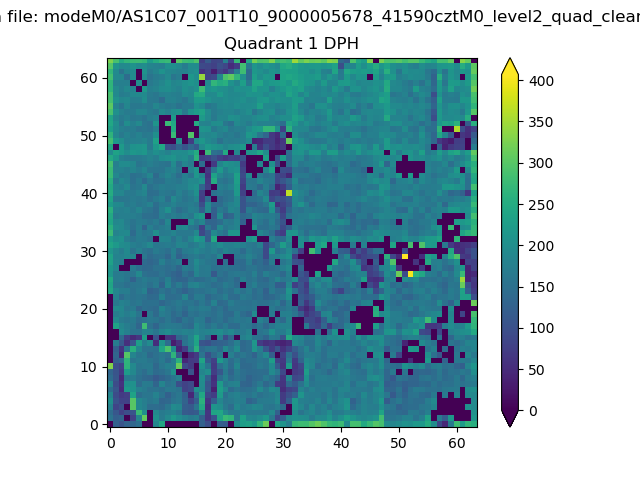 |
Quadrant B |
|---|---|---|---|
| Quadrant D | 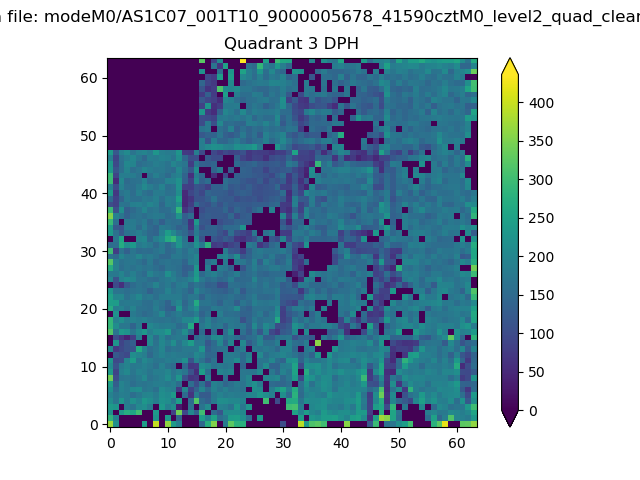 |
 |
Quadrant C |
| Plot type | Count rate plots | Images |
|---|---|---|
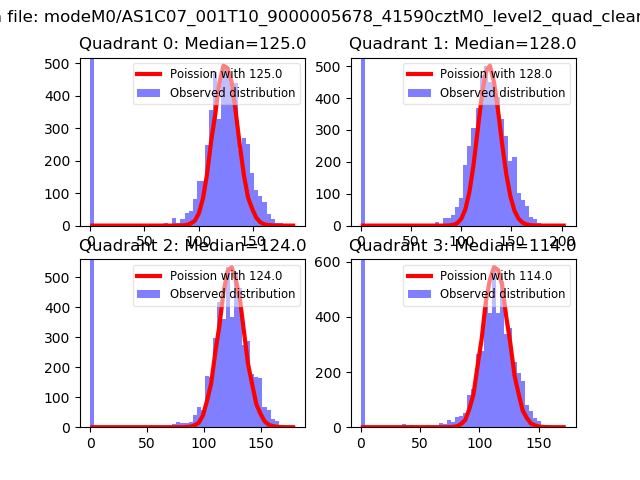
| Comparison with Poisson distribution Blue bars denote a histogram of data divided into 1 sec bins. Red curve is a Poisson curve with rate = median count rate of data. |
 |
 |
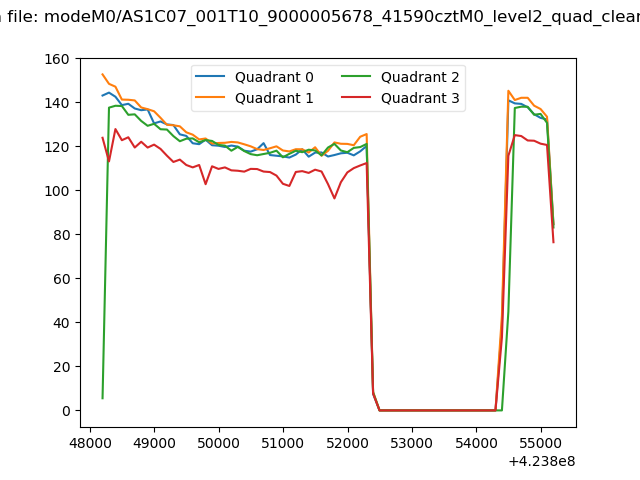
| Quadrant-wise count rates Data is divided into 100 sec bins |
 |
|
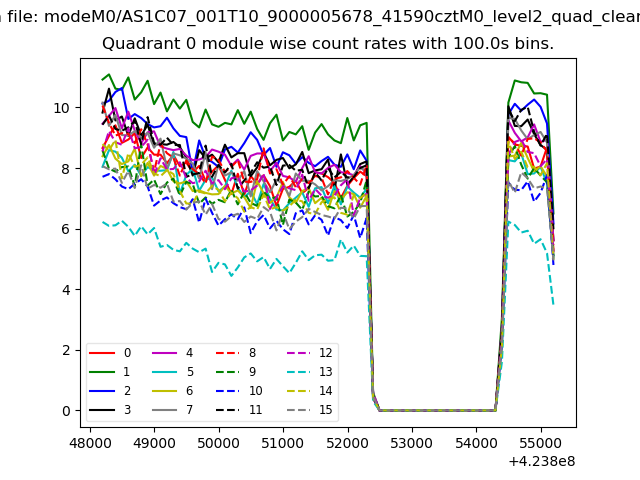
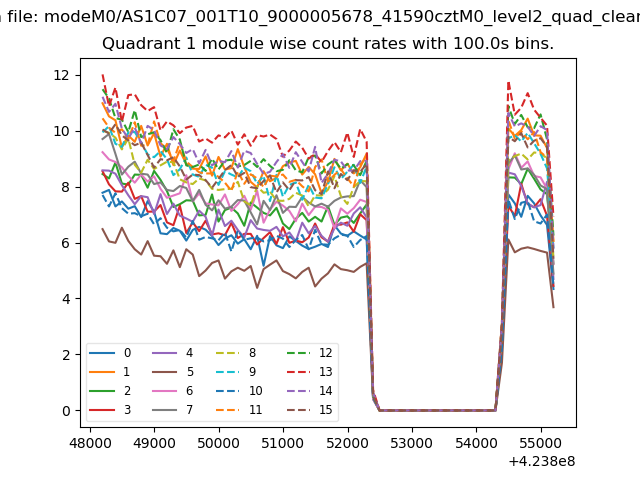
| Module-wise count rates for Quadrant A Data is divided into 100 sec bins |
 |
 |
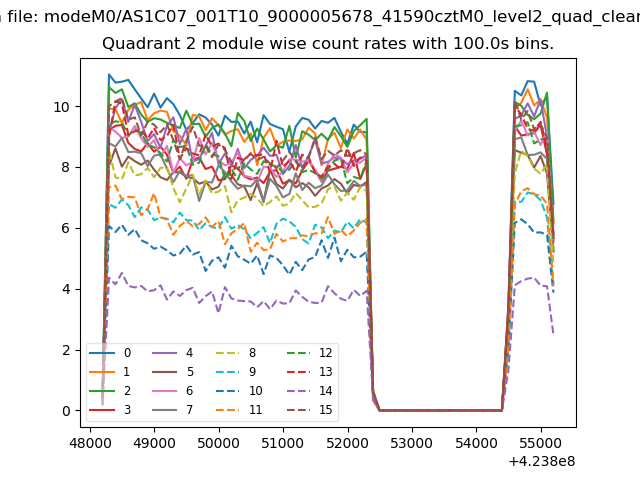
| Module-wise count rates for Quadrant B Data is divided into 100 sec bins |
 |
 |
| Module-wise count rates for Quadrant C Data is divided into 100 sec bins |
 |
 |
| Module-wise count rates for Quadrant D Data is divided into 100 sec bins |
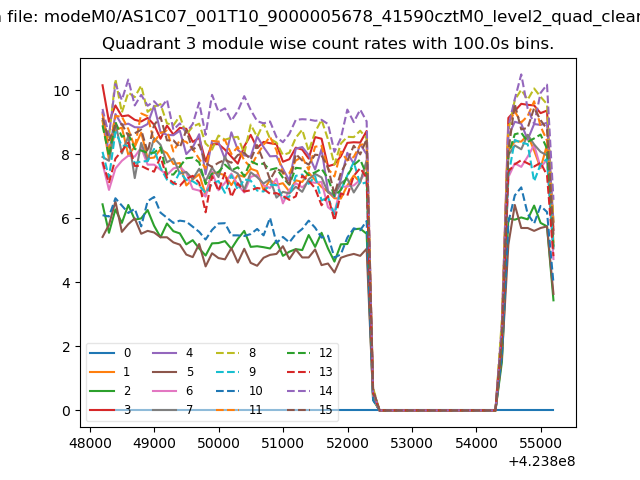 |
 |
| Parameter | Plot |
|---|---|
| CZT HV Monitor | 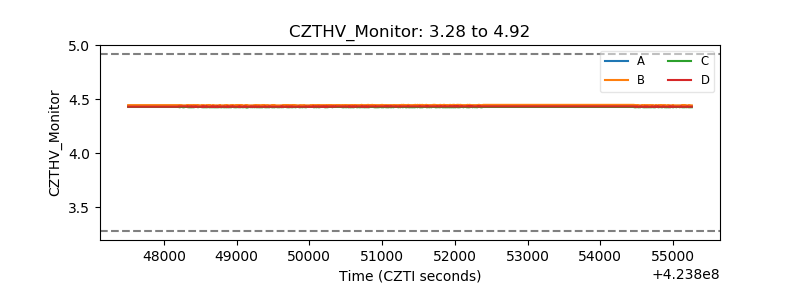 |
| D_VDD | 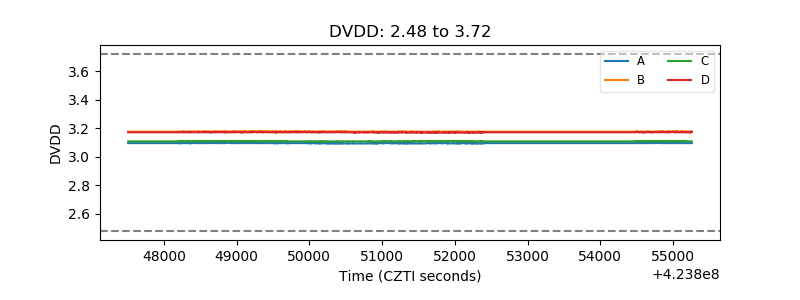 |
| Temperature 1 | 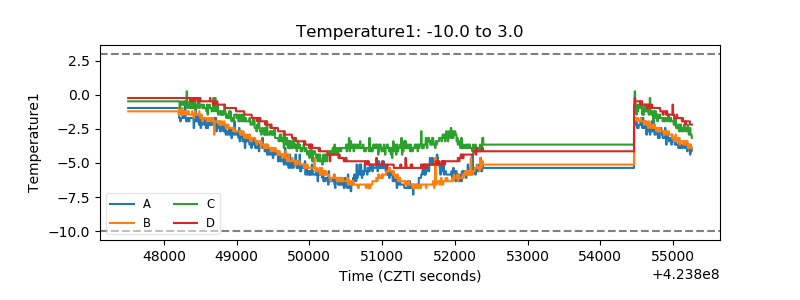 |
| Veto HV Monitor |  |
| Veto LLD | 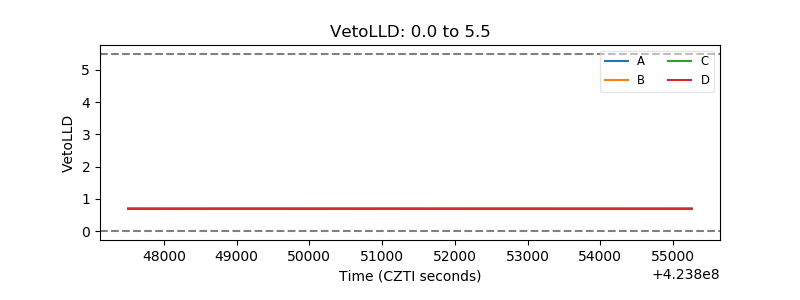 |
| Alpha Counter | 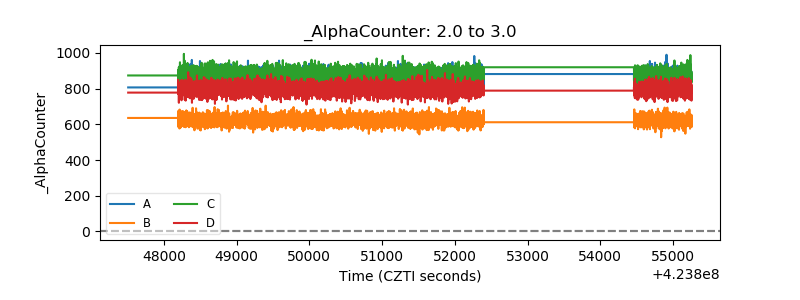 |
| _CPM_Rate | 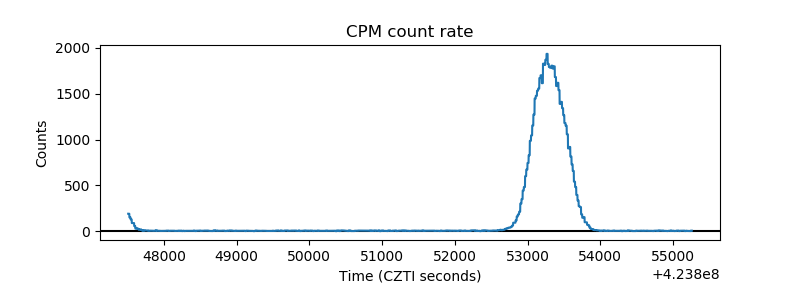 |
| CZT Counter | 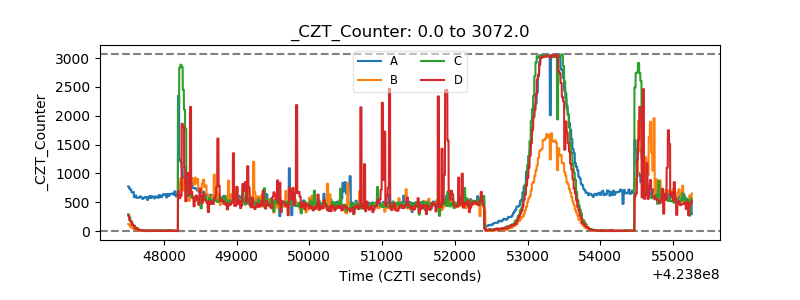 |
| +2.5 Volts monitor | 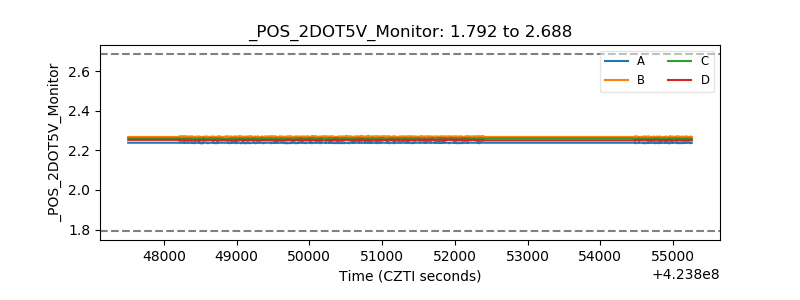 |
| +5 Volts monitor | 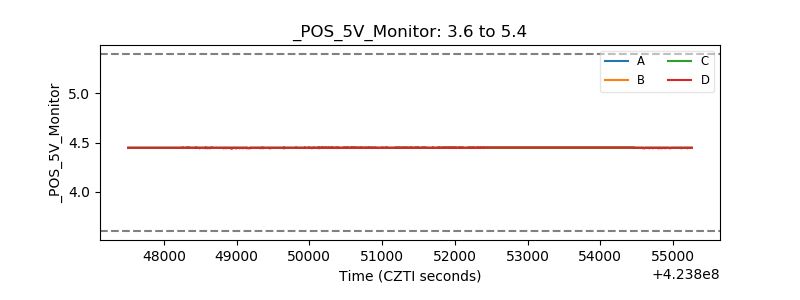 |
| _ROLL_ROT | 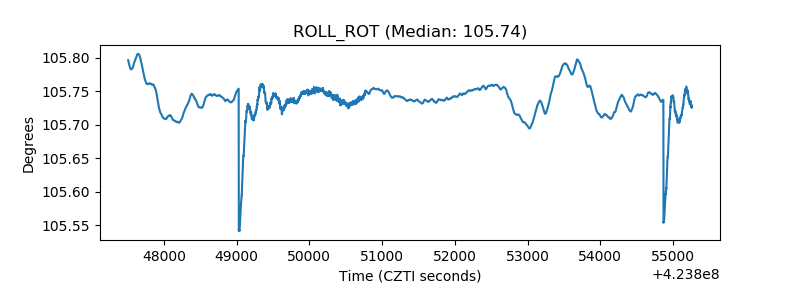 |
| _Roll_DEC | 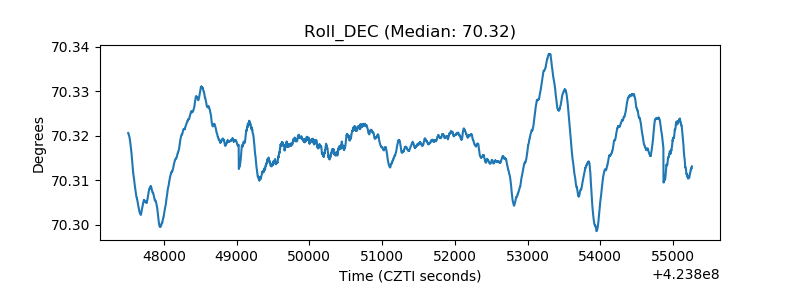 |
| _Roll_RA | 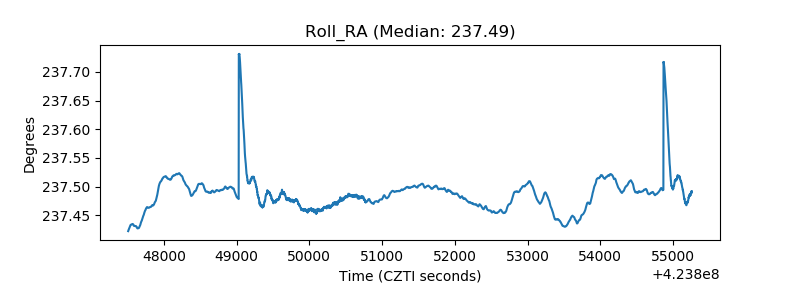 |
| Veto Counter | 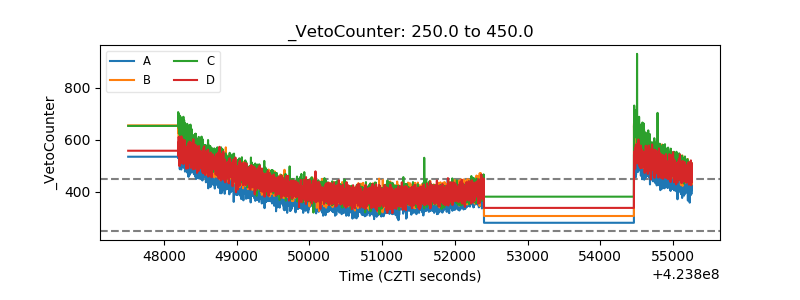 |