| Param | Original file | Final file |
|---|---|---|
| Filename | modeM0/AS1C07_001T10_9000005678_41591cztM0_level2.fits | modeM0/AS1C07_001T10_9000005678_41591cztM0_level2_quad_clean.evt |
| Size (bytes) | 316,935,360 | 86,371,200 |
| Size | 302.3 MB | 82.4 MB |
| Events in quadrant A | 2,614,572 | 585,187 |
| Events in quadrant B | 2,730,367 | 601,607 |
| Events in quadrant C | 2,792,658 | 565,304 |
| Events in quadrant D | 3,220,714 | 527,375 |
| Mode SS | |||
|---|---|---|---|
| Quadrant | BADHDUFLAG | Total packets | Discarded packets |
| A | 0 | 96 | 0 |
| B | 0 | 96 | 0 |
| C | 0 | 96 | 0 |
| D | 0 | 96 | 0 |
| Mode M0 | |||
|---|---|---|---|
| Quadrant | BADHDUFLAG | Total packets | Discarded packets |
| A | 0 | 10758 | 2 |
| B | 0 | 11238 | 2 |
| C | 0 | 11229 | 2 |
| D | 0 | 12996 | 2 |
| Mode M9 | |||
|---|---|---|---|
| Quadrant | BADHDUFLAG | Total packets | Discarded packets |
| A | 0 | 25 | 0 |
| B | 0 | 25 | 0 |
| C | 0 | 26 | 0 |
| D | 0 | 26 | 0 |
| Quadrant | Total seconds | Saturated seconds | Saturation percentage |
|---|---|---|---|
| A | 4791 | 14 | 0.292215% |
| B | 4791 | 32 | 0.667919% |
| C | 4791 | 205 | 4.278856% |
| D | 4791 | 186 | 3.882279% |
Noise dominated data is calculated using 1-second bins in cleaned event files. If a bin has >2000 counts, and if more than 50% of those come from <1% of pixels, then it is considered to be noise-dominated and hence unusable.
| Quadrant | # 1 sec bins | Bins with >0 counts | Bins with >2000 counts | High rate bins dominated by noise | Noise dominated (total time) | Noise dominated (detector-on time) | Marked lightcurve |
|---|---|---|---|---|---|---|---|
| A | 6942 | 4792 | 6 | 6 | 0.09% | 0.13% | 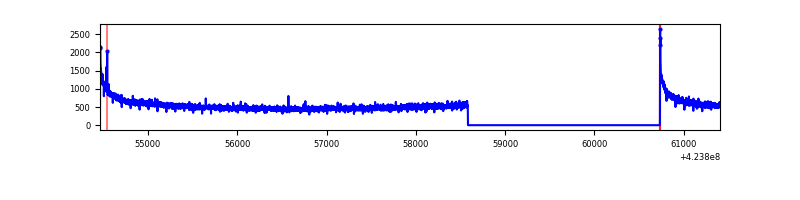 |
| B | 6942 | 4792 | 6 | 6 | 0.09% | 0.13% | 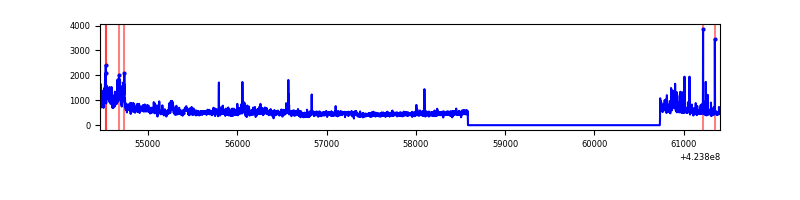 |
| C | 6942 | 4792 | 192 | 192 | 2.77% | 4.01% | 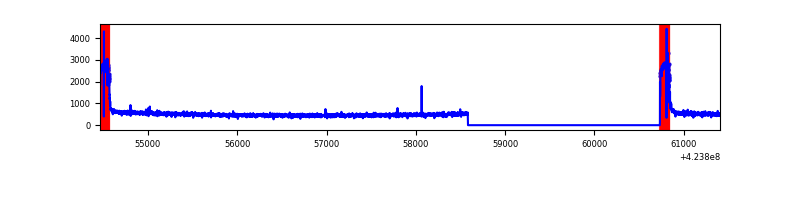 |
| D | 6941 | 4791 | 152 | 152 | 2.19% | 3.17% | 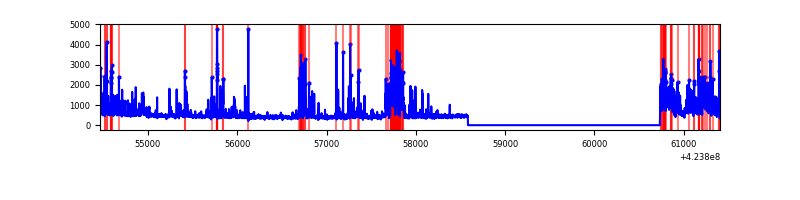 |
Top three noisy pixels from each quadrant. If the there are fewer than three noisy pixels in the level2.evt file, extra rows are filled as -1
| Pixel properties | Quadrant properties | ||||||
|---|---|---|---|---|---|---|---|
| Quadrant | DetID | PixID | Counts | Sigma | Mean | Median | Sigma |
| A | 10 | 83 | 523715 | 4819.64 | 535 | 525 | 108.6 |
| A | 13 | 254 | 8741 | 75.69 | 535 | 525 | 108.6 |
| A | 2 | 79 | 6423 | 54.33 | 535 | 525 | 108.6 |
| B | 0 | 186 | 294973 | 2890.07 | 539 | 525 | 101.9 |
| B | 7 | 202 | 160936 | 1574.47 | 539 | 525 | 101.9 |
| B | 5 | 255 | 44773 | 434.3 | 539 | 525 | 101.9 |
| C | 0 | 10 | 544608 | 4571.78 | 521 | 525 | 119.0 |
| C | 15 | 214 | 204163 | 1711.11 | 521 | 525 | 119.0 |
| C | 0 | 239 | 4967 | 37.32 | 521 | 525 | 119.0 |
| D | 13 | 249 | 543171 | 4257.19 | 527 | 514 | 127.5 |
| D | 2 | 120 | 187491 | 1466.85 | 527 | 514 | 127.5 |
| D | 12 | 218 | 101509 | 792.31 | 527 | 514 | 127.5 |
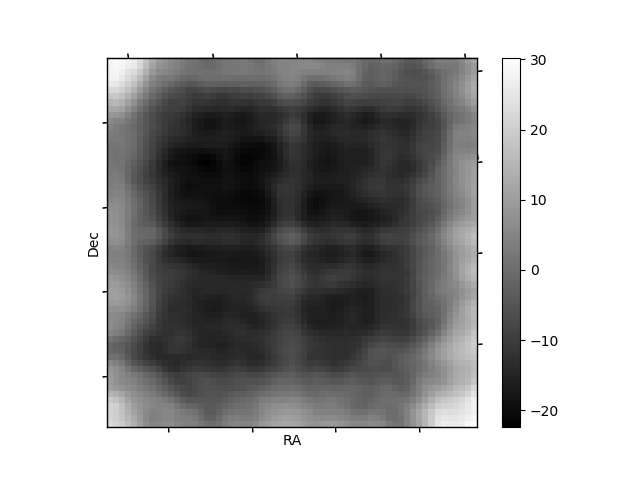
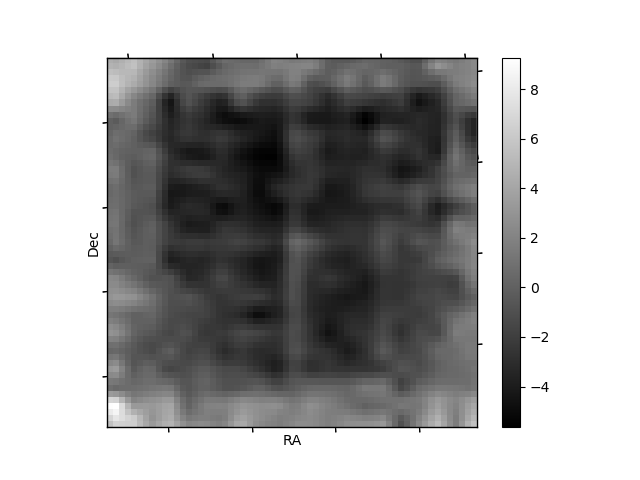
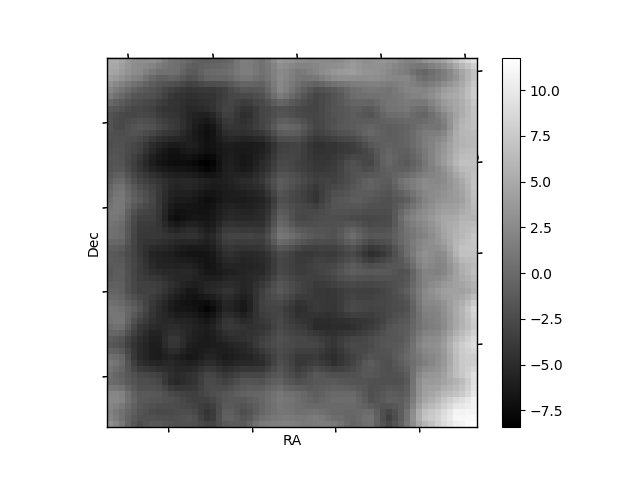
Histogram calculated using DETX and DETY for each event in the final _common_clean file
| Quadrant A | 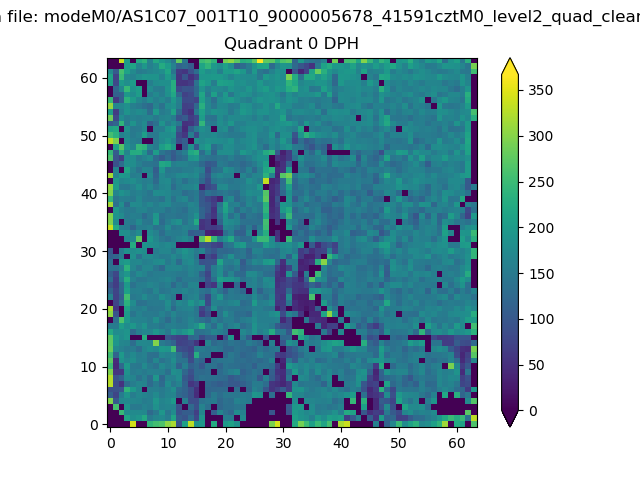 |
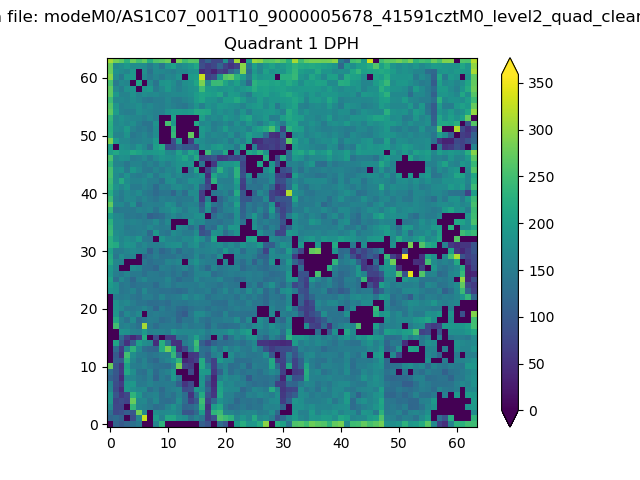 |
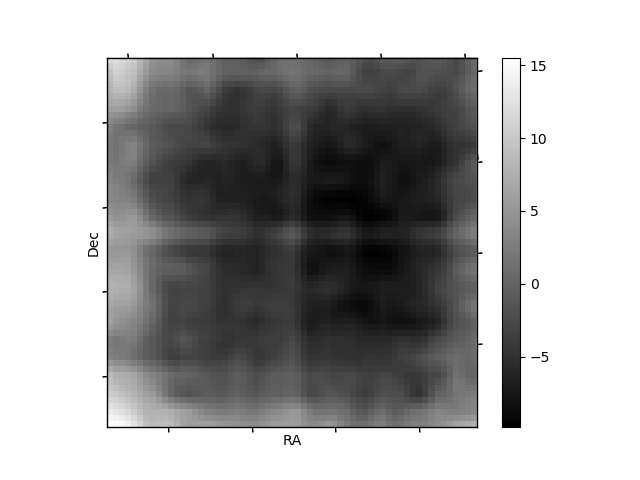
Quadrant B |
|---|---|---|---|
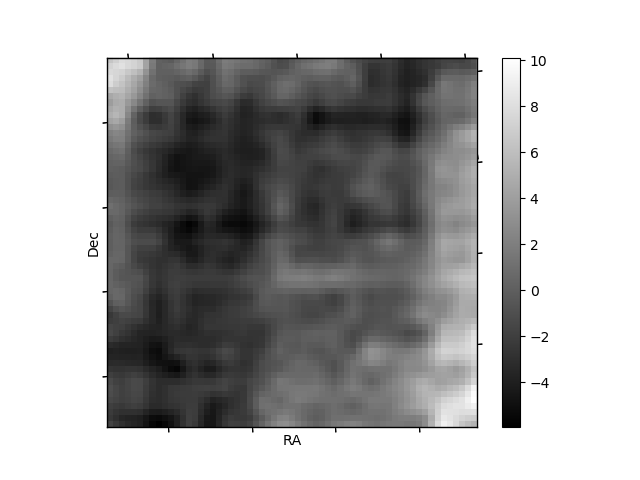
| Quadrant D | 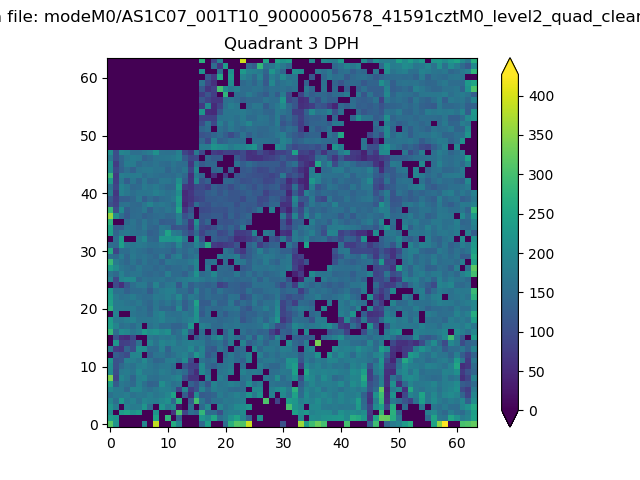 |
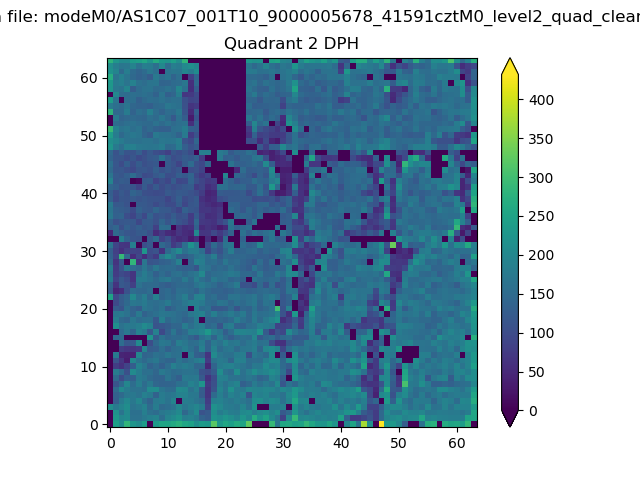 |
Quadrant C |
| Plot type | Count rate plots | Images |
|---|---|---|
| Comparison with Poisson distribution Blue bars denote a histogram of data divided into 1 sec bins. Red curve is a Poisson curve with rate = median count rate of data. |
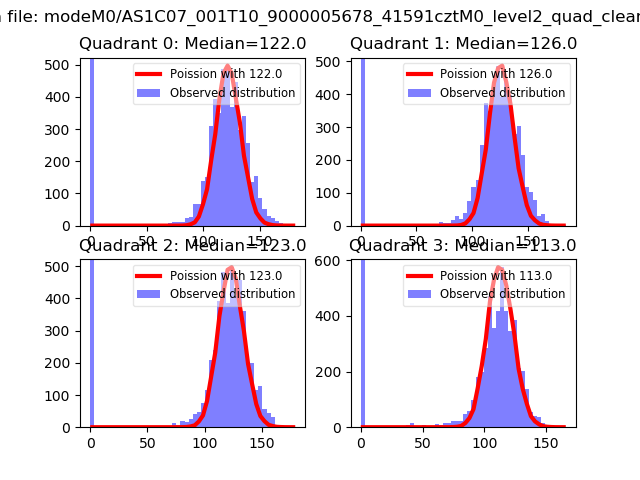 |
 |
| Quadrant-wise count rates Data is divided into 100 sec bins |
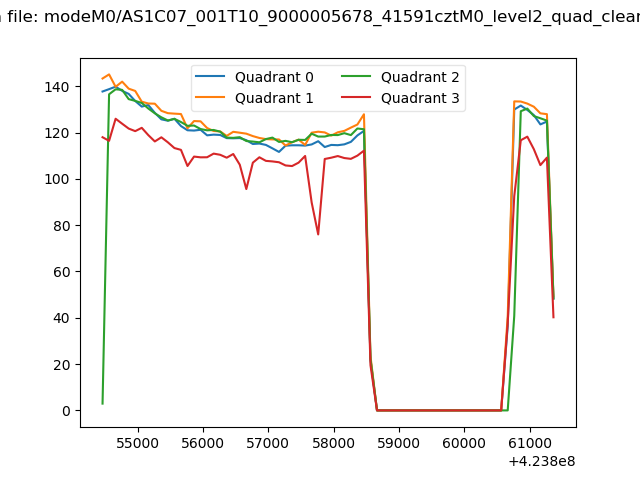 |
|
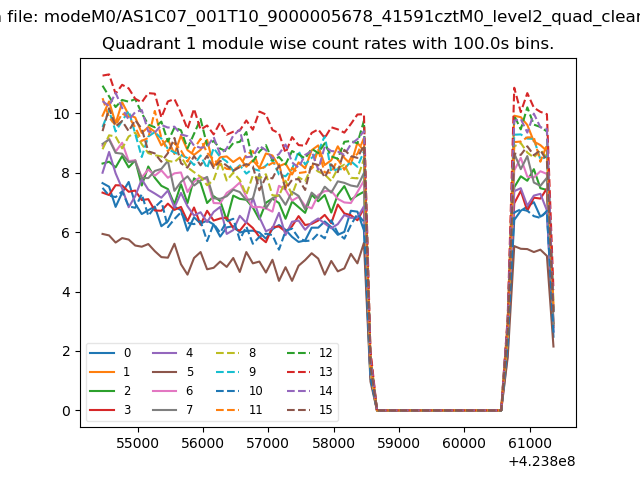
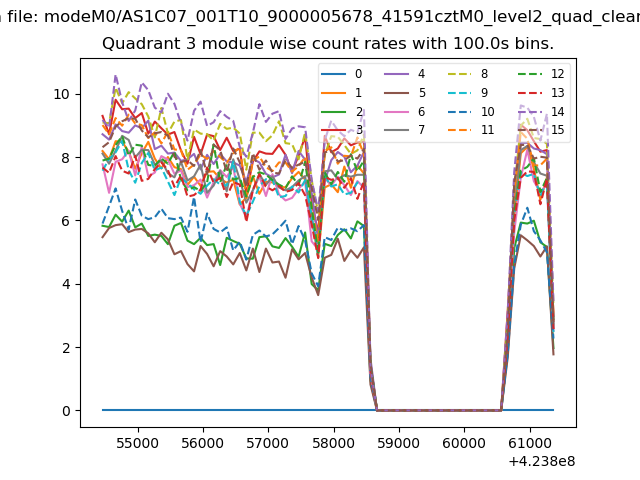
| Module-wise count rates for Quadrant A Data is divided into 100 sec bins |
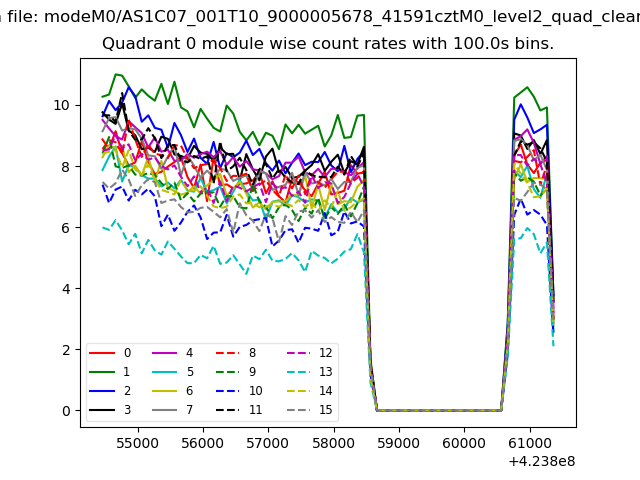 |
 |
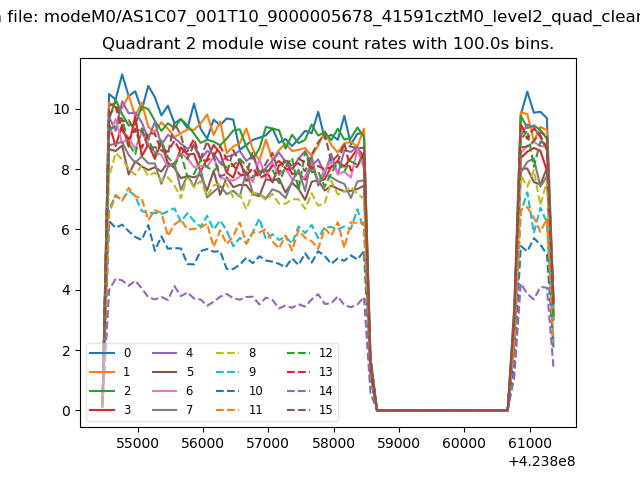
| Module-wise count rates for Quadrant B Data is divided into 100 sec bins |
 |
 |
| Module-wise count rates for Quadrant C Data is divided into 100 sec bins |
 |
 |
| Module-wise count rates for Quadrant D Data is divided into 100 sec bins |
 |
 |
| Parameter | Plot |
|---|---|
| CZT HV Monitor |  |
| D_VDD | 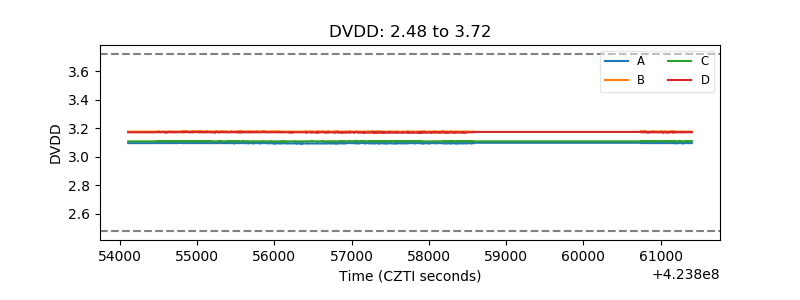 |
| Temperature 1 | 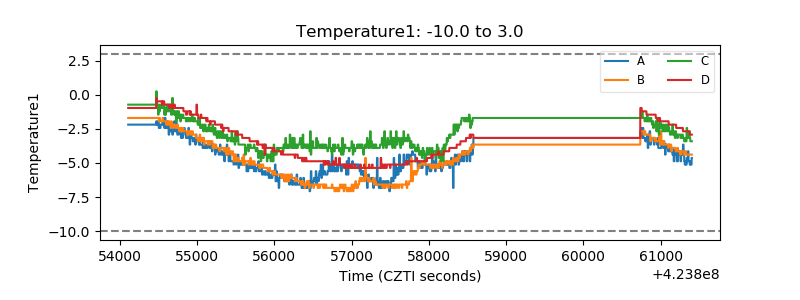 |
| Veto HV Monitor | 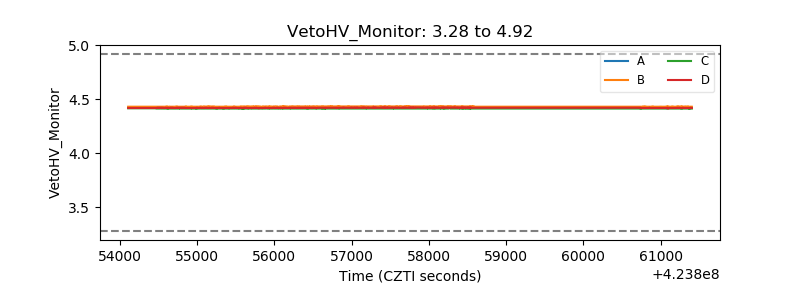 |
| Veto LLD | 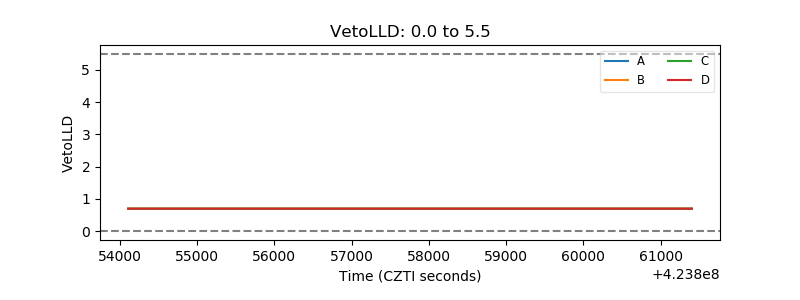 |
| Alpha Counter | 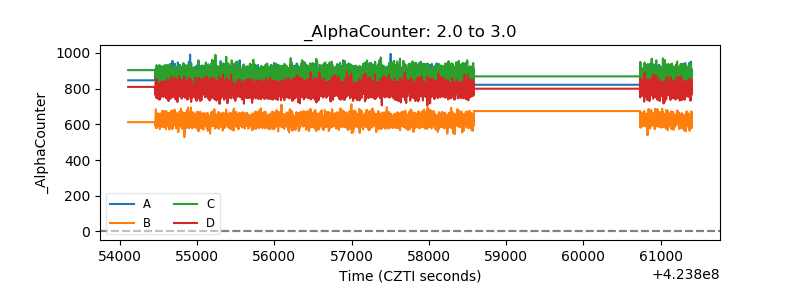 |
| _CPM_Rate | 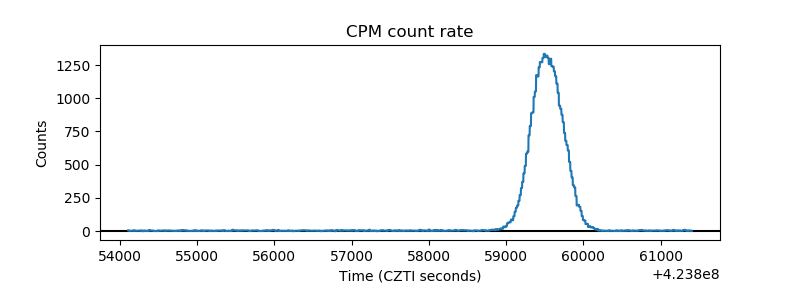 |
| CZT Counter | 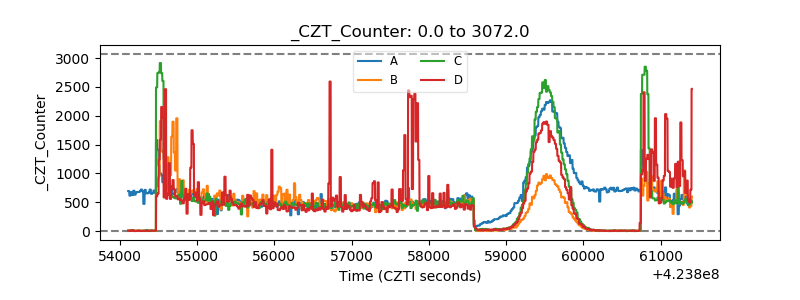 |
| +2.5 Volts monitor | 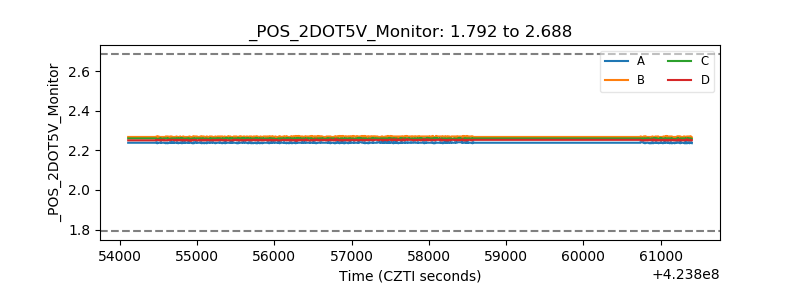 |
| +5 Volts monitor | 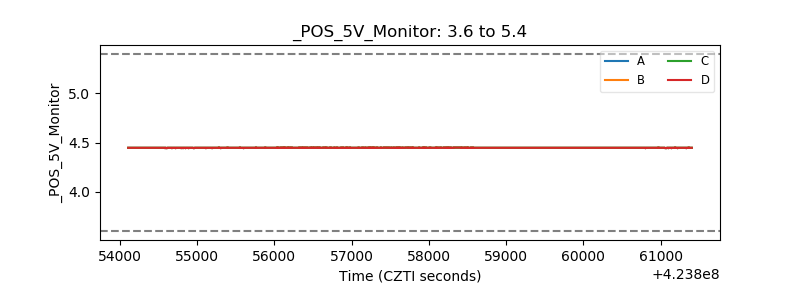 |
| _ROLL_ROT | 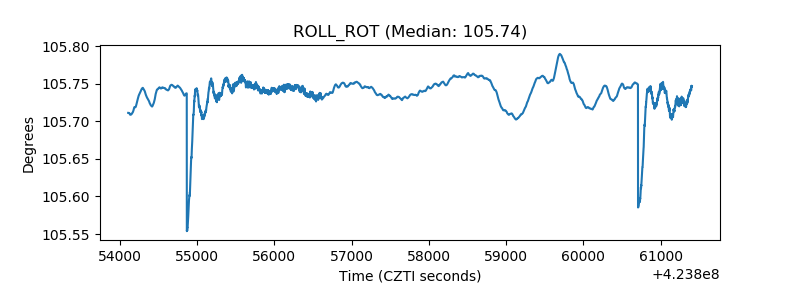 |
| _Roll_DEC | 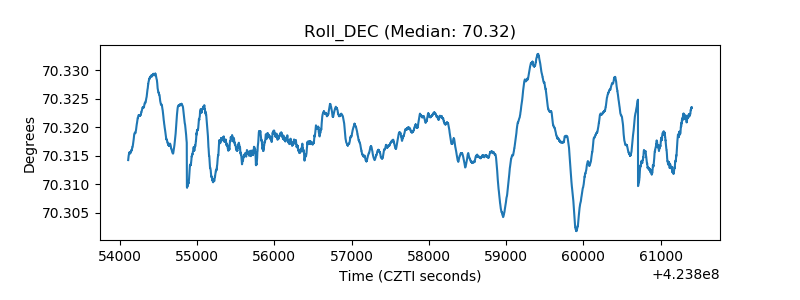 |
| _Roll_RA | 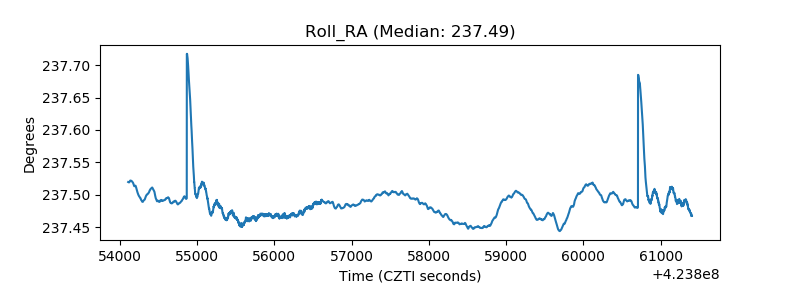 |
| Veto Counter | 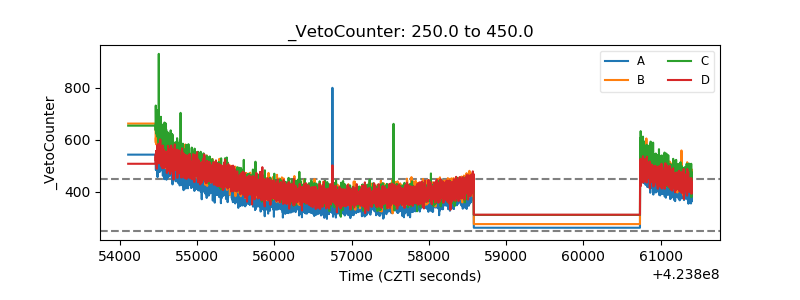 |