| Param | Original file | Final file |
|---|---|---|
| Filename | modeM0/AS1C07_001T10_9000005678_41592cztM0_level2.fits | modeM0/AS1C07_001T10_9000005678_41592cztM0_level2_quad_clean.evt |
| Size (bytes) | 307,071,360 | 84,637,440 |
| Size | 292.8 MB | 80.7 MB |
| Events in quadrant A | 2,573,104 | 568,761 |
| Events in quadrant B | 2,377,217 | 587,216 |
| Events in quadrant C | 2,758,361 | 551,407 |
| Events in quadrant D | 3,276,185 | 511,954 |
| Mode SS | |||
|---|---|---|---|
| Quadrant | BADHDUFLAG | Total packets | Discarded packets |
| A | 0 | 100 | 0 |
| B | 0 | 100 | 0 |
| C | 0 | 100 | 0 |
| D | 0 | 100 | 0 |
| Mode M0 | |||
|---|---|---|---|
| Quadrant | BADHDUFLAG | Total packets | Discarded packets |
| A | 0 | 10717 | 2 |
| B | 0 | 10481 | 2 |
| C | 0 | 11307 | 2 |
| D | 0 | 13424 | 2 |
| Mode M9 | |||
|---|---|---|---|
| Quadrant | BADHDUFLAG | Total packets | Discarded packets |
| A | 0 | 30 | 0 |
| B | 0 | 30 | 0 |
| C | 0 | 31 | 0 |
| D | 0 | 31 | 0 |
| Quadrant | Total seconds | Saturated seconds | Saturation percentage |
|---|---|---|---|
| A | 4896 | 12 | 0.245098% |
| B | 4896 | 16 | 0.326797% |
| C | 4896 | 210 | 4.289216% |
| D | 4896 | 202 | 4.125817% |
Noise dominated data is calculated using 1-second bins in cleaned event files. If a bin has >2000 counts, and if more than 50% of those come from <1% of pixels, then it is considered to be noise-dominated and hence unusable.
| Quadrant | # 1 sec bins | Bins with >0 counts | Bins with >2000 counts | High rate bins dominated by noise | Noise dominated (total time) | Noise dominated (detector-on time) | Marked lightcurve |
|---|---|---|---|---|---|---|---|
| A | 7018 | 4897 | 4 | 4 | 0.06% | 0.08% | 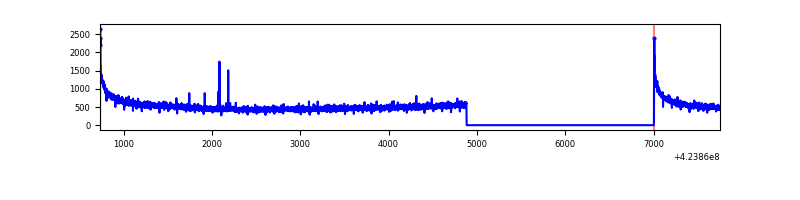 |
| B | 7018 | 4897 | 7 | 7 | 0.10% | 0.14% | 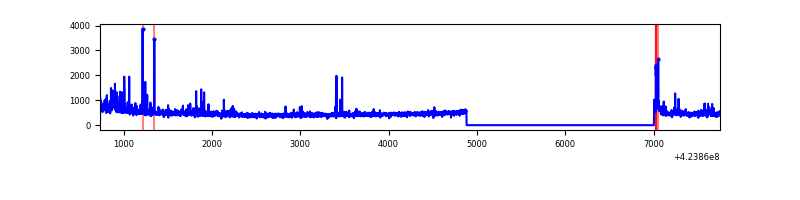 |
| C | 7018 | 4897 | 197 | 197 | 2.81% | 4.02% | 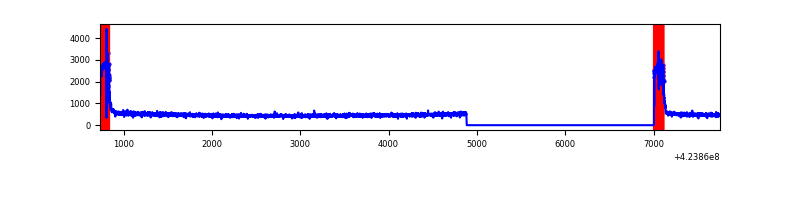 |
| D | 7018 | 4897 | 170 | 170 | 2.42% | 3.47% | 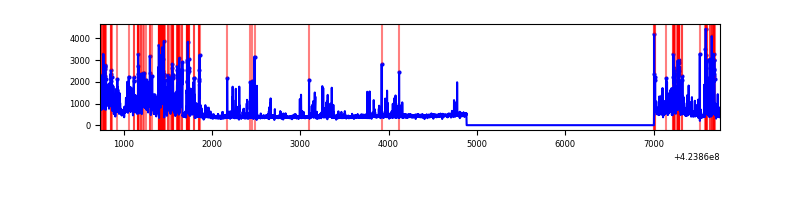 |
Top three noisy pixels from each quadrant. If the there are fewer than three noisy pixels in the level2.evt file, extra rows are filled as -1
| Pixel properties | Quadrant properties | ||||||
|---|---|---|---|---|---|---|---|
| Quadrant | DetID | PixID | Counts | Sigma | Mean | Median | Sigma |
| A | 10 | 83 | 513264 | 4752.27 | 528 | 518 | 107.9 |
| A | 13 | 254 | 8568 | 74.61 | 528 | 518 | 107.9 |
| A | 3 | 137 | 5725 | 48.26 | 528 | 518 | 107.9 |
| B | 0 | 186 | 64284 | 633.06 | 533 | 520 | 100.7 |
| B | 5 | 255 | 62971 | 620.02 | 533 | 520 | 100.7 |
| B | 0 | 245 | 44246 | 434.12 | 533 | 520 | 100.7 |
| C | 0 | 10 | 554240 | 4701.75 | 512 | 515 | 117.8 |
| C | 15 | 214 | 208084 | 1762.49 | 512 | 515 | 117.8 |
| C | 13 | 61 | 3414 | 24.61 | 512 | 515 | 117.8 |
| D | 13 | 249 | 486866 | 3930.07 | 516 | 503 | 123.8 |
| D | 2 | 120 | 241430 | 1946.82 | 516 | 503 | 123.8 |
| D | 2 | 249 | 122890 | 988.95 | 516 | 503 | 123.8 |
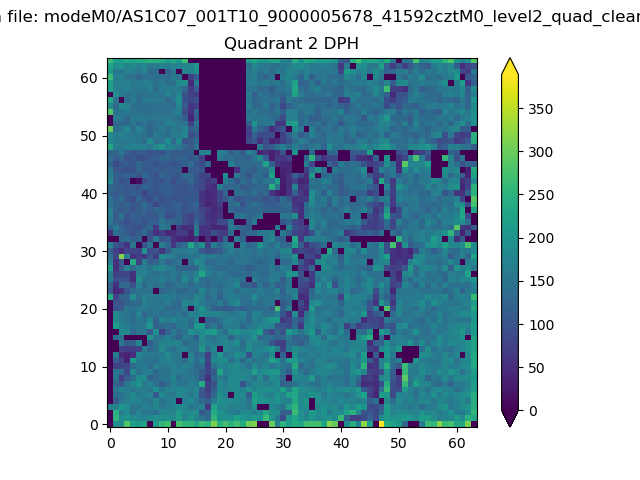
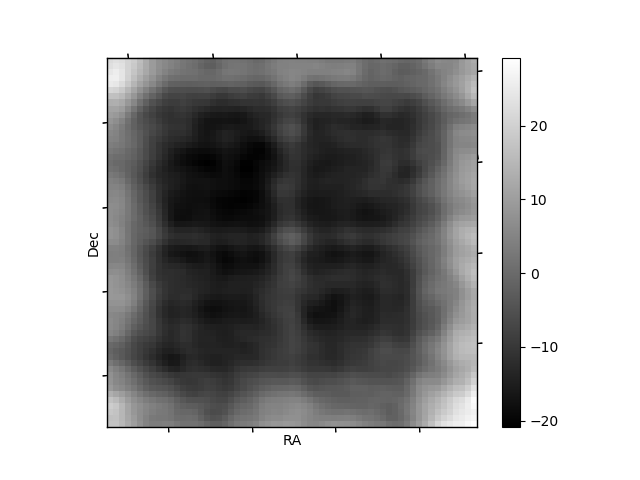
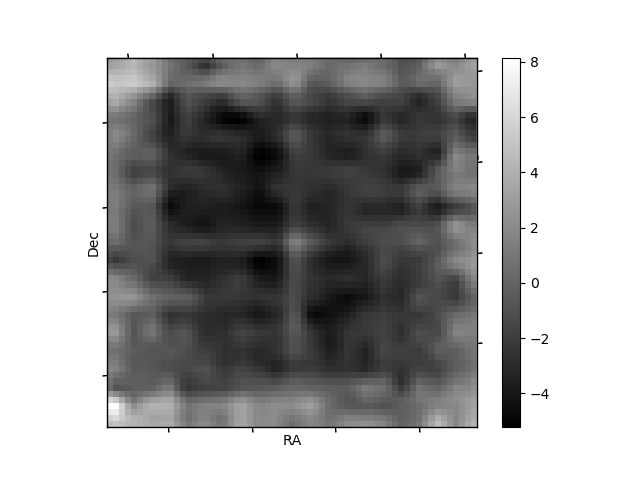
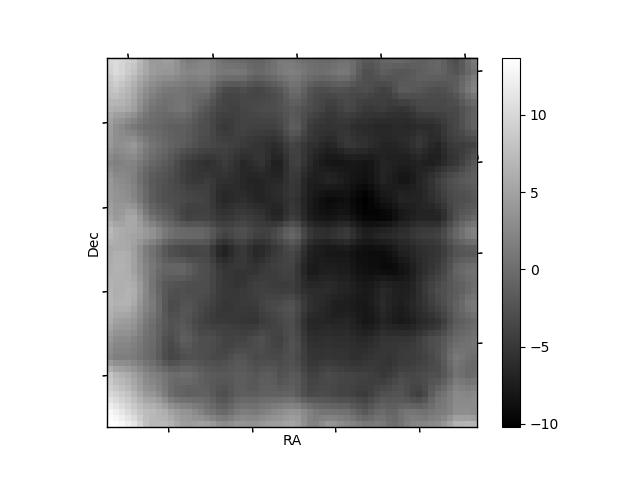
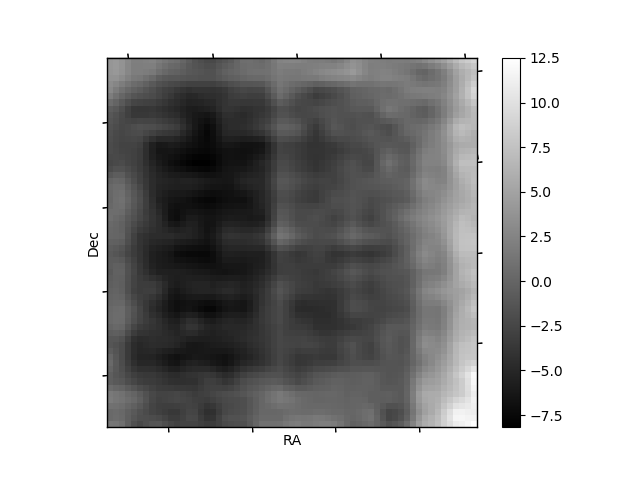
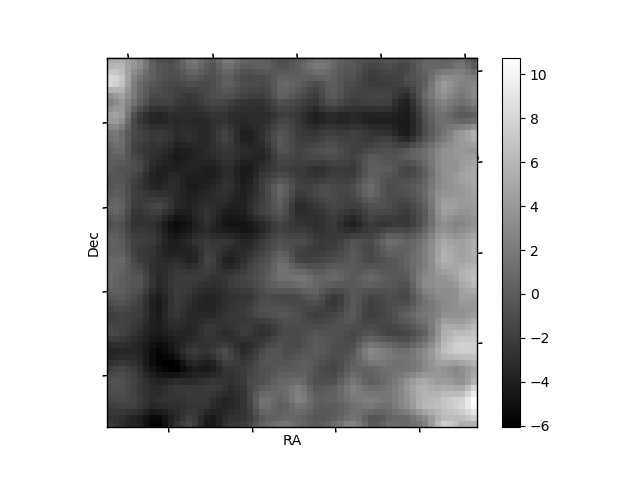
Histogram calculated using DETX and DETY for each event in the final _common_clean file
| Quadrant A | 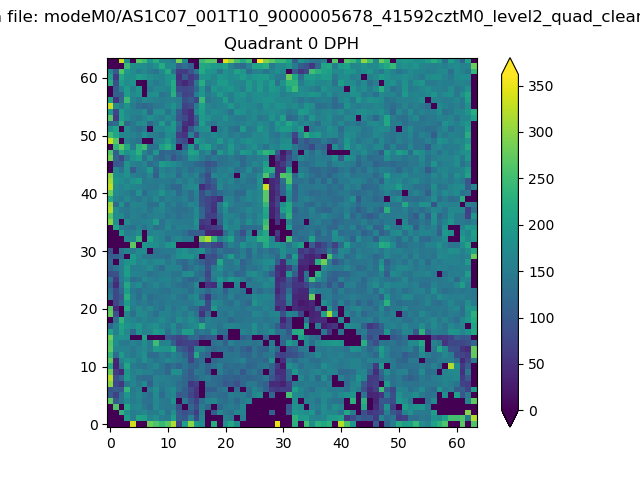 |
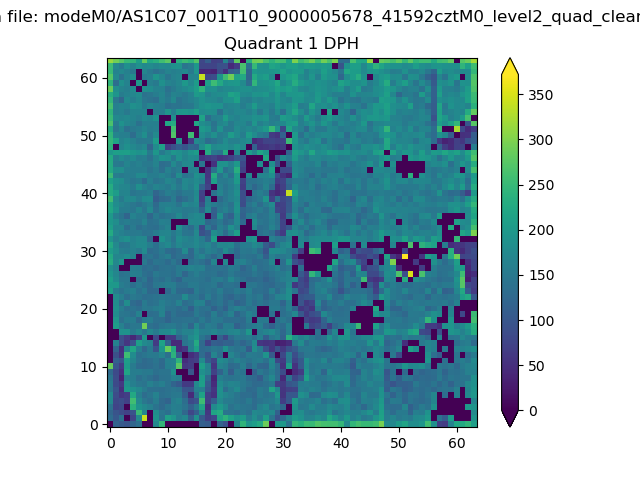 |
Quadrant B |
|---|---|---|---|
| Quadrant D | 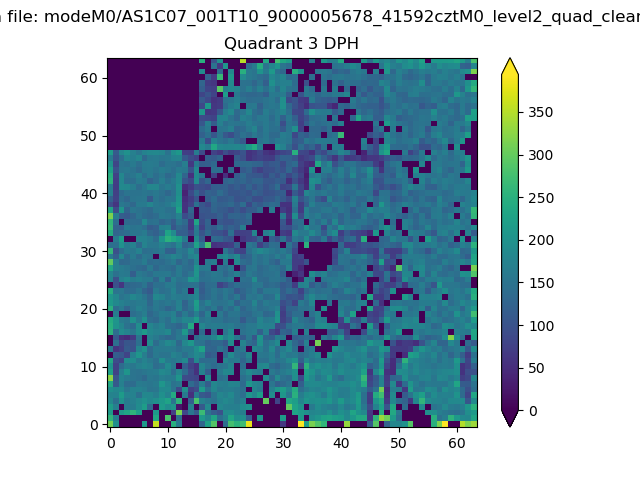 |
 |
Quadrant C |
| Plot type | Count rate plots | Images |
|---|---|---|
| Comparison with Poisson distribution Blue bars denote a histogram of data divided into 1 sec bins. Red curve is a Poisson curve with rate = median count rate of data. |
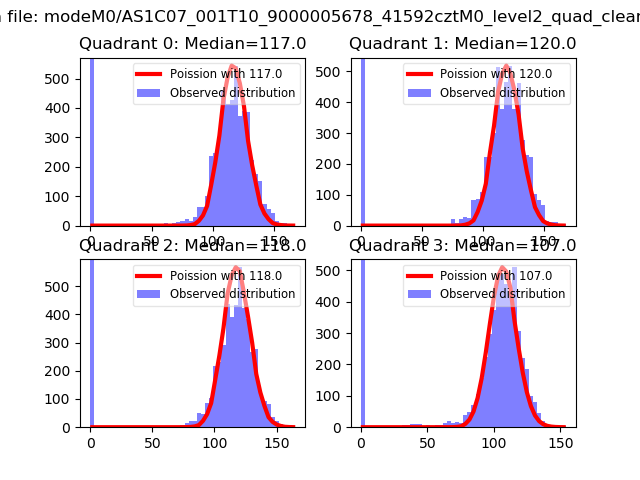 |
 |
| Quadrant-wise count rates Data is divided into 100 sec bins |
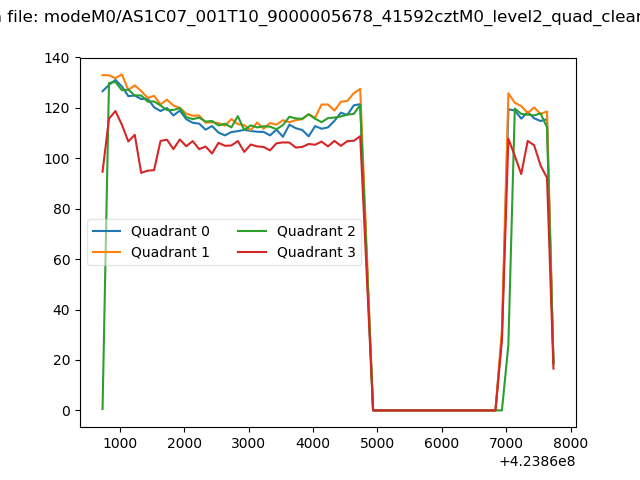 |
|
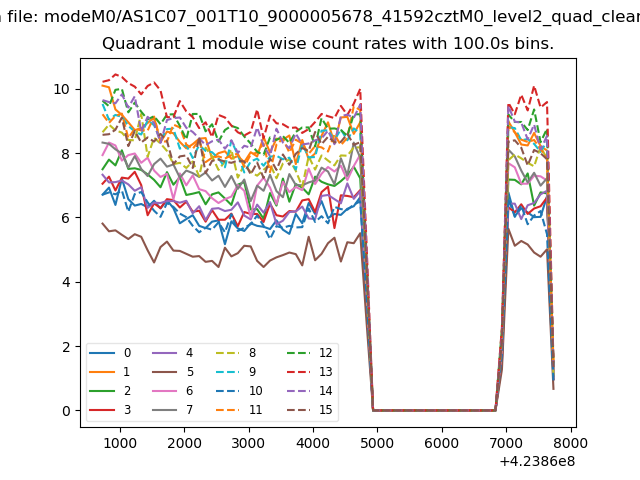
| Module-wise count rates for Quadrant A Data is divided into 100 sec bins |
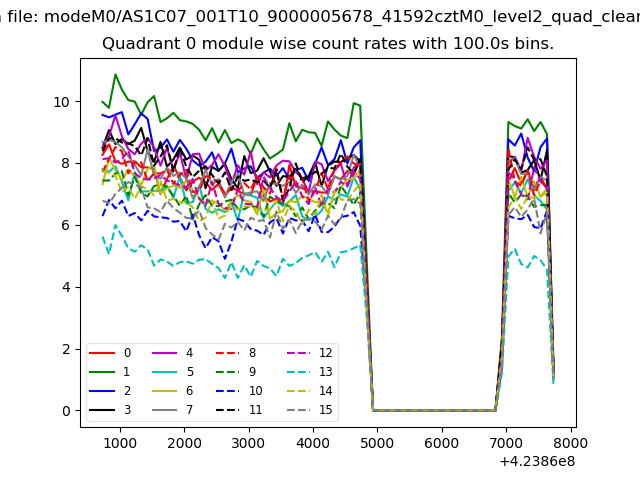 |
 |
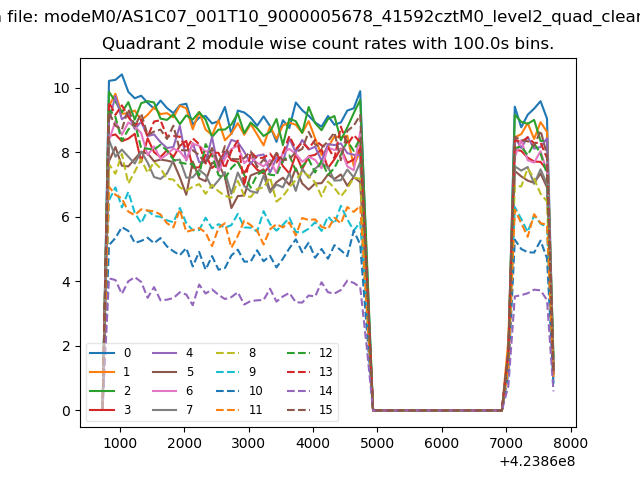
| Module-wise count rates for Quadrant B Data is divided into 100 sec bins |
 |
 |
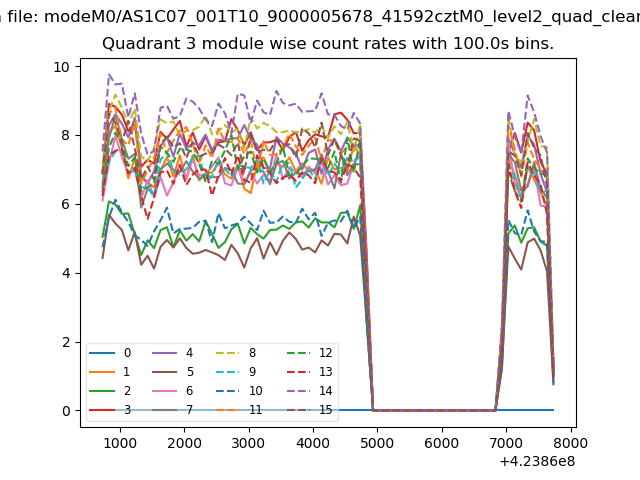
| Module-wise count rates for Quadrant C Data is divided into 100 sec bins |
 |
 |
| Module-wise count rates for Quadrant D Data is divided into 100 sec bins |
 |
 |
| Parameter | Plot |
|---|---|
| CZT HV Monitor | 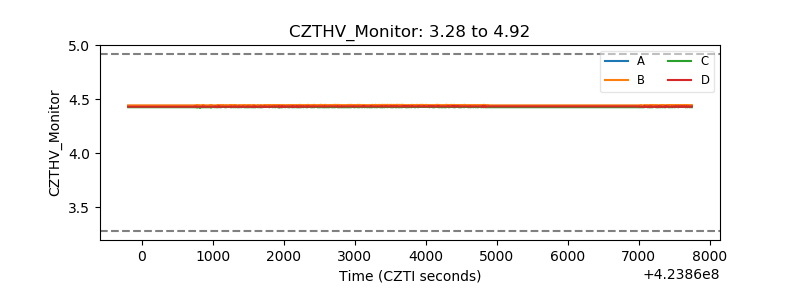 |
| D_VDD | 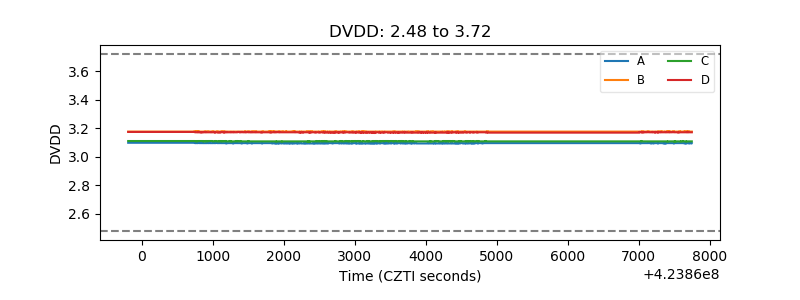 |
| Temperature 1 | 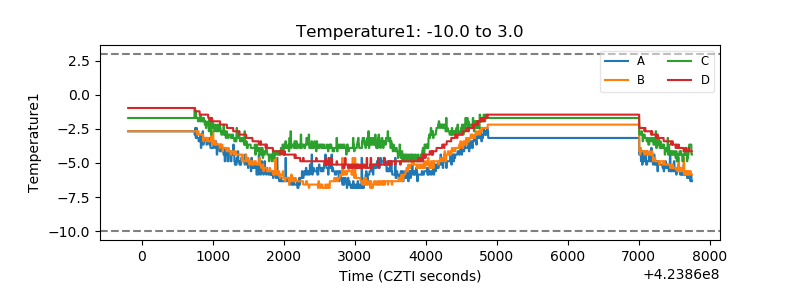 |
| Veto HV Monitor | 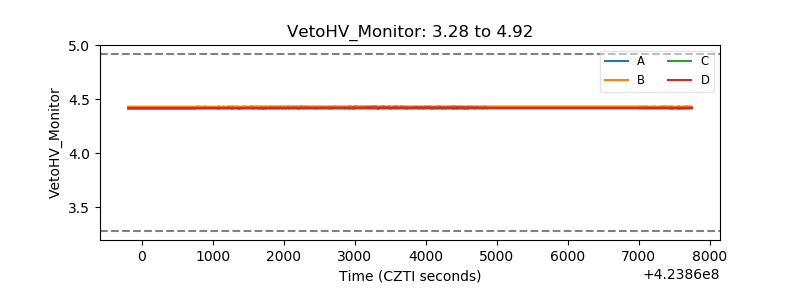 |
| Veto LLD | 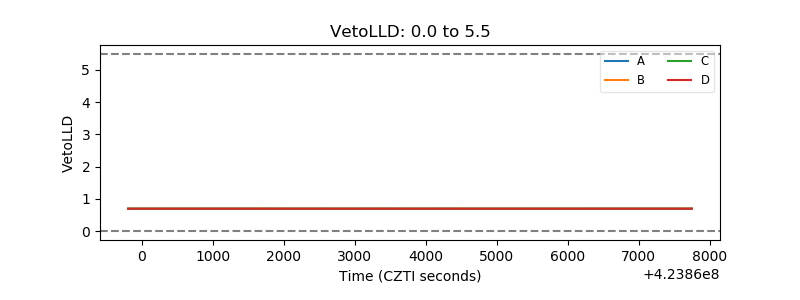 |
| Alpha Counter | 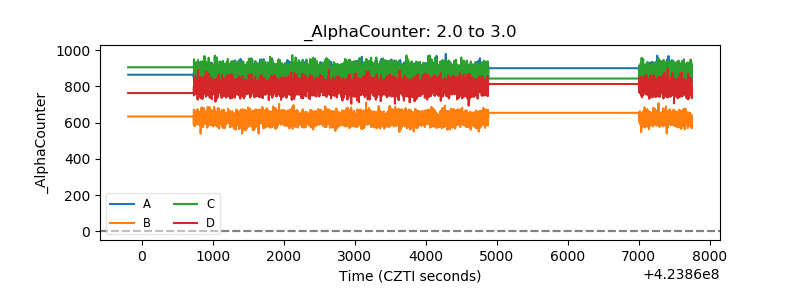 |
| _CPM_Rate | 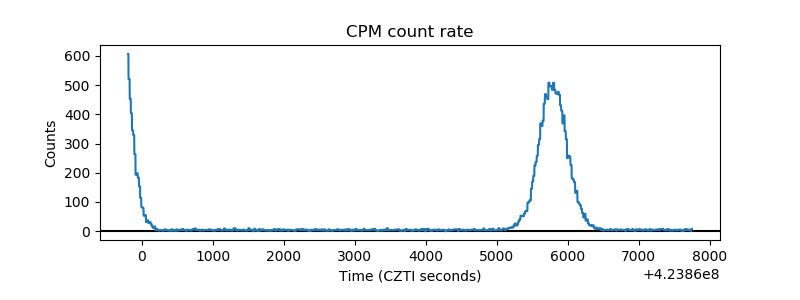 |
| CZT Counter | 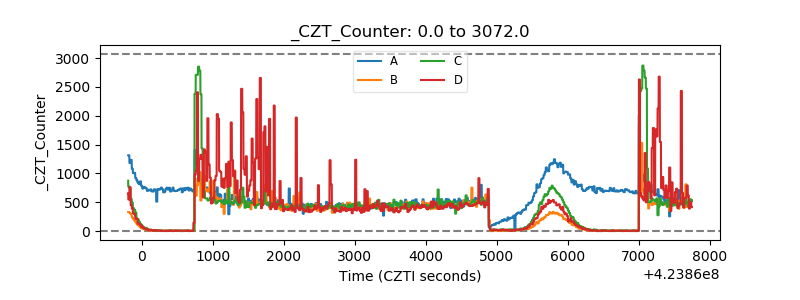 |
| +2.5 Volts monitor |  |
| +5 Volts monitor | 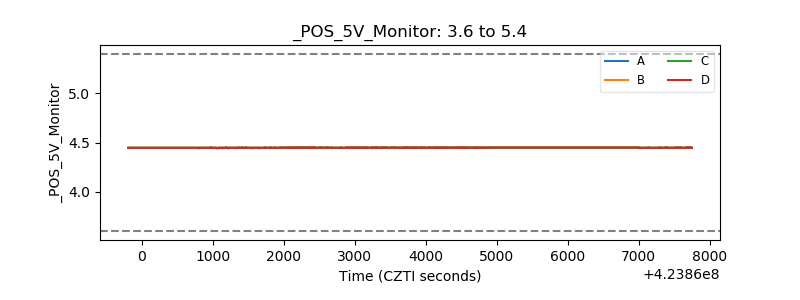 |
| _ROLL_ROT | 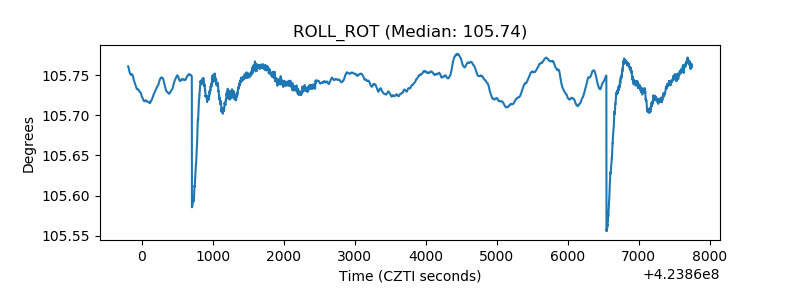 |
| _Roll_DEC | 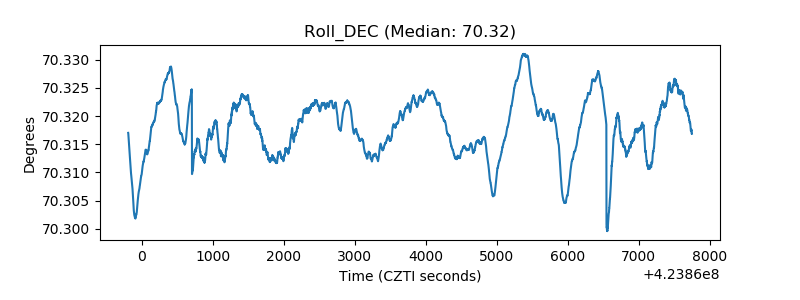 |
| _Roll_RA | 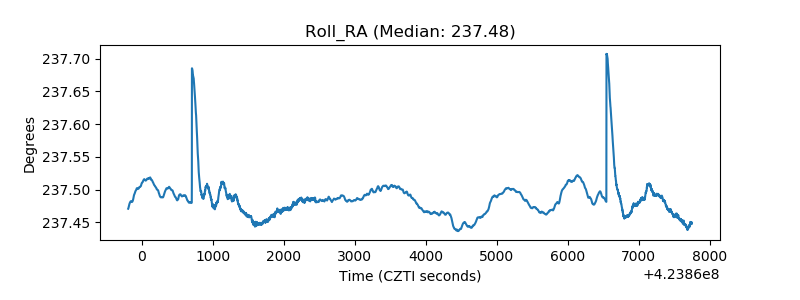 |
| Veto Counter | 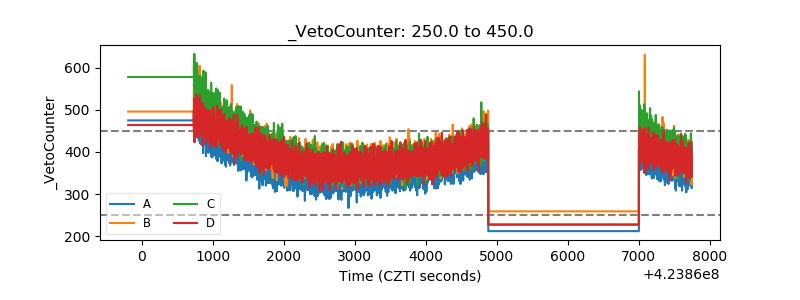 |