| Param | Original file | Final file |
|---|---|---|
| Filename | modeM0/AS1C07_001T10_9000005678_41593cztM0_level2.fits | modeM0/AS1C07_001T10_9000005678_41593cztM0_level2_quad_clean.evt |
| Size (bytes) | 305,873,280 | 83,695,680 |
| Size | 291.7 MB | 79.8 MB |
| Events in quadrant A | 2,592,627 | 562,275 |
| Events in quadrant B | 2,299,853 | 578,664 |
| Events in quadrant C | 2,790,998 | 540,634 |
| Events in quadrant D | 3,243,828 | 497,690 |
| Mode SS | |||
|---|---|---|---|
| Quadrant | BADHDUFLAG | Total packets | Discarded packets |
| A | 0 | 104 | 0 |
| B | 0 | 104 | 0 |
| C | 0 | 104 | 0 |
| D | 0 | 104 | 0 |
| Mode M0 | |||
|---|---|---|---|
| Quadrant | BADHDUFLAG | Total packets | Discarded packets |
| A | 0 | 10941 | 2 |
| B | 0 | 10503 | 2 |
| C | 0 | 11674 | 2 |
| D | 0 | 13379 | 2 |
| Mode M9 | |||
|---|---|---|---|
| Quadrant | BADHDUFLAG | Total packets | Discarded packets |
| A | 0 | 35 | 0 |
| B | 0 | 35 | 0 |
| C | 0 | 36 | 0 |
| D | 0 | 36 | 0 |
| Quadrant | Total seconds | Saturated seconds | Saturation percentage |
|---|---|---|---|
| A | 5065 | 12 | 0.236920% |
| B | 5065 | 11 | 0.217177% |
| C | 5065 | 218 | 4.304047% |
| D | 5065 | 246 | 4.856861% |
Noise dominated data is calculated using 1-second bins in cleaned event files. If a bin has >2000 counts, and if more than 50% of those come from <1% of pixels, then it is considered to be noise-dominated and hence unusable.
| Quadrant | # 1 sec bins | Bins with >0 counts | Bins with >2000 counts | High rate bins dominated by noise | Noise dominated (total time) | Noise dominated (detector-on time) | Marked lightcurve |
|---|---|---|---|---|---|---|---|
| A | 7038 | 5066 | 4 | 4 | 0.06% | 0.08% | 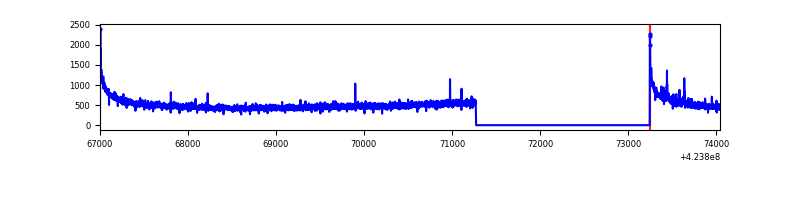 |
| B | 7038 | 5066 | 6 | 6 | 0.09% | 0.12% | 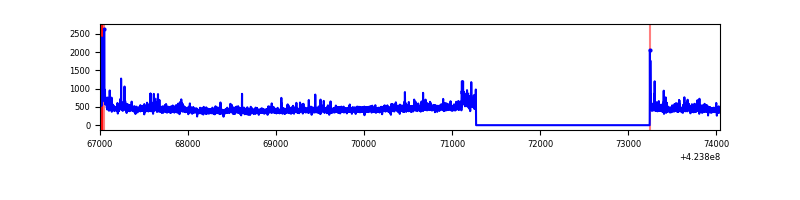 |
| C | 7038 | 5066 | 207 | 207 | 2.94% | 4.09% | 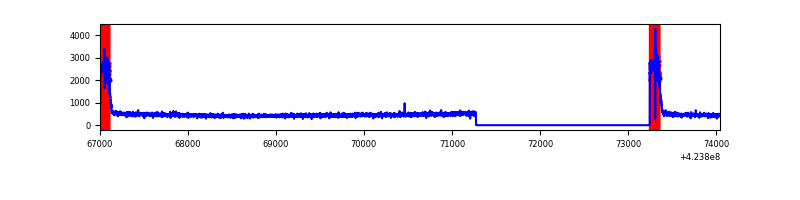 |
| D | 7038 | 5066 | 214 | 214 | 3.04% | 4.22% | 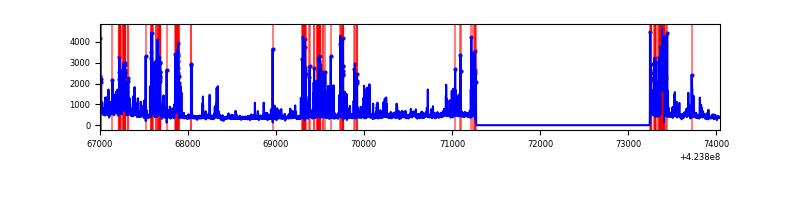 |
Top three noisy pixels from each quadrant. If the there are fewer than three noisy pixels in the level2.evt file, extra rows are filled as -1
| Pixel properties | Quadrant properties | ||||||
|---|---|---|---|---|---|---|---|
| Quadrant | DetID | PixID | Counts | Sigma | Mean | Median | Sigma |
| A | 10 | 83 | 503741 | 4613.59 | 533 | 522 | 109.1 |
| A | 7 | 3 | 15597 | 138.21 | 533 | 522 | 109.1 |
| A | 13 | 254 | 8327 | 71.56 | 533 | 522 | 109.1 |
| B | 0 | 190 | 57243 | 555.15 | 535 | 521 | 102.2 |
| B | 0 | 245 | 34518 | 332.73 | 535 | 521 | 102.2 |
| B | 5 | 255 | 33472 | 322.5 | 535 | 521 | 102.2 |
| C | 0 | 10 | 575250 | 4850.52 | 512 | 516 | 118.5 |
| C | 15 | 214 | 217387 | 1830.3 | 512 | 516 | 118.5 |
| C | 13 | 61 | 3459 | 24.84 | 512 | 516 | 118.5 |
| D | 1 | 47 | 485411 | 3816.72 | 513 | 496 | 127.1 |
| D | 2 | 249 | 321539 | 2526.9 | 513 | 496 | 127.1 |
| D | 13 | 249 | 220886 | 1734.67 | 513 | 496 | 127.1 |
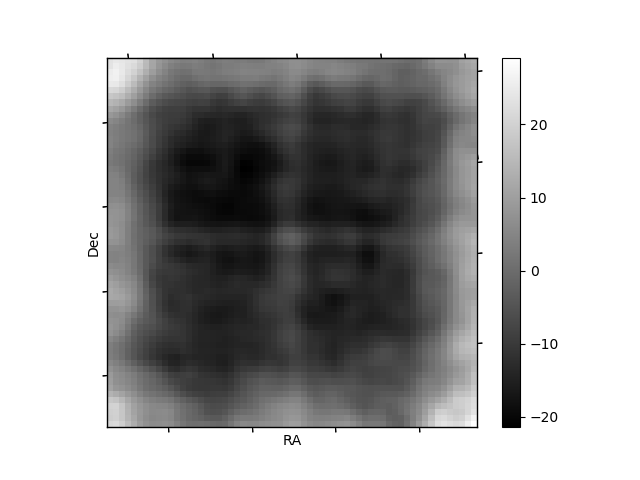
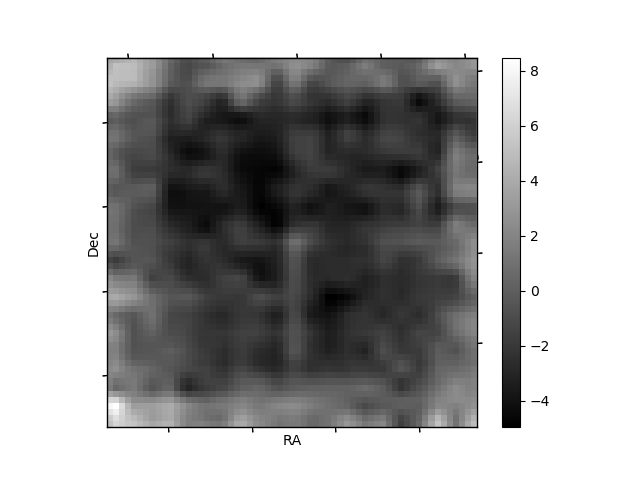
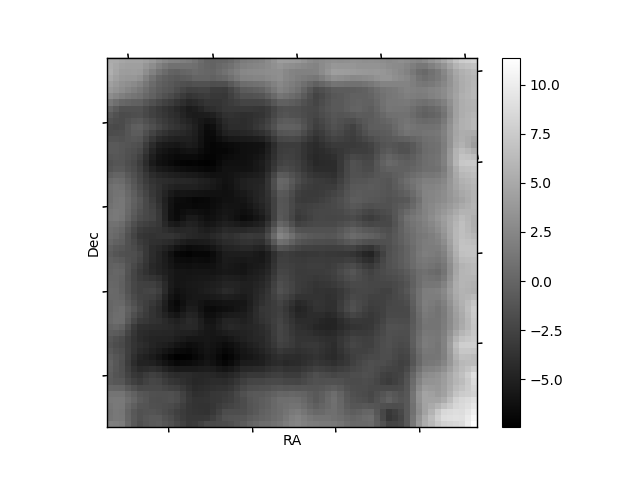
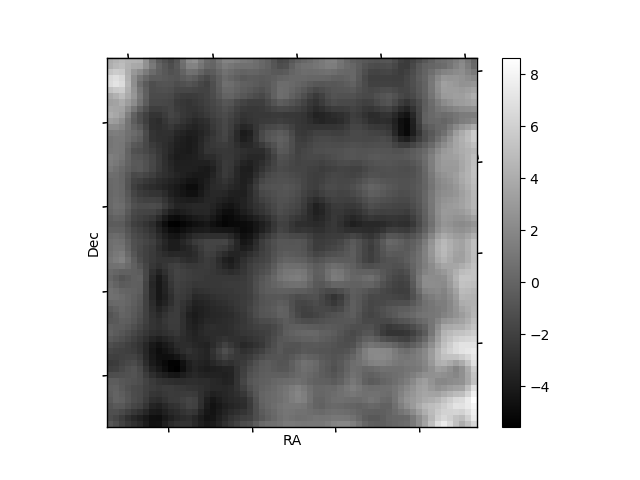
Histogram calculated using DETX and DETY for each event in the final _common_clean file
| Quadrant A | 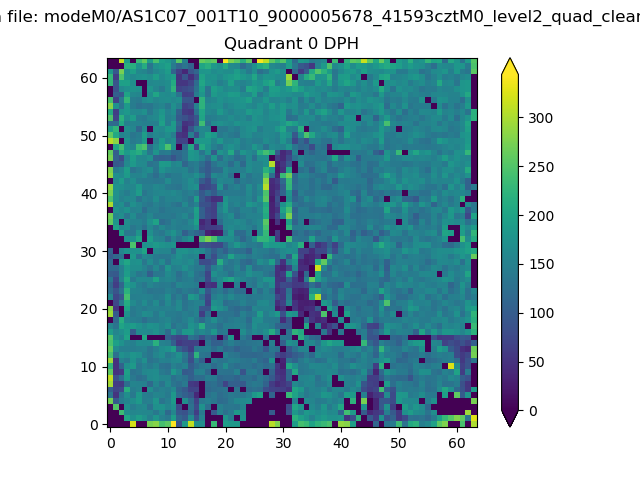 |
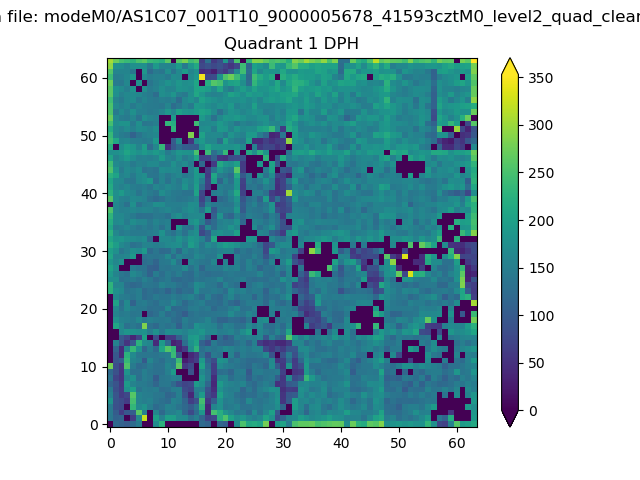 |
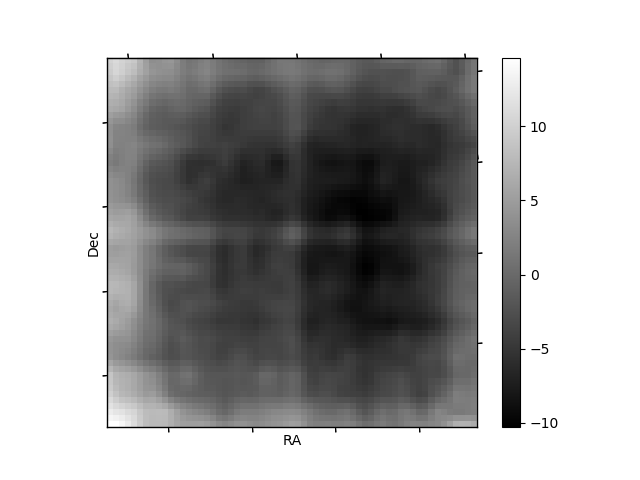
Quadrant B |
|---|---|---|---|
| Quadrant D | 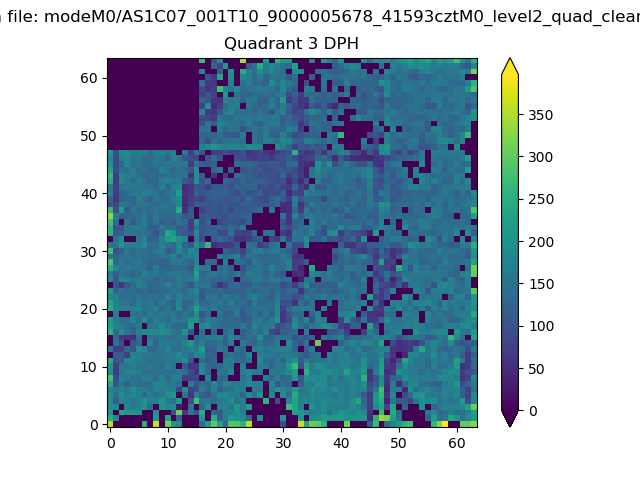 |
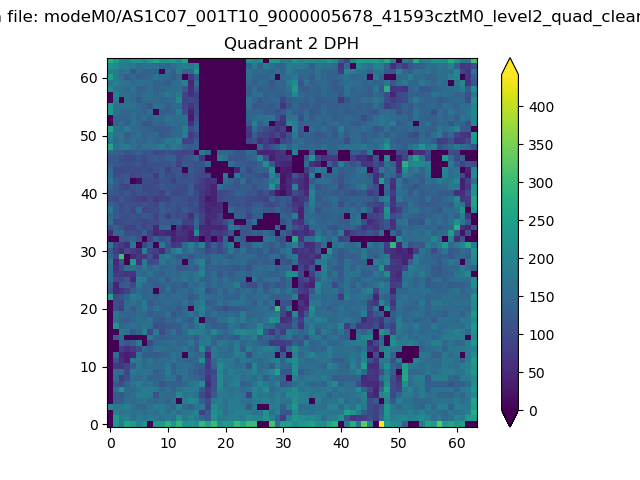 |
Quadrant C |
| Plot type | Count rate plots | Images |
|---|---|---|
| Comparison with Poisson distribution Blue bars denote a histogram of data divided into 1 sec bins. Red curve is a Poisson curve with rate = median count rate of data. |
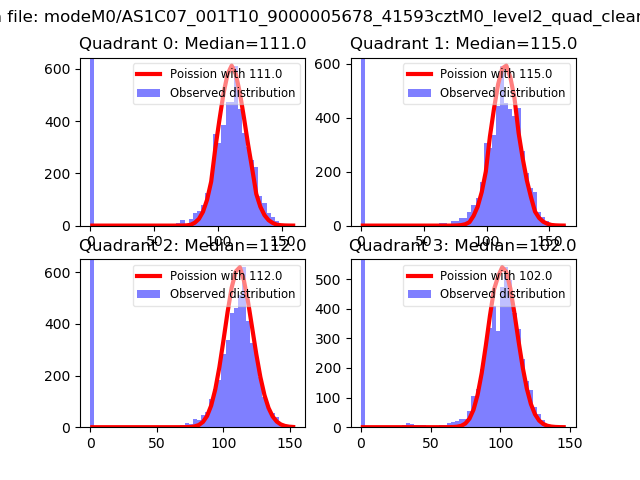 |
 |
| Quadrant-wise count rates Data is divided into 100 sec bins |
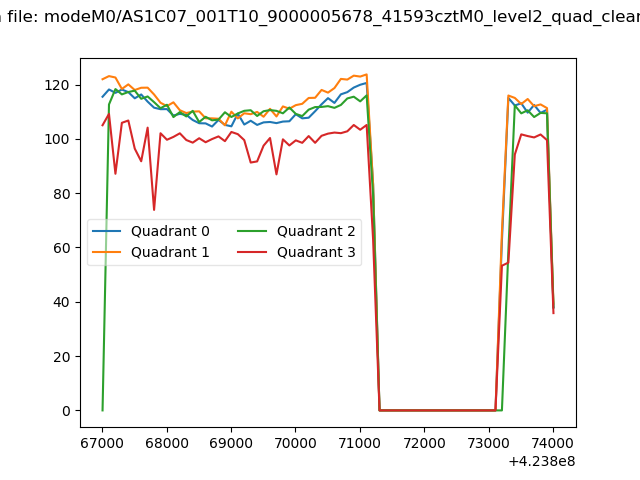 |
|
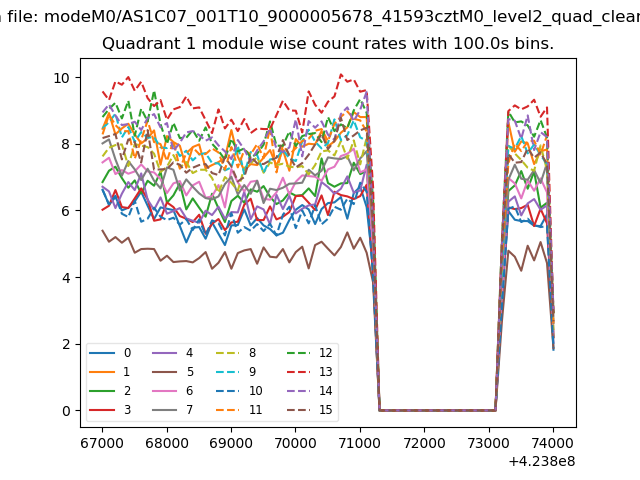
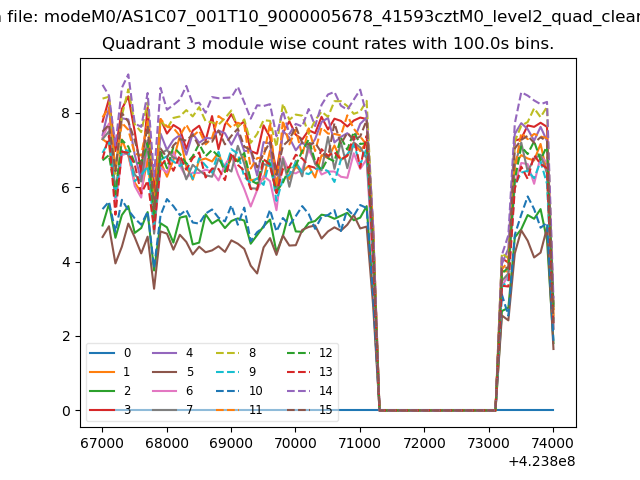
| Module-wise count rates for Quadrant A Data is divided into 100 sec bins |
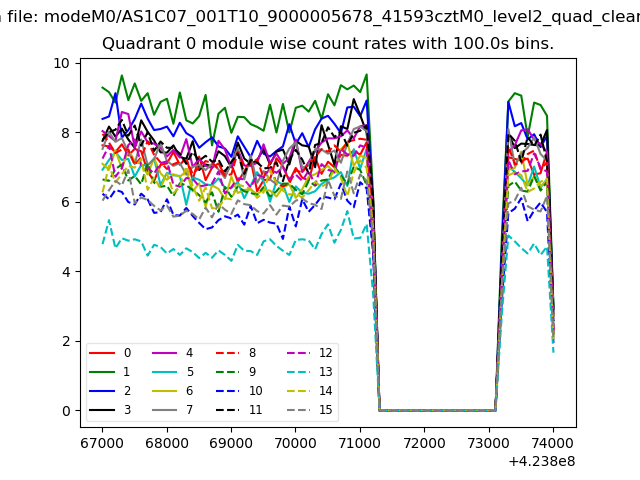 |
 |
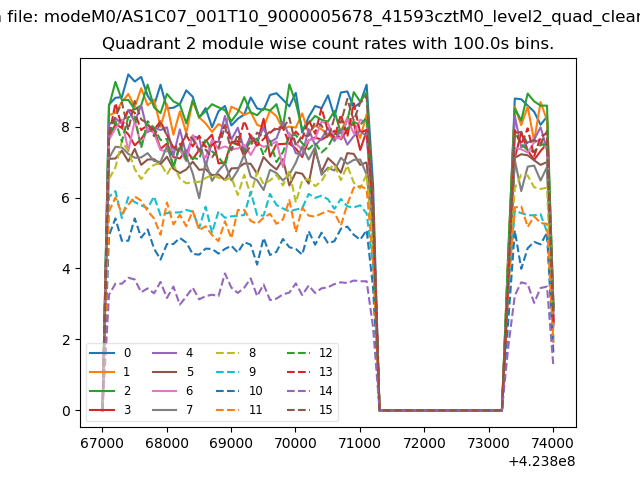
| Module-wise count rates for Quadrant B Data is divided into 100 sec bins |
 |
 |
| Module-wise count rates for Quadrant C Data is divided into 100 sec bins |
 |
 |
| Module-wise count rates for Quadrant D Data is divided into 100 sec bins |
 |
 |
| Parameter | Plot |
|---|---|
| CZT HV Monitor | 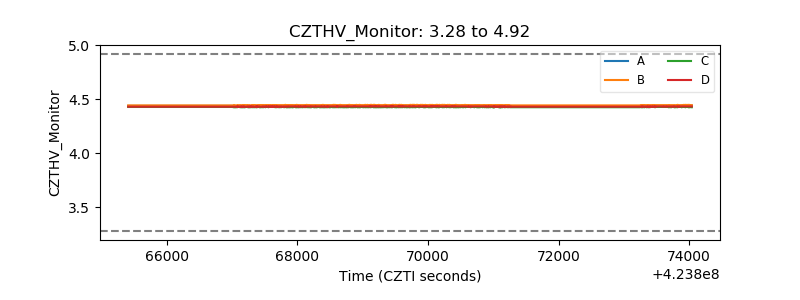 |
| D_VDD | 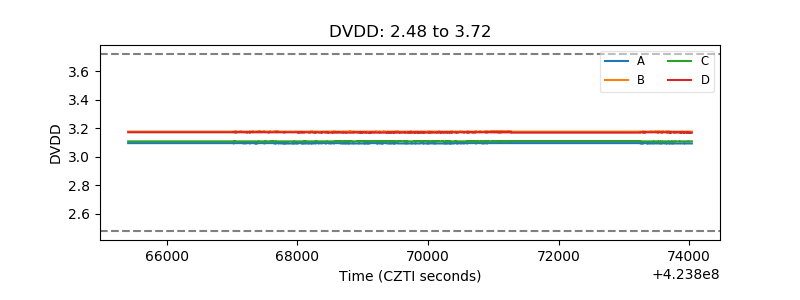 |
| Temperature 1 | 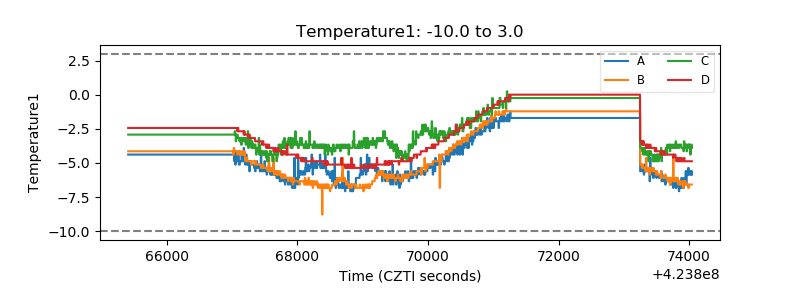 |
| Veto HV Monitor | 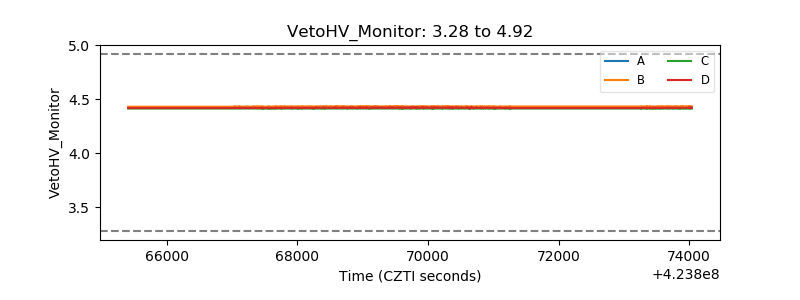 |
| Veto LLD |  |
| Alpha Counter |  |
| _CPM_Rate | 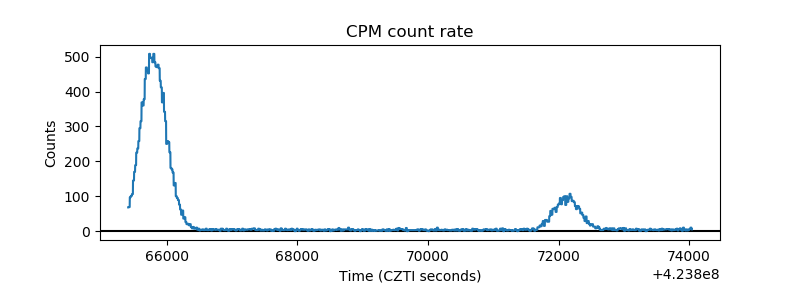 |
| CZT Counter | 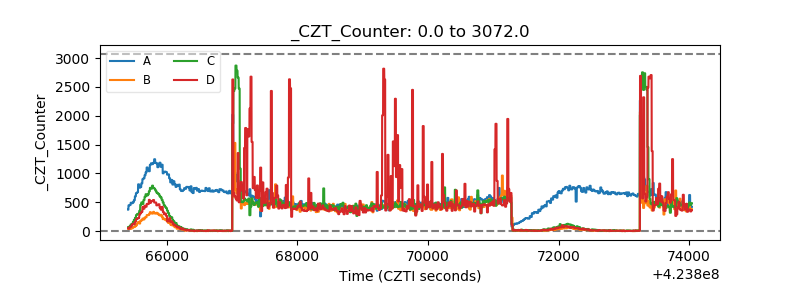 |
| +2.5 Volts monitor | 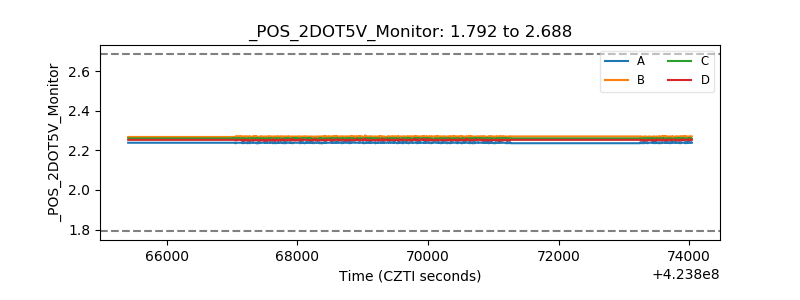 |
| +5 Volts monitor | 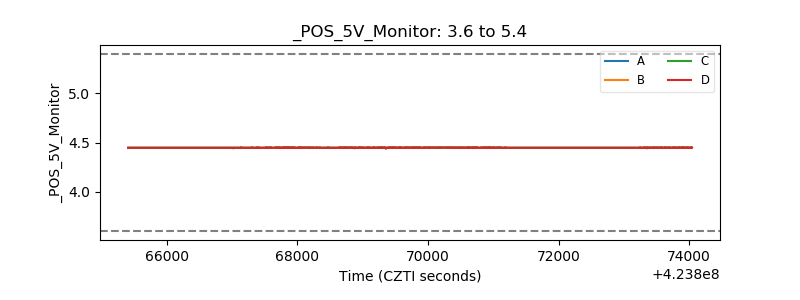 |
| _ROLL_ROT | 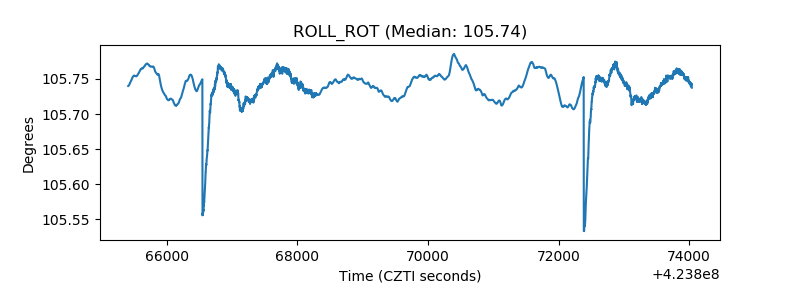 |
| _Roll_DEC | 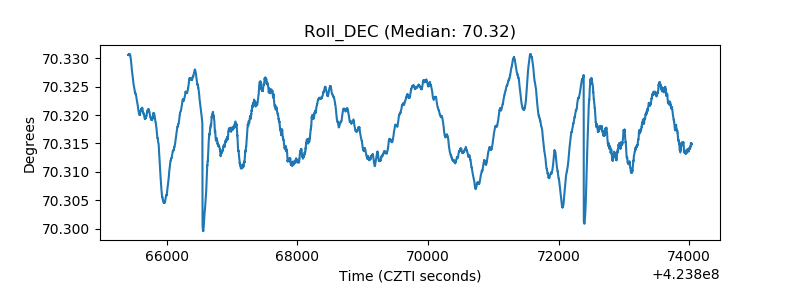 |
| _Roll_RA | 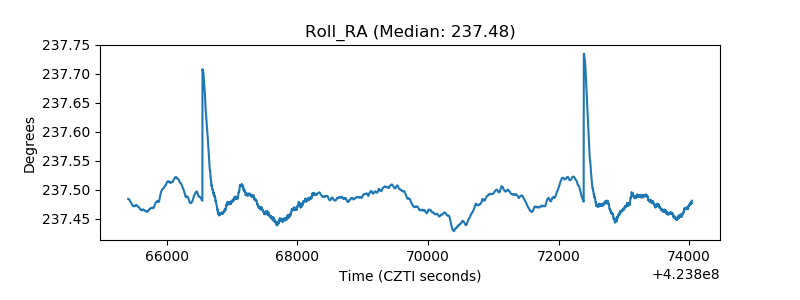 |
| Veto Counter | 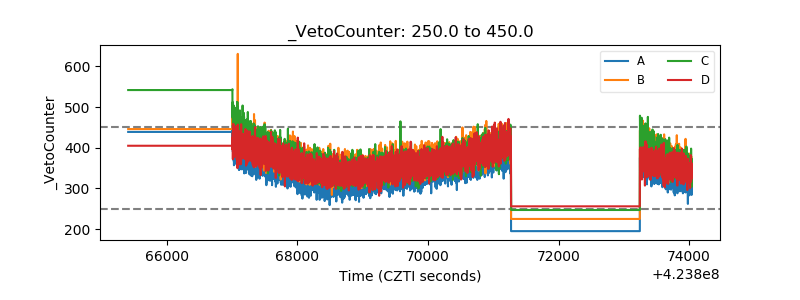 |