| Param | Original file | Final file |
|---|---|---|
| Filename | modeM0/AS1C07_001T10_9000005678_41594cztM0_level2.fits | modeM0/AS1C07_001T10_9000005678_41594cztM0_level2_quad_clean.evt |
| Size (bytes) | 322,879,680 | 87,180,480 |
| Size | 307.9 MB | 83.1 MB |
| Events in quadrant A | 2,786,145 | 582,813 |
| Events in quadrant B | 2,590,165 | 597,189 |
| Events in quadrant C | 3,009,903 | 562,870 |
| Events in quadrant D | 3,143,888 | 518,591 |
| Mode SS | |||
|---|---|---|---|
| Quadrant | BADHDUFLAG | Total packets | Discarded packets |
| A | 0 | 108 | 0 |
| B | 0 | 108 | 0 |
| C | 0 | 108 | 0 |
| D | 0 | 108 | 0 |
| Mode M0 | |||
|---|---|---|---|
| Quadrant | BADHDUFLAG | Total packets | Discarded packets |
| A | 0 | 11708 | 2 |
| B | 0 | 11730 | 2 |
| C | 0 | 12571 | 2 |
| D | 0 | 13446 | 2 |
| Mode M9 | |||
|---|---|---|---|
| Quadrant | BADHDUFLAG | Total packets | Discarded packets |
| A | 0 | 29 | 0 |
| B | 0 | 29 | 0 |
| C | 0 | 30 | 0 |
| D | 0 | 30 | 0 |
| Quadrant | Total seconds | Saturated seconds | Saturation percentage |
|---|---|---|---|
| A | 5412 | 11 | 0.203252% |
| B | 5412 | 30 | 0.554324% |
| C | 5411 | 204 | 3.770098% |
| D | 5411 | 224 | 4.139715% |
Noise dominated data is calculated using 1-second bins in cleaned event files. If a bin has >2000 counts, and if more than 50% of those come from <1% of pixels, then it is considered to be noise-dominated and hence unusable.
| Quadrant | # 1 sec bins | Bins with >0 counts | Bins with >2000 counts | High rate bins dominated by noise | Noise dominated (total time) | Noise dominated (detector-on time) | Marked lightcurve |
|---|---|---|---|---|---|---|---|
| A | 7055 | 5413 | 5 | 5 | 0.07% | 0.09% | 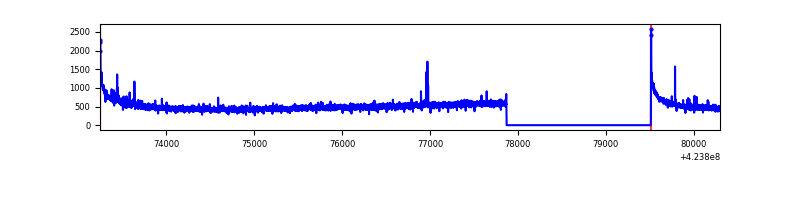 |
| B | 7055 | 5413 | 13 | 13 | 0.18% | 0.24% | 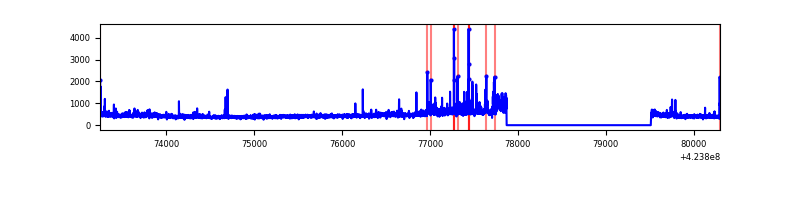 |
| C | 7054 | 5412 | 196 | 196 | 2.78% | 3.62% | 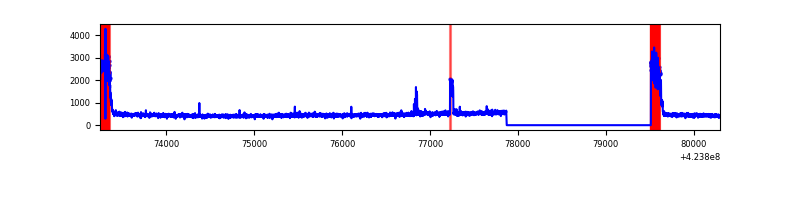 |
| D | 7054 | 5412 | 175 | 175 | 2.48% | 3.23% | 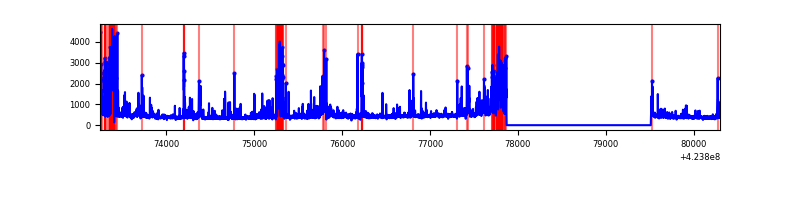 |
Top three noisy pixels from each quadrant. If the there are fewer than three noisy pixels in the level2.evt file, extra rows are filled as -1
| Pixel properties | Quadrant properties | ||||||
|---|---|---|---|---|---|---|---|
| Quadrant | DetID | PixID | Counts | Sigma | Mean | Median | Sigma |
| A | 10 | 83 | 542681 | 4637.5 | 572 | 561 | 116.9 |
| A | 7 | 3 | 15933 | 131.5 | 572 | 561 | 116.9 |
| A | 13 | 254 | 9398 | 75.6 | 572 | 561 | 116.9 |
| B | 0 | 186 | 111556 | 1005.09 | 568 | 552 | 110.4 |
| B | 0 | 190 | 64214 | 576.43 | 568 | 552 | 110.4 |
| B | 5 | 255 | 51060 | 457.33 | 568 | 552 | 110.4 |
| C | 0 | 10 | 572753 | 4486.0 | 548 | 550 | 127.6 |
| C | 15 | 214 | 233982 | 1830.08 | 548 | 550 | 127.6 |
| C | 0 | 15 | 64793 | 503.65 | 548 | 550 | 127.6 |
| D | 13 | 249 | 326875 | 2426.19 | 548 | 530 | 134.5 |
| D | 1 | 47 | 196720 | 1458.56 | 548 | 530 | 134.5 |
| D | 12 | 233 | 193226 | 1432.59 | 548 | 530 | 134.5 |
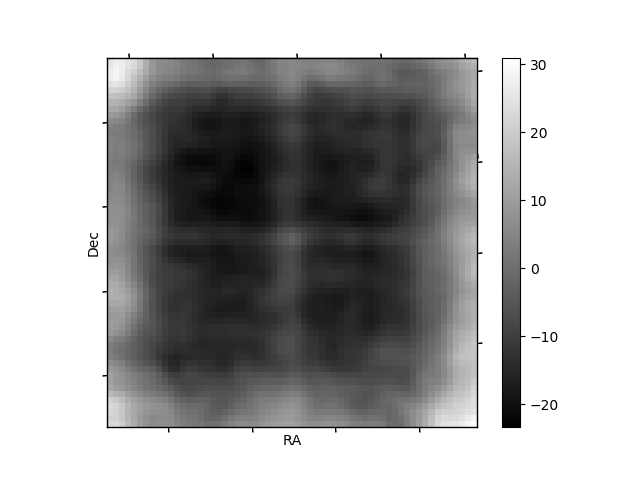
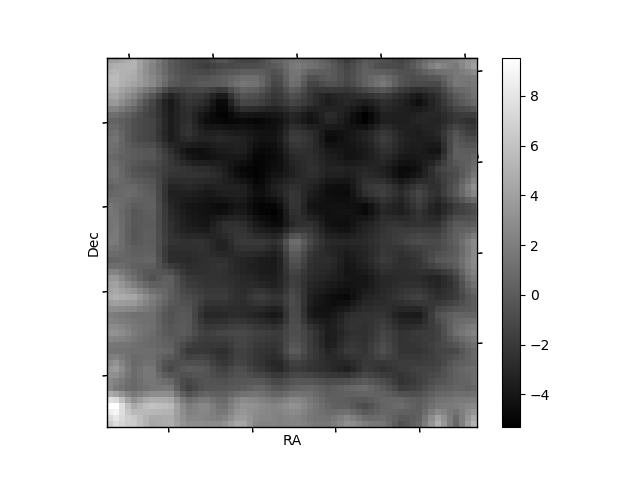
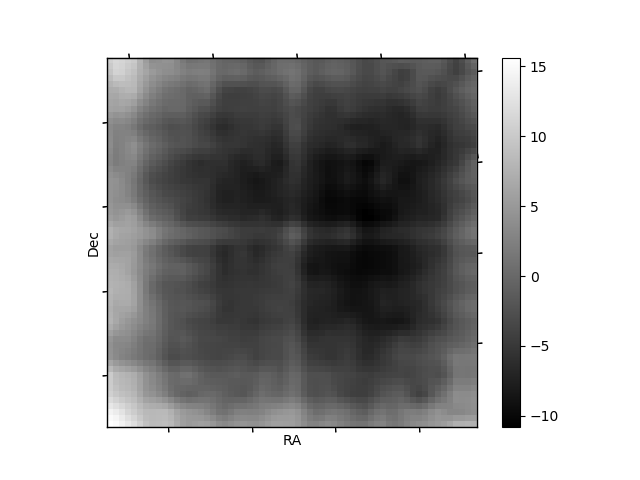
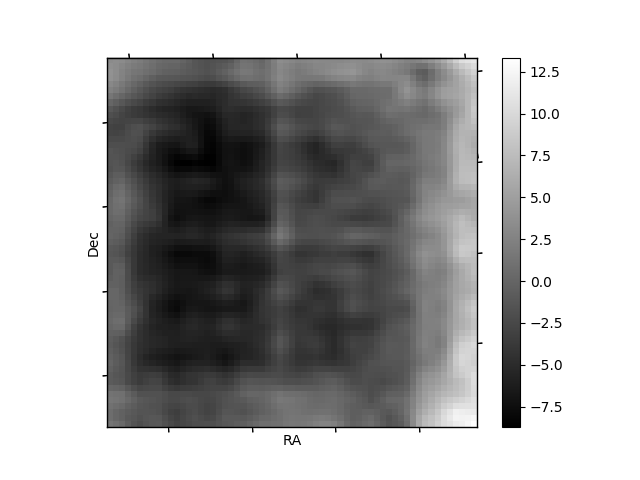
Histogram calculated using DETX and DETY for each event in the final _common_clean file
| Quadrant A | 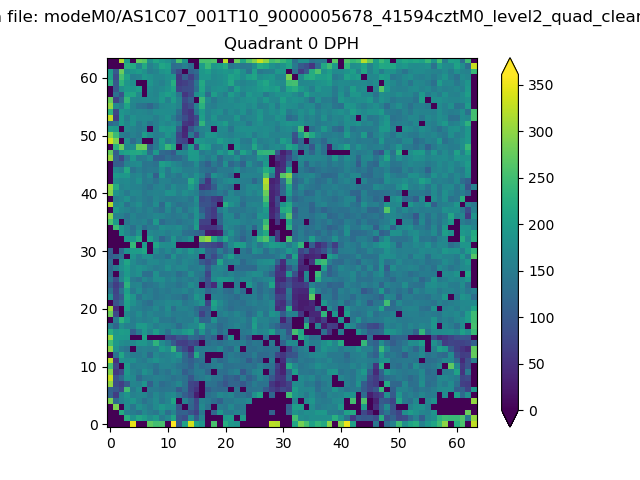 |
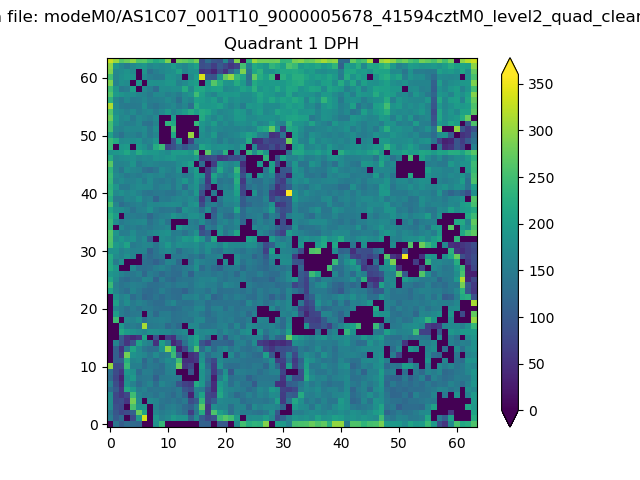 |
Quadrant B |
|---|---|---|---|
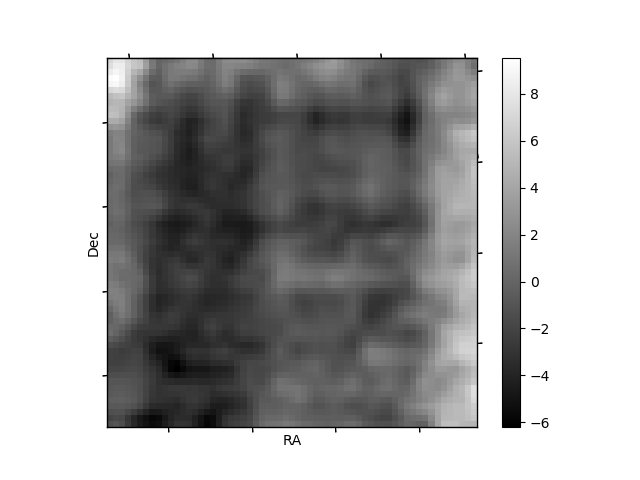
| Quadrant D | 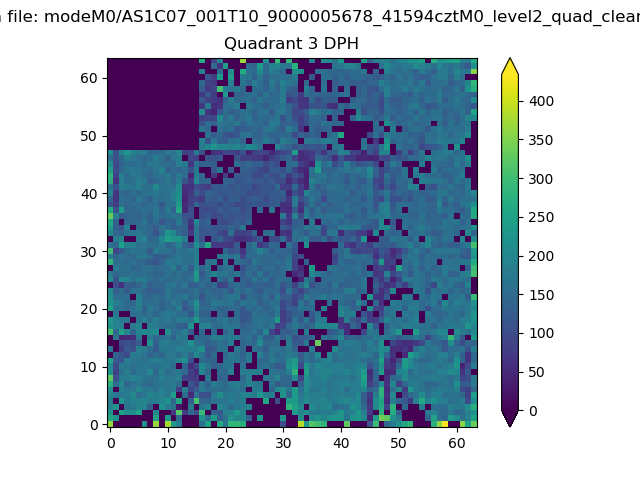 |
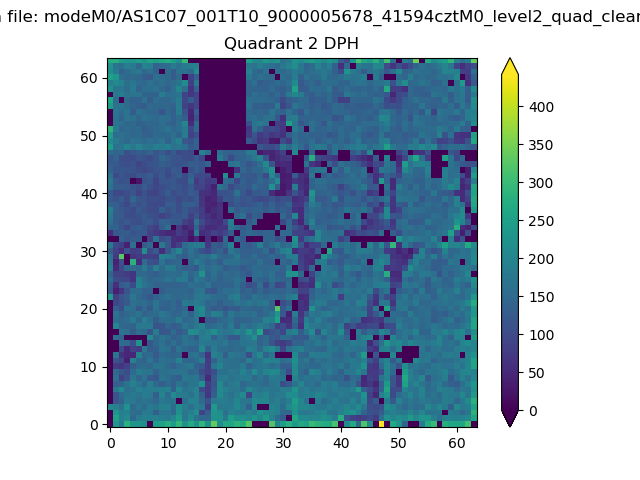 |
Quadrant C |
| Plot type | Count rate plots | Images |
|---|---|---|
| Comparison with Poisson distribution Blue bars denote a histogram of data divided into 1 sec bins. Red curve is a Poisson curve with rate = median count rate of data. |
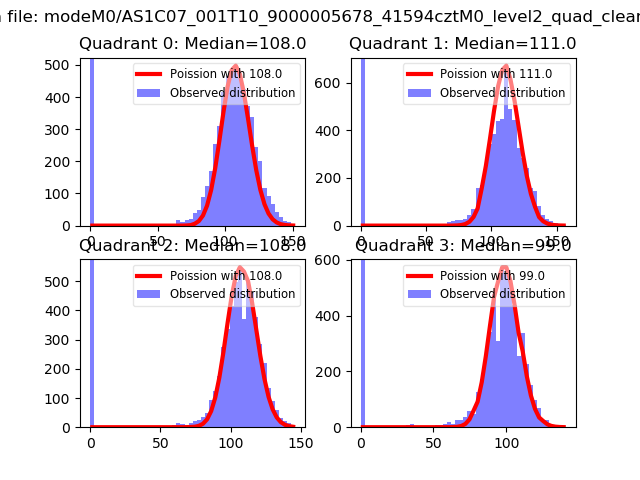 |
 |
| Quadrant-wise count rates Data is divided into 100 sec bins |
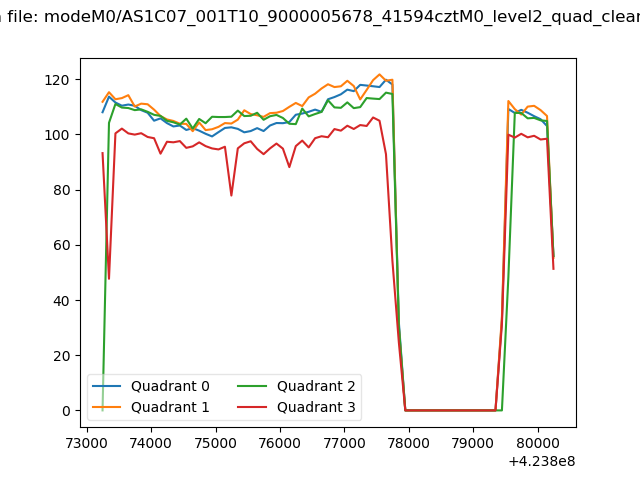 |
|
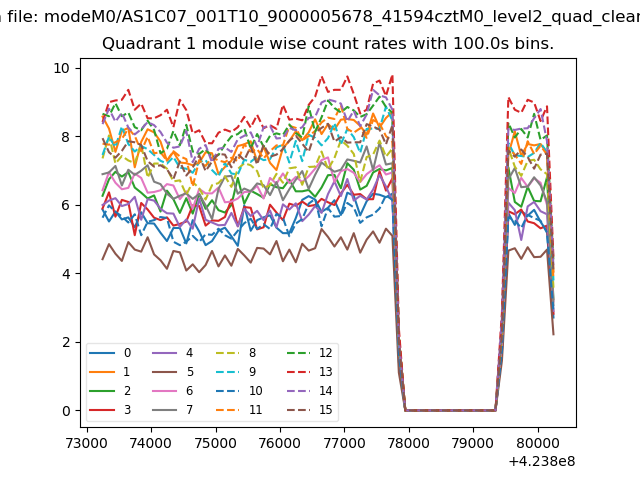
| Module-wise count rates for Quadrant A Data is divided into 100 sec bins |
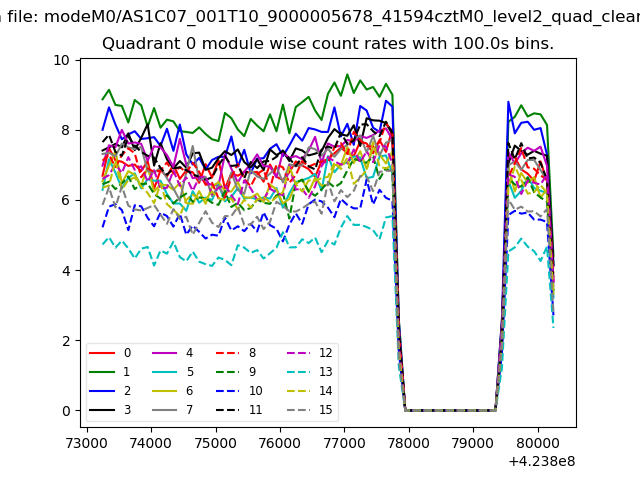 |
 |
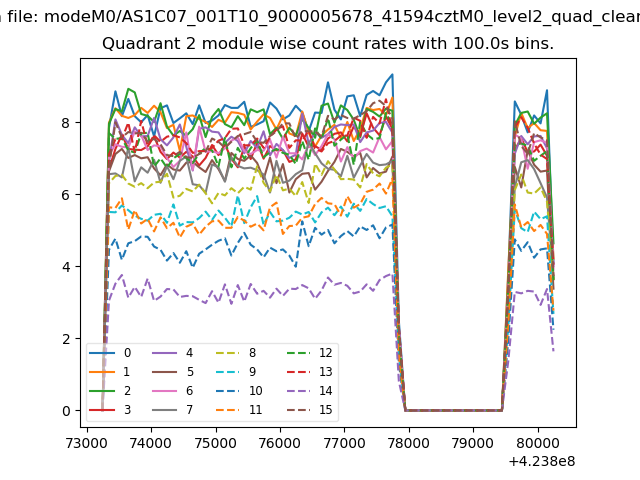
| Module-wise count rates for Quadrant B Data is divided into 100 sec bins |
 |
 |
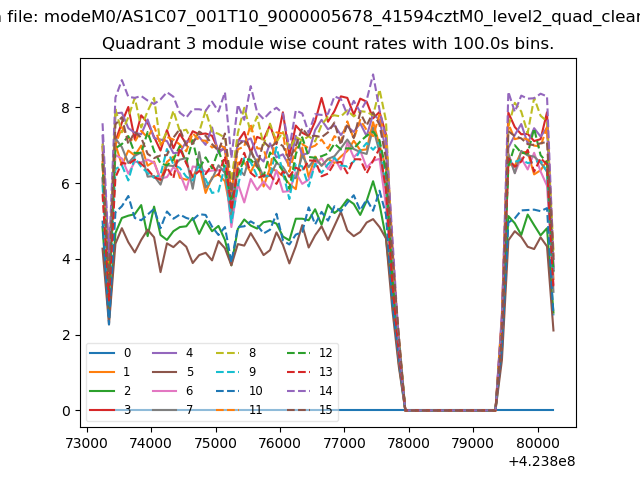
| Module-wise count rates for Quadrant C Data is divided into 100 sec bins |
 |
 |
| Module-wise count rates for Quadrant D Data is divided into 100 sec bins |
 |
 |
| Parameter | Plot |
|---|---|
| CZT HV Monitor |  |
| D_VDD | 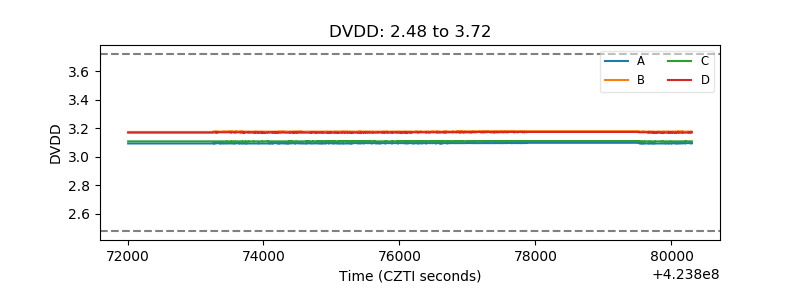 |
| Temperature 1 | 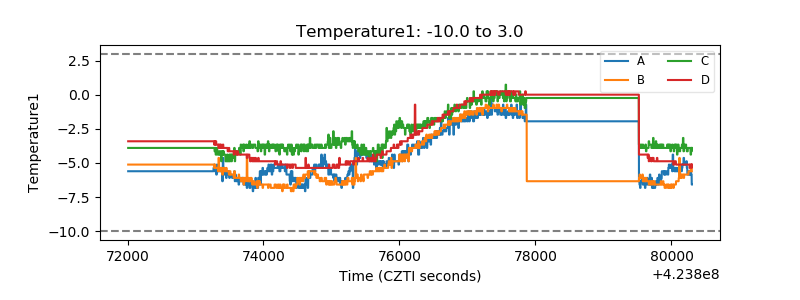 |
| Veto HV Monitor | 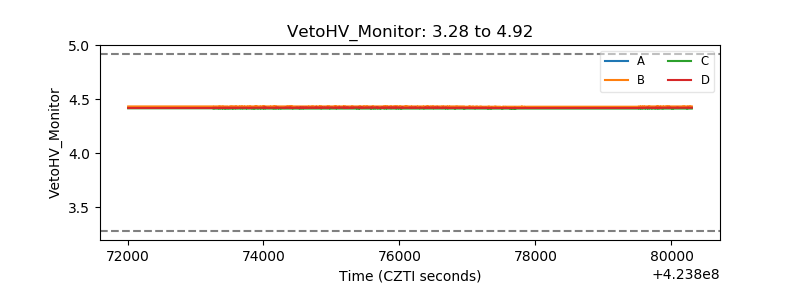 |
| Veto LLD | 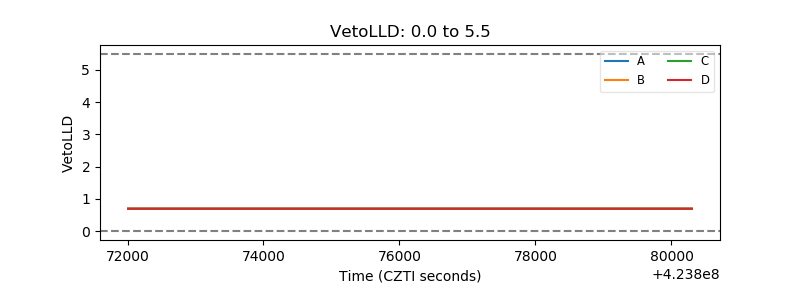 |
| Alpha Counter | 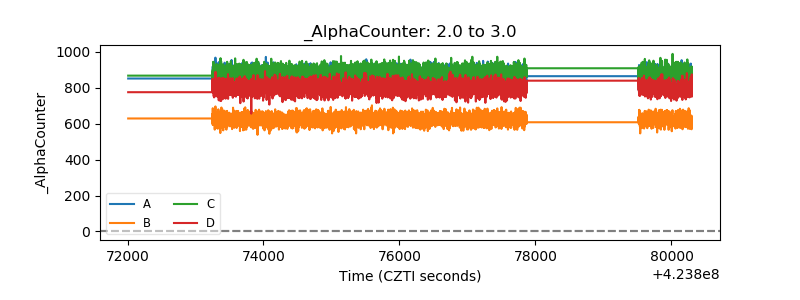 |
| _CPM_Rate | 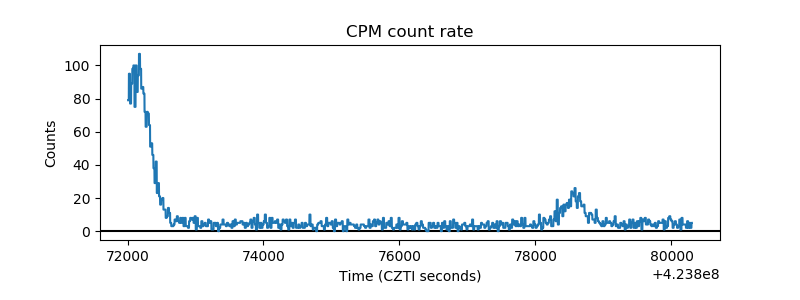 |
| CZT Counter | 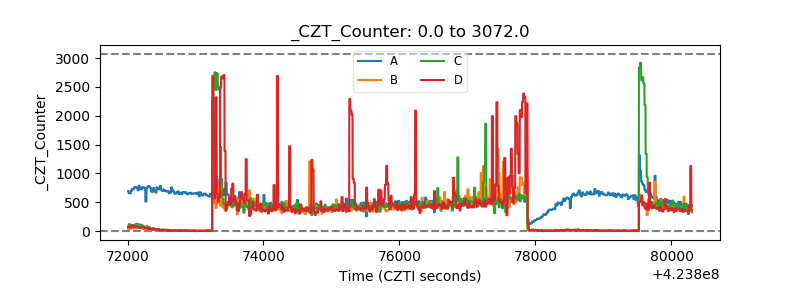 |
| +2.5 Volts monitor | 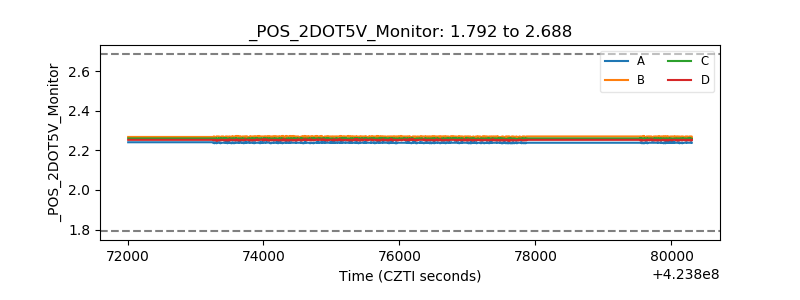 |
| +5 Volts monitor | 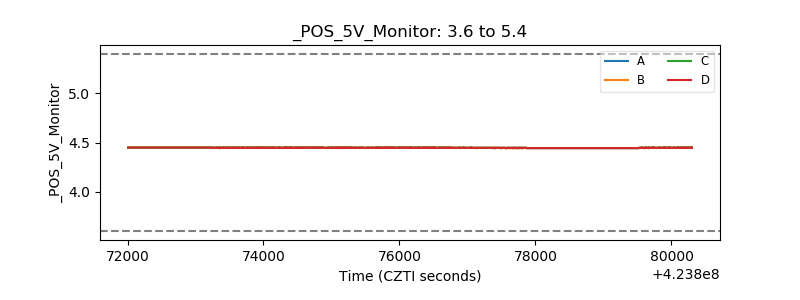 |
| _ROLL_ROT | 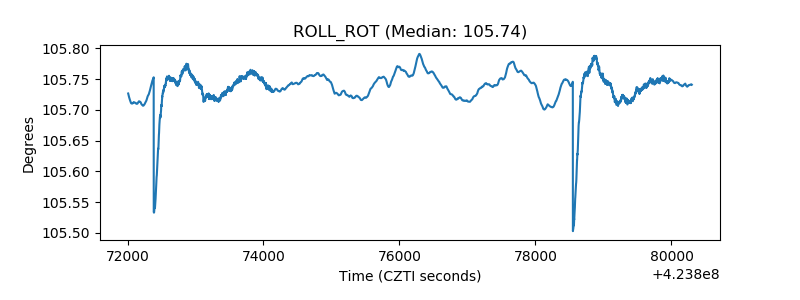 |
| _Roll_DEC | 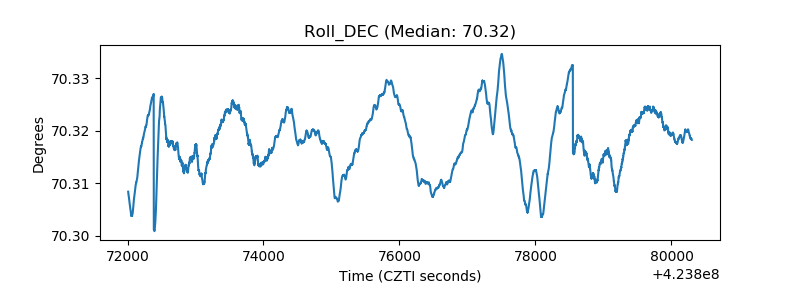 |
| _Roll_RA | 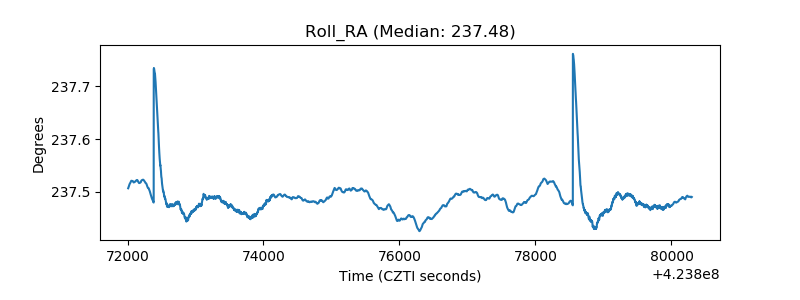 |
| Veto Counter | 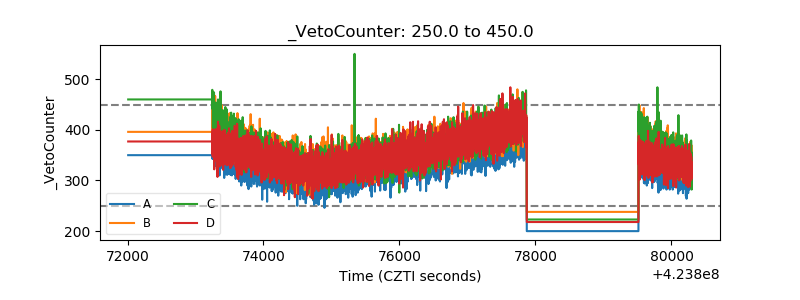 |