| Param | Original file | Final file |
|---|---|---|
| Filename | modeM0/AS1C07_001T10_9000005678_41595cztM0_level2.fits | modeM0/AS1C07_001T10_9000005678_41595cztM0_level2_quad_clean.evt |
| Size (bytes) | 367,891,200 | 97,174,080 |
| Size | 350.8 MB | 92.7 MB |
| Events in quadrant A | 3,138,386 | 651,305 |
| Events in quadrant B | 3,105,216 | 664,815 |
| Events in quadrant C | 3,263,822 | 629,070 |
| Events in quadrant D | 3,639,703 | 574,528 |
| Mode SS | |||
|---|---|---|---|
| Quadrant | BADHDUFLAG | Total packets | Discarded packets |
| A | 0 | 126 | 0 |
| B | 0 | 126 | 0 |
| C | 0 | 126 | 0 |
| D | 0 | 126 | 0 |
| Mode M0 | |||
|---|---|---|---|
| Quadrant | BADHDUFLAG | Total packets | Discarded packets |
| A | 0 | 13073 | 2 |
| B | 0 | 13860 | 2 |
| C | 0 | 13650 | 2 |
| D | 0 | 15533 | 2 |
| Mode M9 | |||
|---|---|---|---|
| Quadrant | BADHDUFLAG | Total packets | Discarded packets |
| A | 0 | 30 | 0 |
| B | 0 | 30 | 0 |
| C | 0 | 30 | 0 |
| D | 0 | 30 | 0 |
| Quadrant | Total seconds | Saturated seconds | Saturation percentage |
|---|---|---|---|
| A | 6047 | 9 | 0.148834% |
| B | 6047 | 39 | 0.644948% |
| C | 6047 | 181 | 2.993220% |
| D | 6047 | 279 | 4.613858% |
Noise dominated data is calculated using 1-second bins in cleaned event files. If a bin has >2000 counts, and if more than 50% of those come from <1% of pixels, then it is considered to be noise-dominated and hence unusable.
| Quadrant | # 1 sec bins | Bins with >0 counts | Bins with >2000 counts | High rate bins dominated by noise | Noise dominated (total time) | Noise dominated (detector-on time) | Marked lightcurve |
|---|---|---|---|---|---|---|---|
| A | 9062 | 6049 | 4 | 4 | 0.04% | 0.07% | 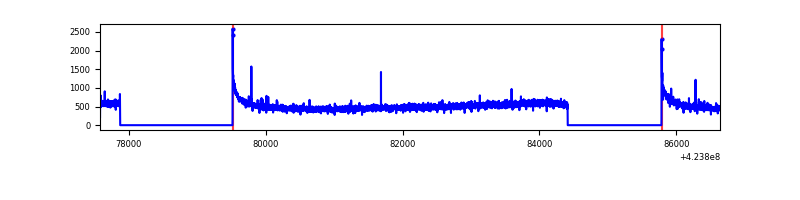 |
| B | 9062 | 6049 | 14 | 14 | 0.15% | 0.23% | 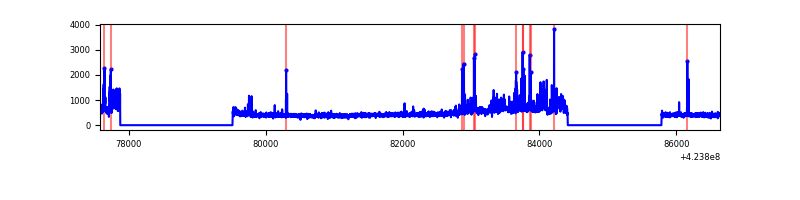 |
| C | 9062 | 6049 | 179 | 179 | 1.98% | 2.96% | 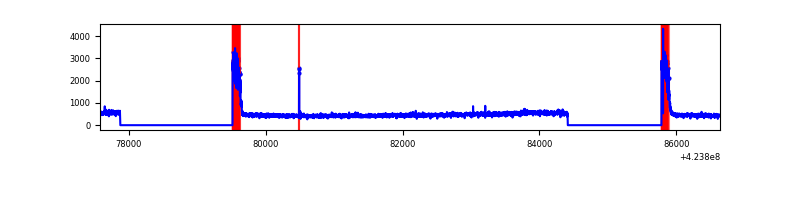 |
| D | 9062 | 6049 | 208 | 208 | 2.30% | 3.44% | 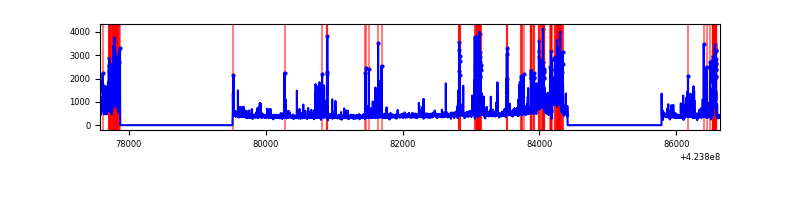 |
Top three noisy pixels from each quadrant. If the there are fewer than three noisy pixels in the level2.evt file, extra rows are filled as -1
| Pixel properties | Quadrant properties | ||||||
|---|---|---|---|---|---|---|---|
| Quadrant | DetID | PixID | Counts | Sigma | Mean | Median | Sigma |
| A | 10 | 83 | 601297 | 4482.17 | 650 | 636 | 134.0 |
| A | 13 | 254 | 10115 | 70.73 | 650 | 636 | 134.0 |
| A | 7 | 3 | 9121 | 63.32 | 650 | 636 | 134.0 |
| B | 0 | 186 | 257420 | 2069.32 | 647 | 629 | 124.1 |
| B | 0 | 190 | 71764 | 573.23 | 647 | 629 | 124.1 |
| B | 5 | 255 | 67732 | 540.74 | 647 | 629 | 124.1 |
| C | 0 | 10 | 535963 | 3635.89 | 628 | 632 | 147.2 |
| C | 15 | 214 | 265634 | 1799.86 | 628 | 632 | 147.2 |
| C | 0 | 15 | 12531 | 80.82 | 628 | 632 | 147.2 |
| D | 13 | 249 | 385583 | 2523.77 | 623 | 604 | 152.5 |
| D | 12 | 218 | 181433 | 1185.44 | 623 | 604 | 152.5 |
| D | 12 | 233 | 151777 | 991.03 | 623 | 604 | 152.5 |
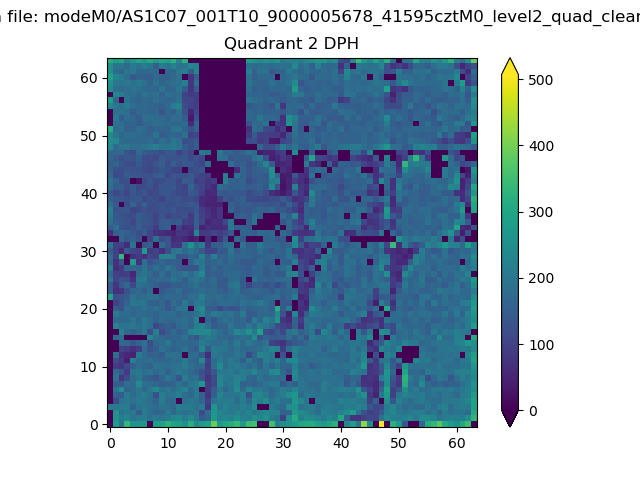
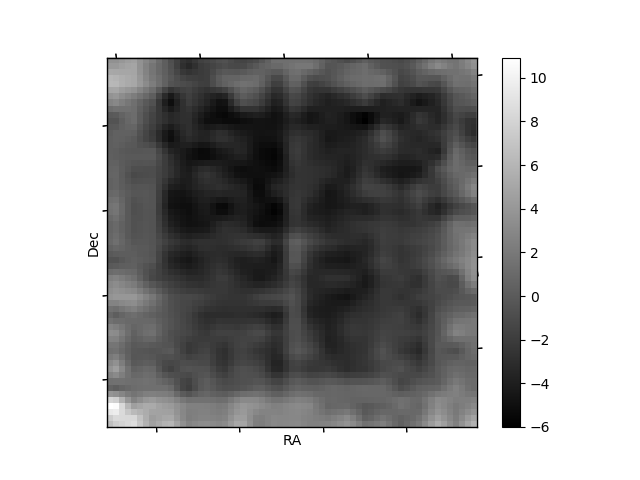
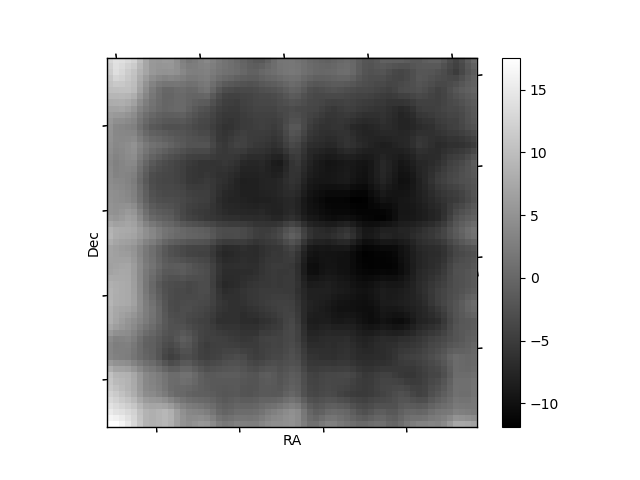
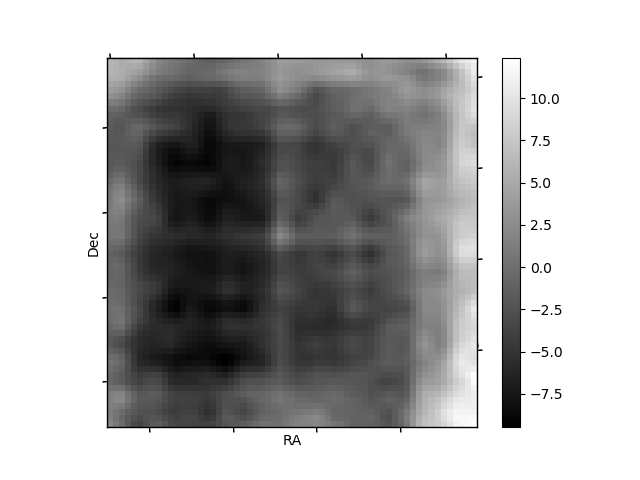
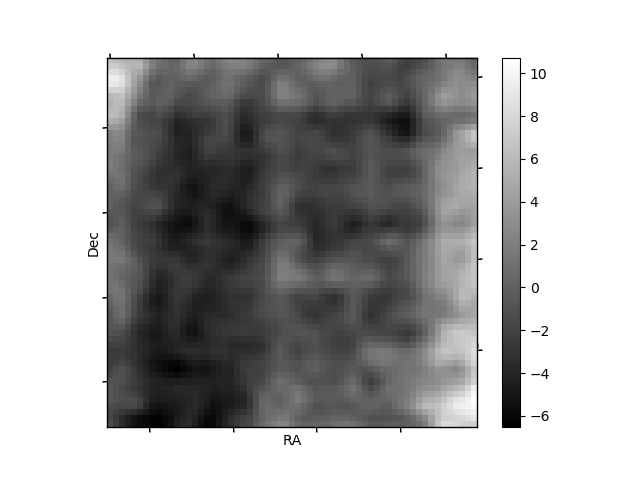
Histogram calculated using DETX and DETY for each event in the final _common_clean file
| Quadrant A |  |
 |
Quadrant B |
|---|---|---|---|
| Quadrant D | 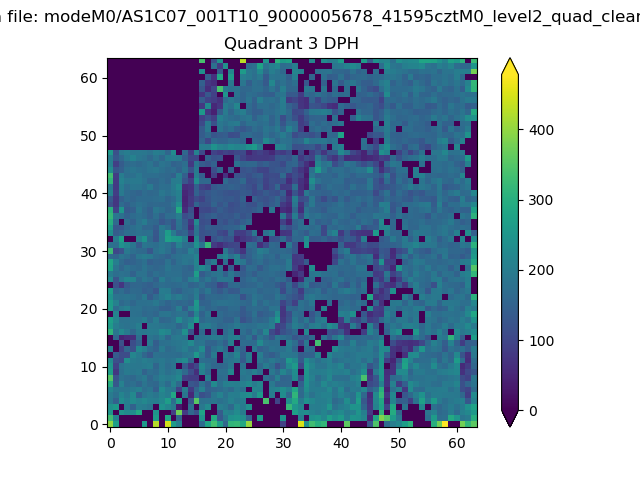 |
 |
Quadrant C |
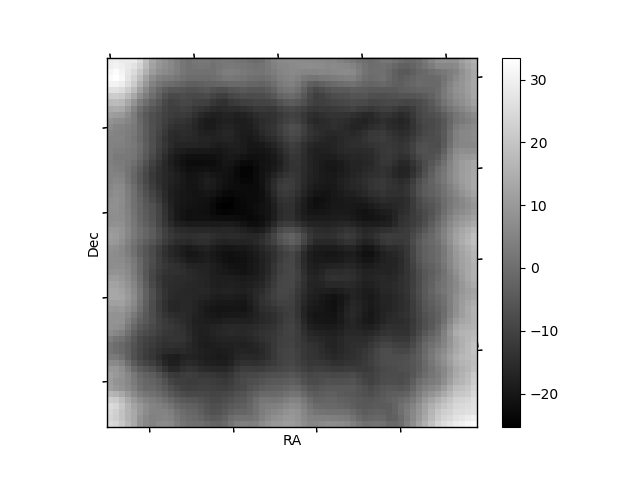
| Plot type | Count rate plots | Images |
|---|---|---|
| Comparison with Poisson distribution Blue bars denote a histogram of data divided into 1 sec bins. Red curve is a Poisson curve with rate = median count rate of data. |
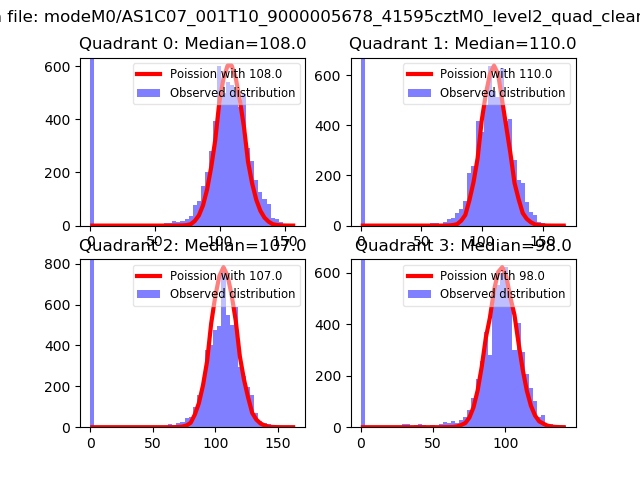 |
 |
| Quadrant-wise count rates Data is divided into 100 sec bins |
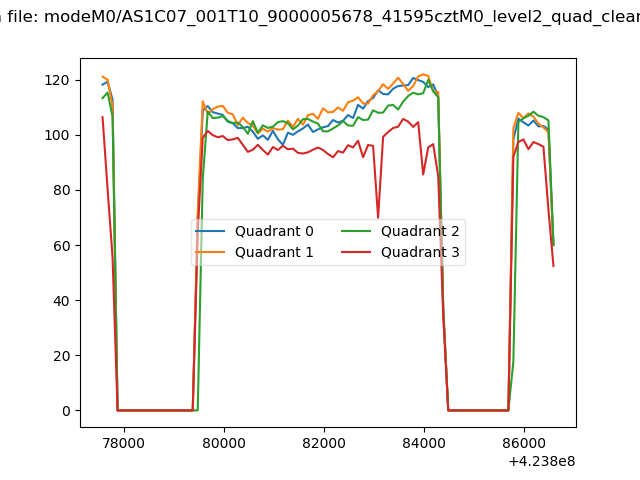 |
|
| Module-wise count rates for Quadrant A Data is divided into 100 sec bins |
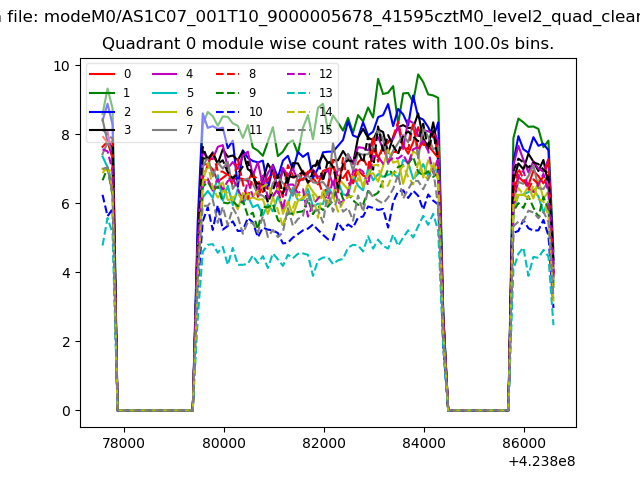 |
 |
| Module-wise count rates for Quadrant B Data is divided into 100 sec bins |
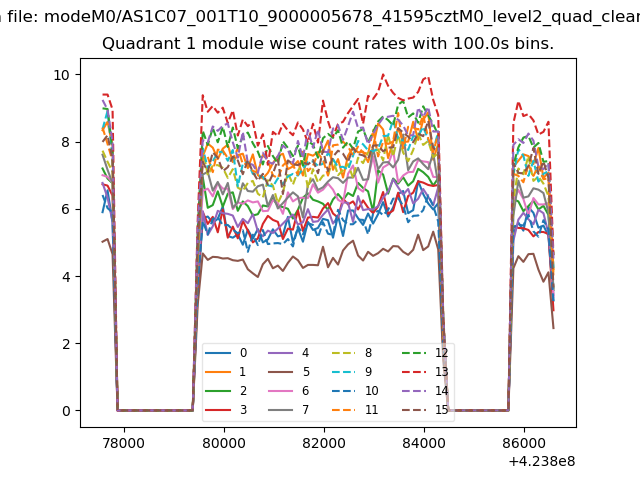 |
 |
| Module-wise count rates for Quadrant C Data is divided into 100 sec bins |
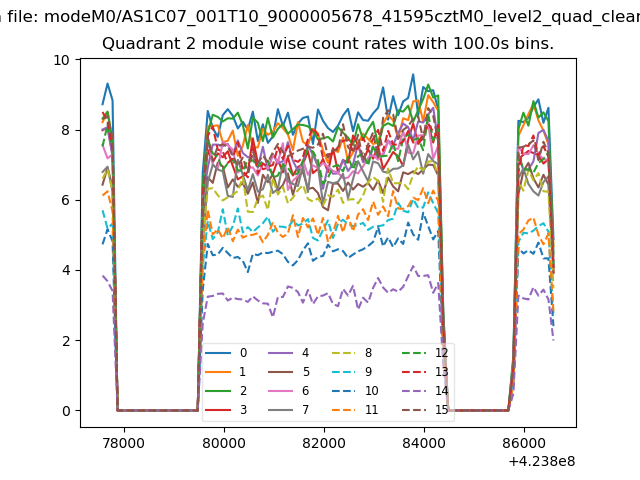 |
 |
| Module-wise count rates for Quadrant D Data is divided into 100 sec bins |
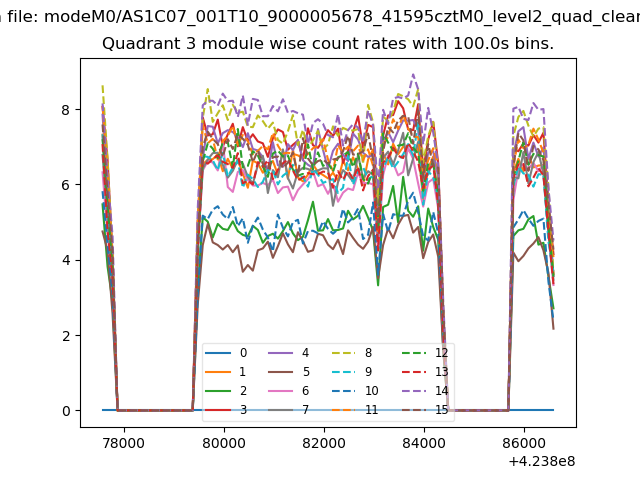 |
 |
| Parameter | Plot |
|---|---|
| CZT HV Monitor | 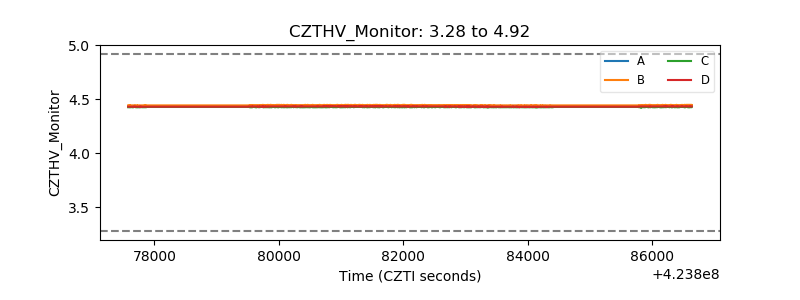 |
| D_VDD | 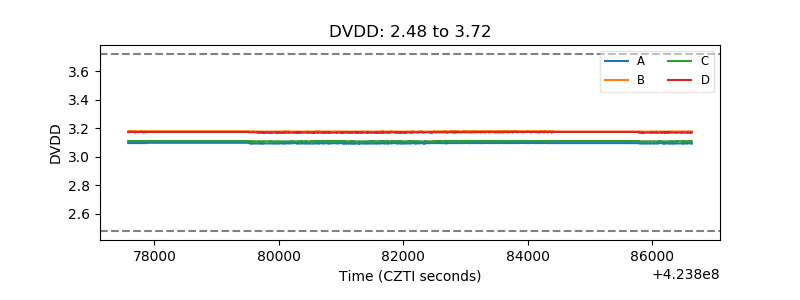 |
| Temperature 1 | 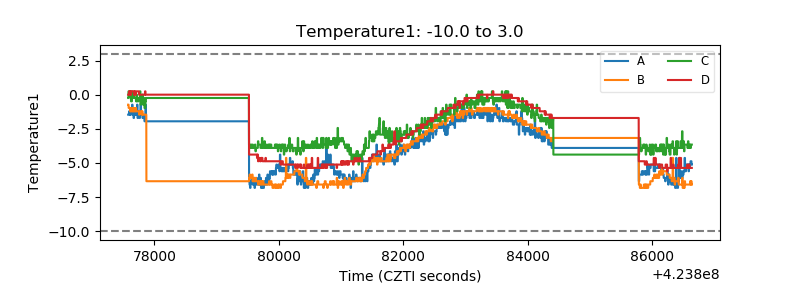 |
| Veto HV Monitor | 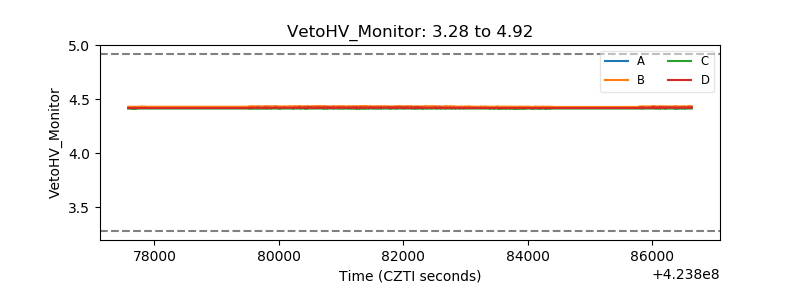 |
| Veto LLD | 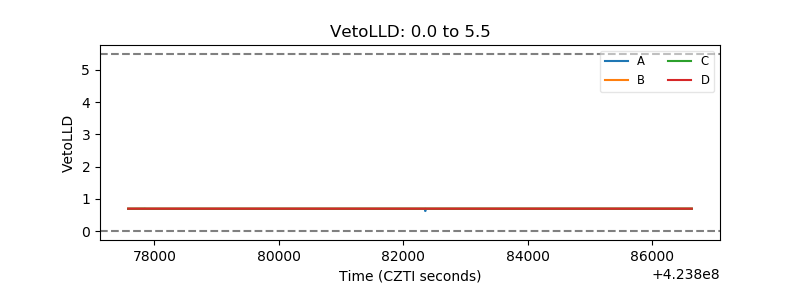 |
| Alpha Counter | 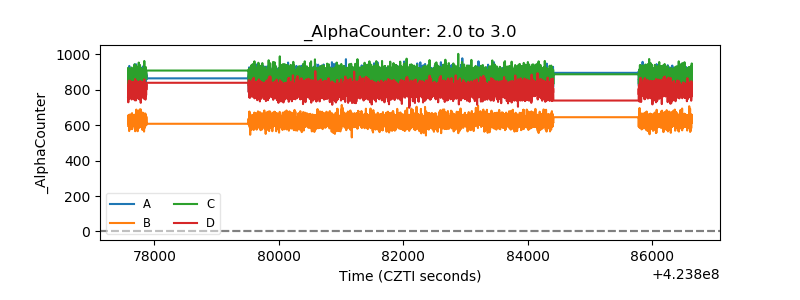 |
| _CPM_Rate | 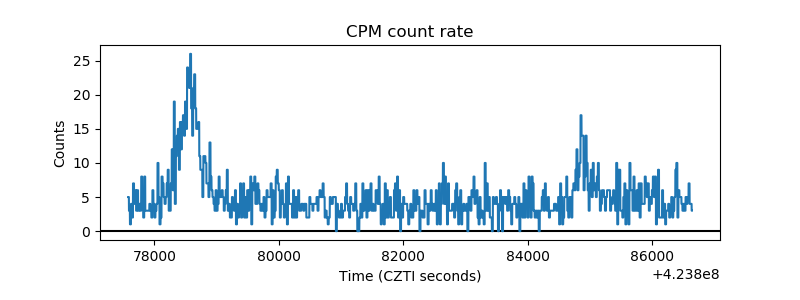 |
| CZT Counter | 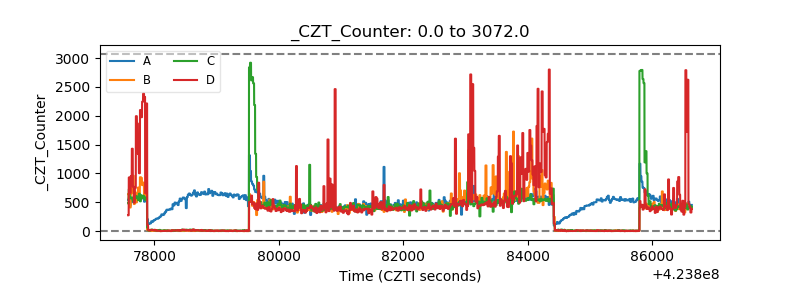 |
| +2.5 Volts monitor | 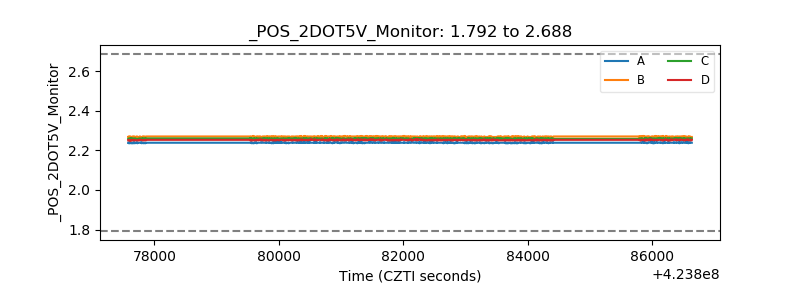 |
| +5 Volts monitor | 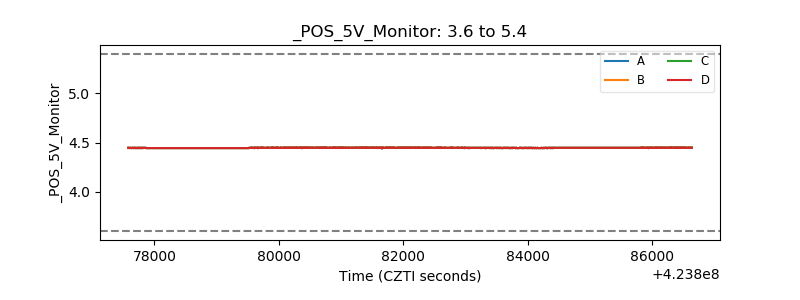 |
| _ROLL_ROT | 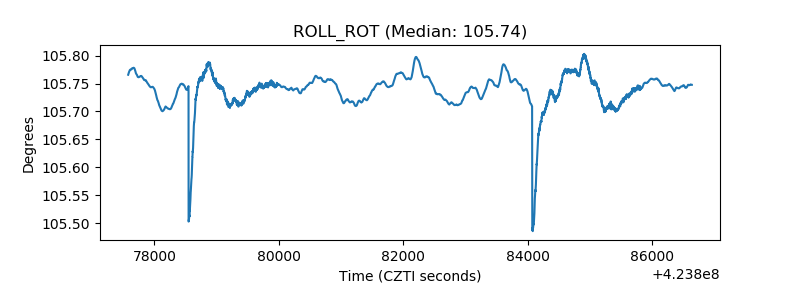 |
| _Roll_DEC | 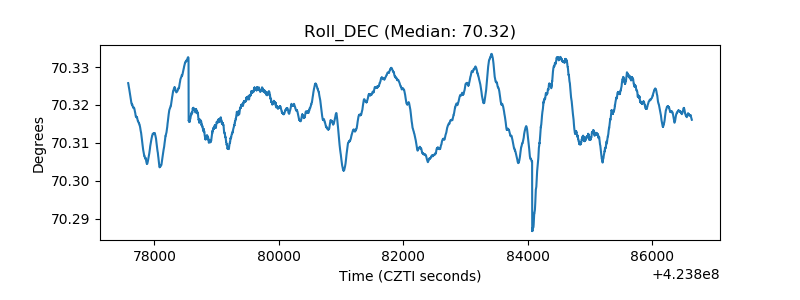 |
| _Roll_RA |  |
| Veto Counter | 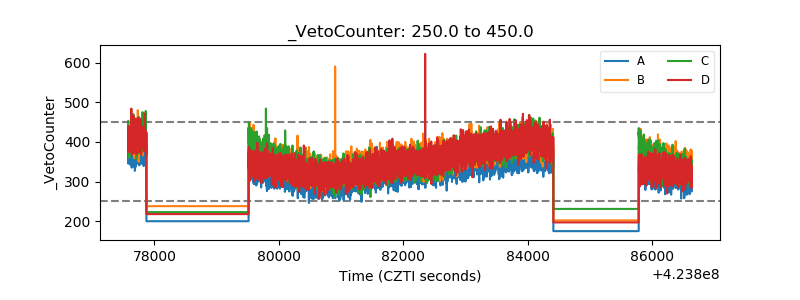 |