| Param | Original file | Final file |
|---|---|---|
| Filename | modeM0/AS1C07_001T10_9000005678_41596cztM0_level2.fits | modeM0/AS1C07_001T10_9000005678_41596cztM0_level2_quad_clean.evt |
| Size (bytes) | 388,036,800 | 101,914,560 |
| Size | 370.1 MB | 97.2 MB |
| Events in quadrant A | 3,297,828 | 681,473 |
| Events in quadrant B | 3,227,966 | 692,180 |
| Events in quadrant C | 3,384,596 | 663,495 |
| Events in quadrant D | 3,957,868 | 603,773 |
| Mode SS | |||
|---|---|---|---|
| Quadrant | BADHDUFLAG | Total packets | Discarded packets |
| A | 0 | 134 | 0 |
| B | 0 | 134 | 0 |
| C | 0 | 134 | 0 |
| D | 0 | 134 | 0 |
| Mode M0 | |||
|---|---|---|---|
| Quadrant | BADHDUFLAG | Total packets | Discarded packets |
| A | 0 | 13605 | 2 |
| B | 0 | 14347 | 2 |
| C | 0 | 14163 | 2 |
| D | 0 | 16385 | 4 |
| Mode M9 | |||
|---|---|---|---|
| Quadrant | BADHDUFLAG | Total packets | Discarded packets |
| A | 0 | 26 | 0 |
| B | 0 | 26 | 0 |
| C | 0 | 26 | 0 |
| D | 0 | 26 | 0 |
| Quadrant | Total seconds | Saturated seconds | Saturation percentage |
|---|---|---|---|
| A | 6366 | 8 | 0.125668% |
| B | 6366 | 33 | 0.518379% |
| C | 6367 | 161 | 2.528663% |
| D | 6366 | 248 | 3.895696% |
Noise dominated data is calculated using 1-second bins in cleaned event files. If a bin has >2000 counts, and if more than 50% of those come from <1% of pixels, then it is considered to be noise-dominated and hence unusable.
| Quadrant | # 1 sec bins | Bins with >0 counts | Bins with >2000 counts | High rate bins dominated by noise | Noise dominated (total time) | Noise dominated (detector-on time) | Marked lightcurve |
|---|---|---|---|---|---|---|---|
| A | 9050 | 6368 | 4 | 4 | 0.04% | 0.06% | 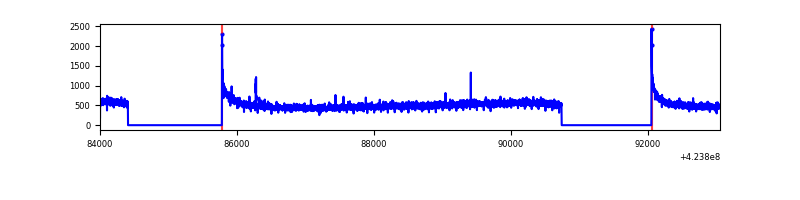 |
| B | 9050 | 6368 | 8 | 8 | 0.09% | 0.13% | 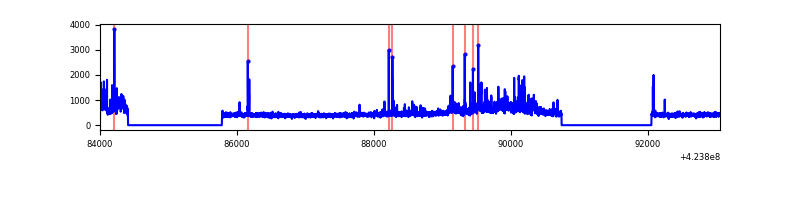 |
| C | 9051 | 6369 | 160 | 160 | 1.77% | 2.51% | 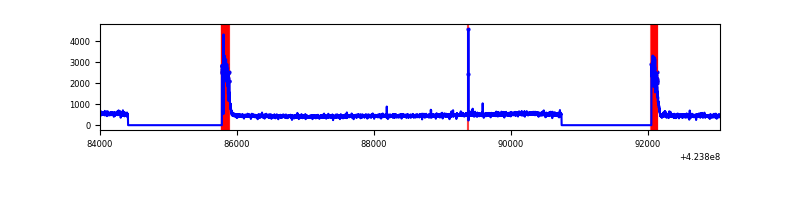 |
| D | 9050 | 6368 | 183 | 183 | 2.02% | 2.87% | 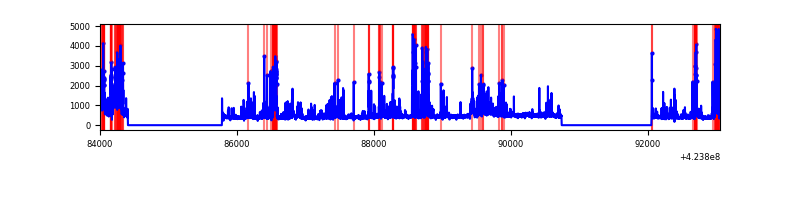 |
Top three noisy pixels from each quadrant. If the there are fewer than three noisy pixels in the level2.evt file, extra rows are filled as -1
| Pixel properties | Quadrant properties | ||||||
|---|---|---|---|---|---|---|---|
| Quadrant | DetID | PixID | Counts | Sigma | Mean | Median | Sigma |
| A | 10 | 83 | 615146 | 4309.85 | 689 | 675 | 142.6 |
| A | 13 | 254 | 10923 | 71.88 | 689 | 675 | 142.6 |
| A | 7 | 3 | 9998 | 65.39 | 689 | 675 | 142.6 |
| B | 0 | 186 | 265259 | 2004.13 | 685 | 667 | 132.0 |
| B | 0 | 190 | 85311 | 641.13 | 685 | 667 | 132.0 |
| B | 0 | 245 | 64555 | 483.92 | 685 | 667 | 132.0 |
| C | 0 | 10 | 473770 | 3027.47 | 669 | 672 | 156.3 |
| C | 15 | 214 | 279361 | 1783.4 | 669 | 672 | 156.3 |
| C | 0 | 15 | 20910 | 129.51 | 669 | 672 | 156.3 |
| D | 13 | 249 | 421683 | 2534.53 | 668 | 647 | 166.1 |
| D | 12 | 218 | 280574 | 1685.09 | 668 | 647 | 166.1 |
| D | 2 | 120 | 201275 | 1207.73 | 668 | 647 | 166.1 |
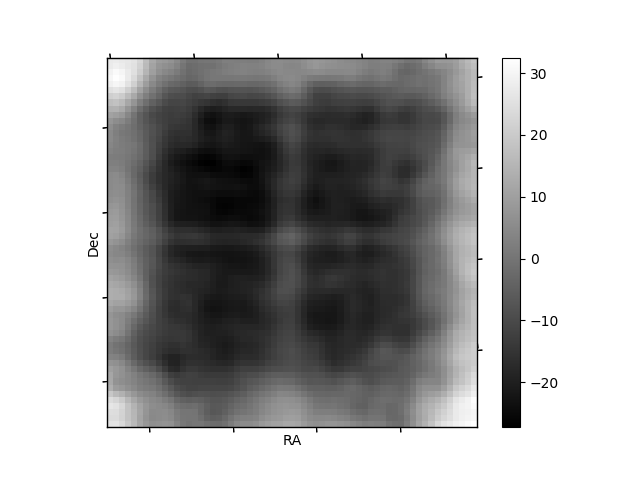
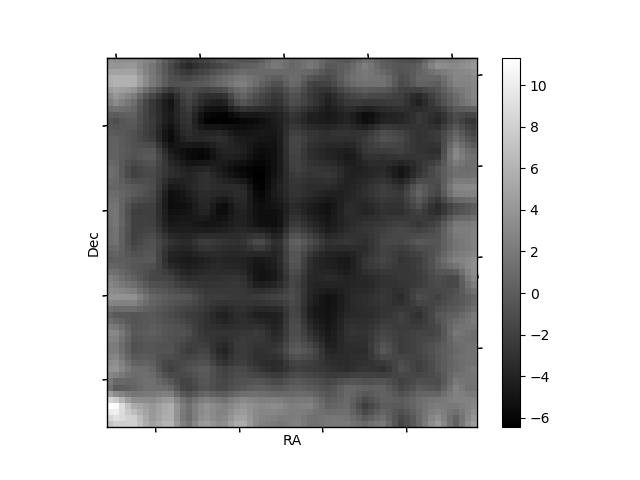
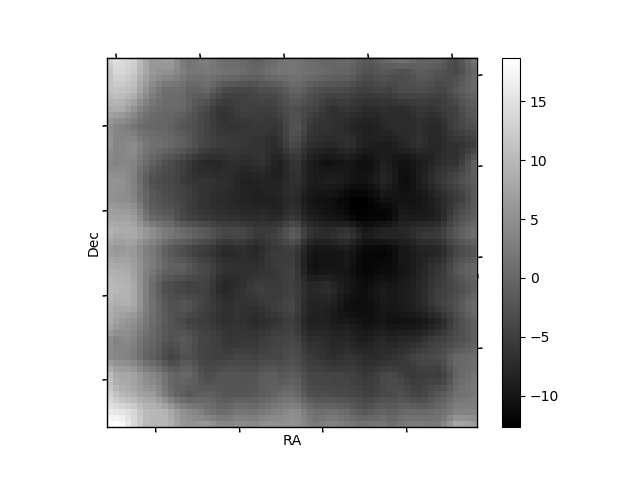
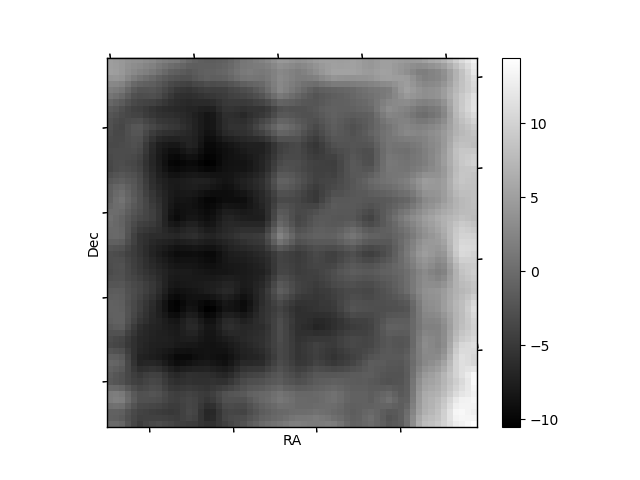
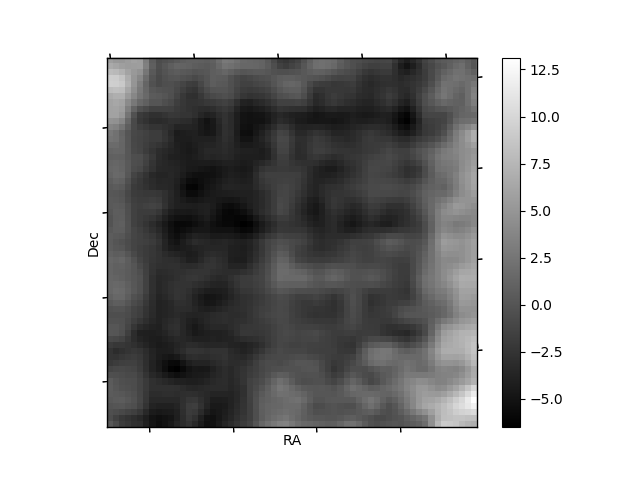
Histogram calculated using DETX and DETY for each event in the final _common_clean file
| Quadrant A | 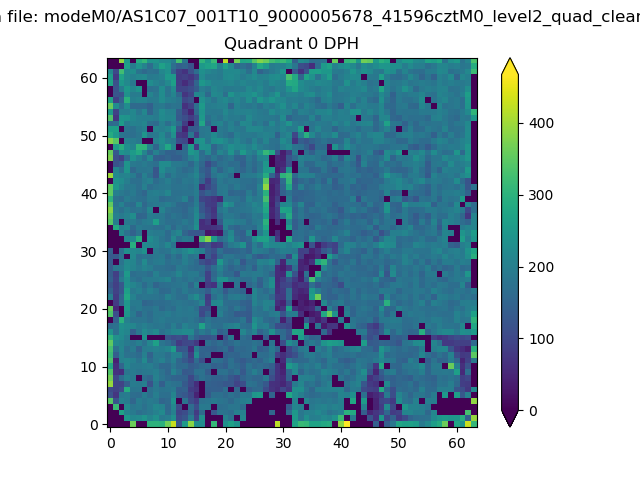 |
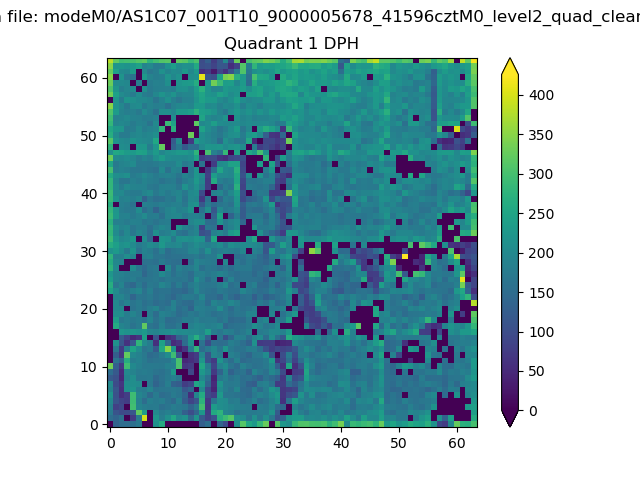 |
Quadrant B |
|---|---|---|---|
| Quadrant D | 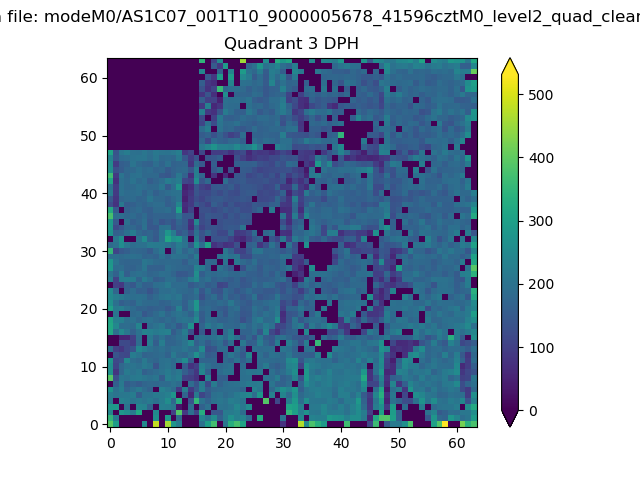 |
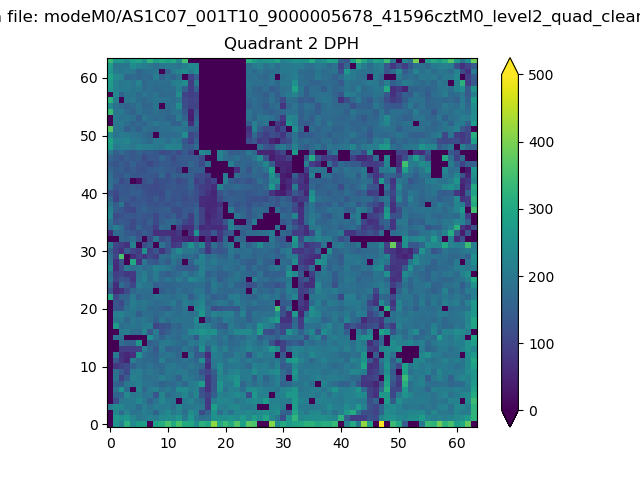 |
Quadrant C |
| Plot type | Count rate plots | Images |
|---|---|---|
| Comparison with Poisson distribution Blue bars denote a histogram of data divided into 1 sec bins. Red curve is a Poisson curve with rate = median count rate of data. |
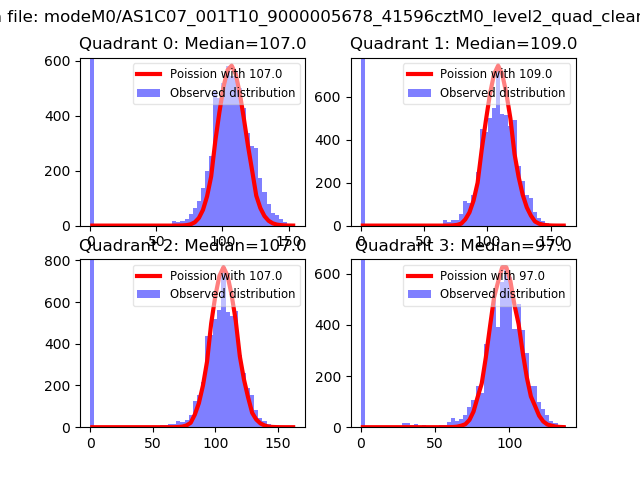 |
 |
| Quadrant-wise count rates Data is divided into 100 sec bins |
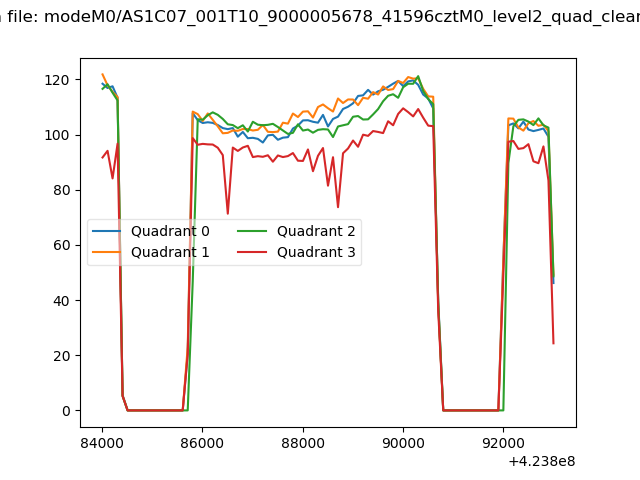 |
|
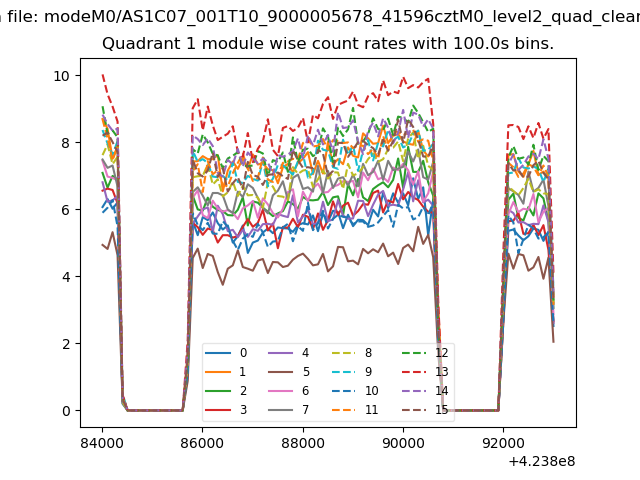
| Module-wise count rates for Quadrant A Data is divided into 100 sec bins |
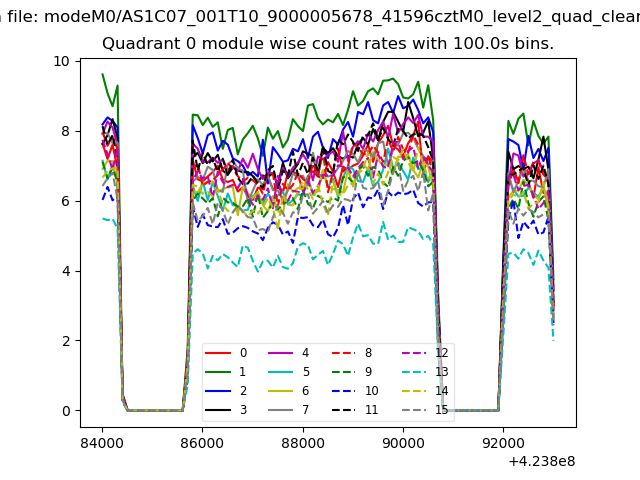 |
 |
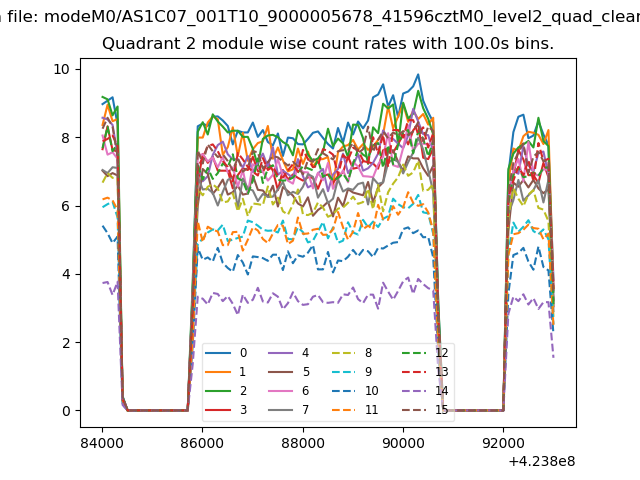
| Module-wise count rates for Quadrant B Data is divided into 100 sec bins |
 |
 |
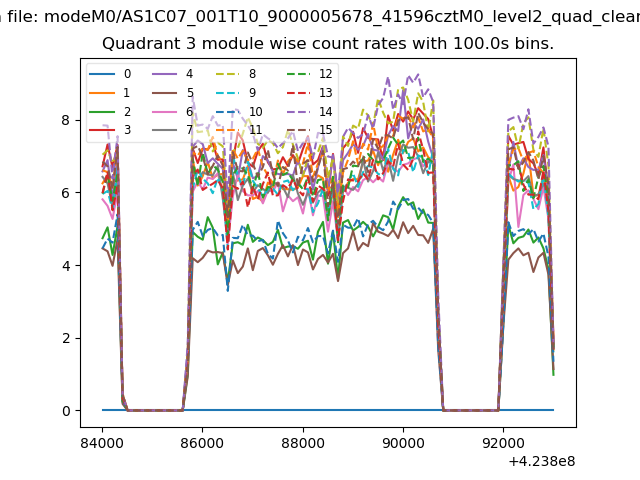
| Module-wise count rates for Quadrant C Data is divided into 100 sec bins |
 |
 |
| Module-wise count rates for Quadrant D Data is divided into 100 sec bins |
 |
 |
| Parameter | Plot |
|---|---|
| CZT HV Monitor | 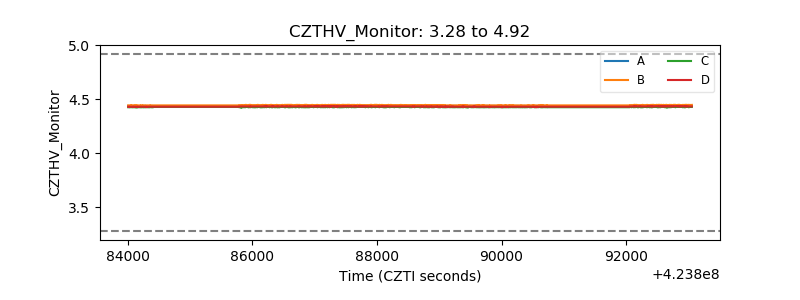 |
| D_VDD | 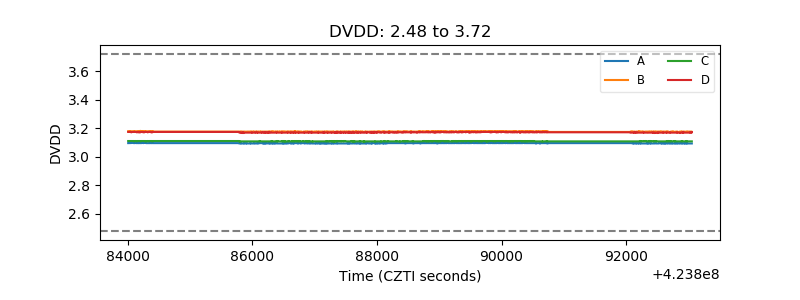 |
| Temperature 1 | 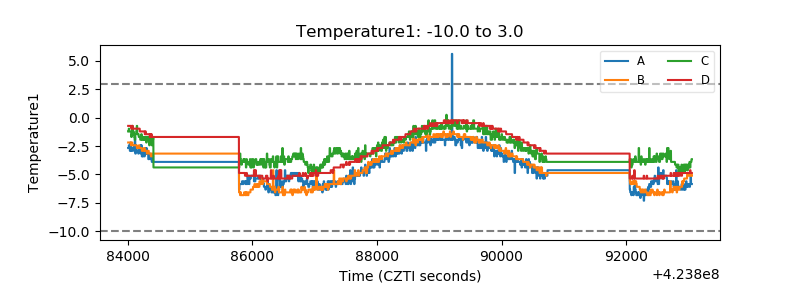 |
| Veto HV Monitor |  |
| Veto LLD | 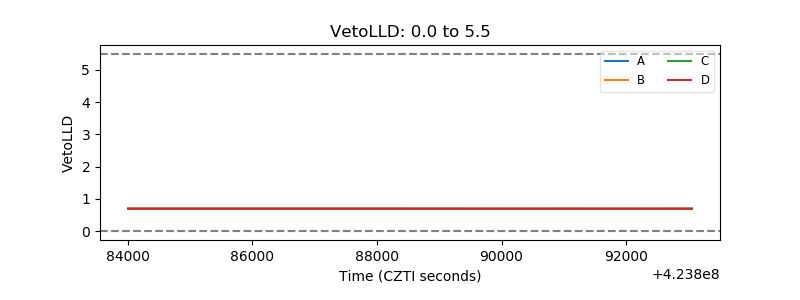 |
| Alpha Counter | 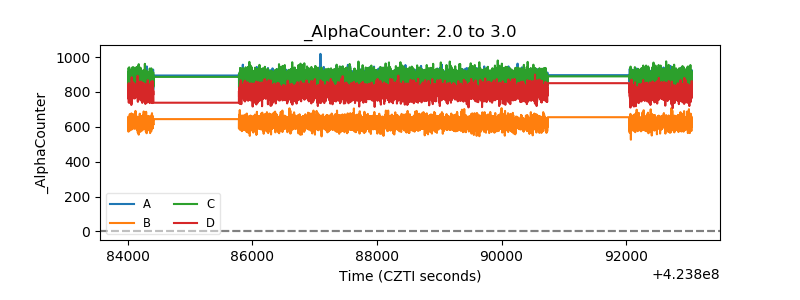 |
| _CPM_Rate | 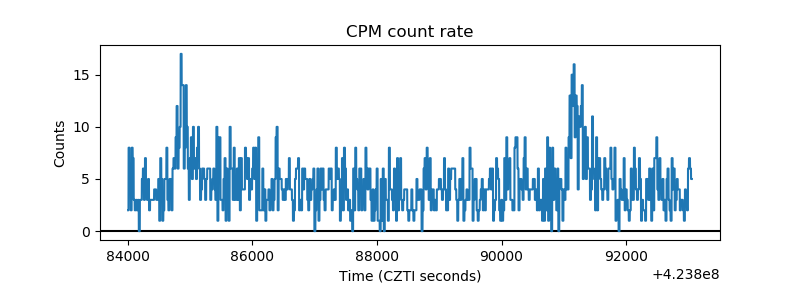 |
| CZT Counter | 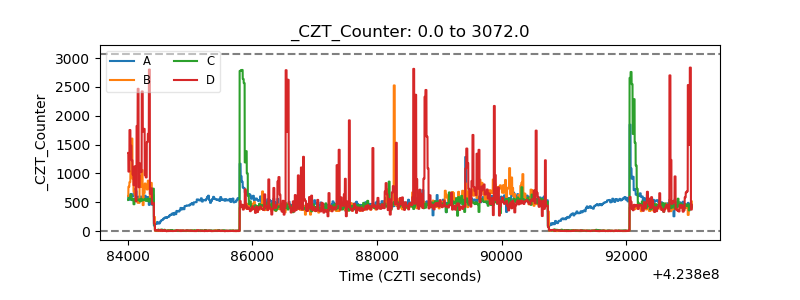 |
| +2.5 Volts monitor |  |
| +5 Volts monitor | 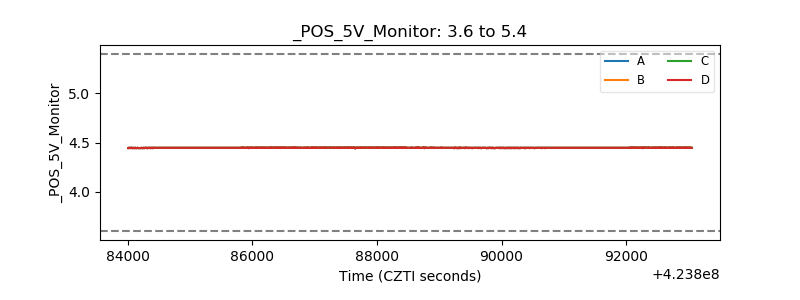 |
| _ROLL_ROT | 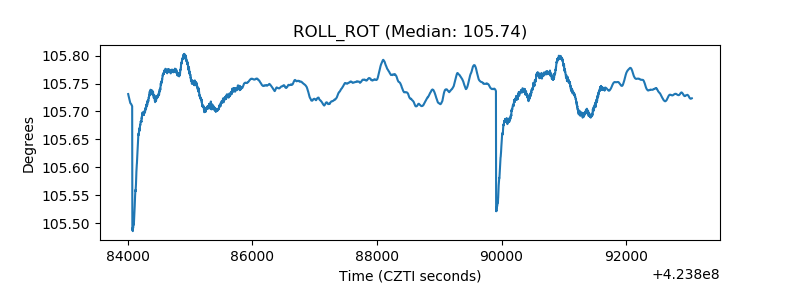 |
| _Roll_DEC | 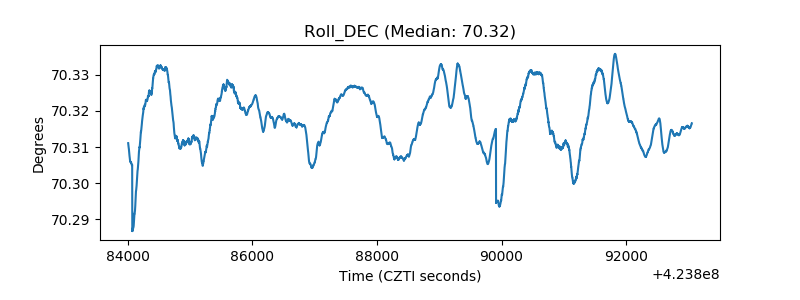 |
| _Roll_RA | 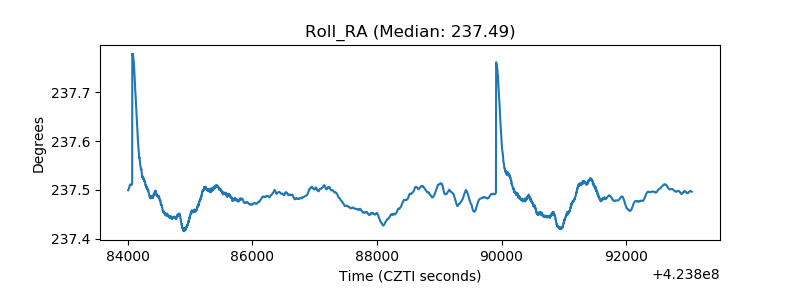 |
| Veto Counter | 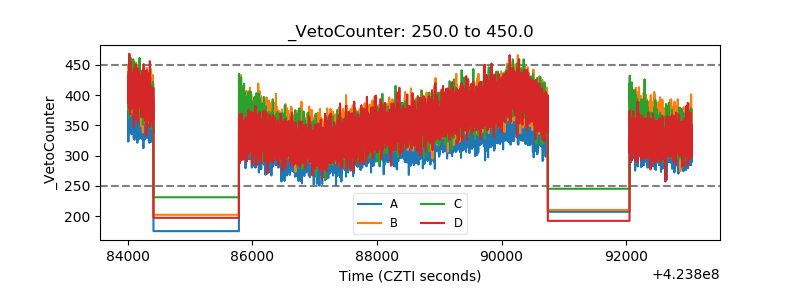 |