| Param | Original file | Final file |
|---|---|---|
| Filename | modeM0/AS1C07_001T10_9000005678_41599cztM0_level2.fits | modeM0/AS1C07_001T10_9000005678_41599cztM0_level2_quad_clean.evt |
| Size (bytes) | 1,221,284,160 | 233,758,080 |
| Size | 1.1 GB | 222.9 MB |
| Events in quadrant A | 8,290,779 | 1,650,856 |
| Events in quadrant B | 8,434,487 | 1,687,297 |
| Events in quadrant C | 17,380,378 | 1,243,072 |
| Events in quadrant D | 9,893,328 | 1,418,269 |
| Mode SS | |||
|---|---|---|---|
| Quadrant | BADHDUFLAG | Total packets | Discarded packets |
| A | 0 | 318 | 0 |
| B | 0 | 318 | 0 |
| C | 0 | 318 | 0 |
| D | 0 | 318 | 0 |
| Mode M0 | |||
|---|---|---|---|
| Quadrant | BADHDUFLAG | Total packets | Discarded packets |
| A | 0 | 33588 | 5 |
| B | 0 | 35811 | 4 |
| C | 0 | 61644 | 4 |
| D | 0 | 40573 | 4 |
| Mode M9 | |||
|---|---|---|---|
| Quadrant | BADHDUFLAG | Total packets | Discarded packets |
| A | 0 | 53 | 0 |
| B | 0 | 54 | 0 |
| C | 0 | 54 | 0 |
| D | 0 | 54 | 0 |
| Quadrant | Total seconds | Saturated seconds | Saturation percentage |
|---|---|---|---|
| A | 15617 | 32 | 0.204905% |
| B | 15617 | 130 | 0.832426% |
| C | 15617 | 3813 | 24.415701% |
| D | 15617 | 793 | 5.077800% |
Noise dominated data is calculated using 1-second bins in cleaned event files. If a bin has >2000 counts, and if more than 50% of those come from <1% of pixels, then it is considered to be noise-dominated and hence unusable.
| Quadrant | # 1 sec bins | Bins with >0 counts | Bins with >2000 counts | High rate bins dominated by noise | Noise dominated (total time) | Noise dominated (detector-on time) | Marked lightcurve |
|---|---|---|---|---|---|---|---|
| A | 19885 | 15620 | 5 | 5 | 0.03% | 0.03% | 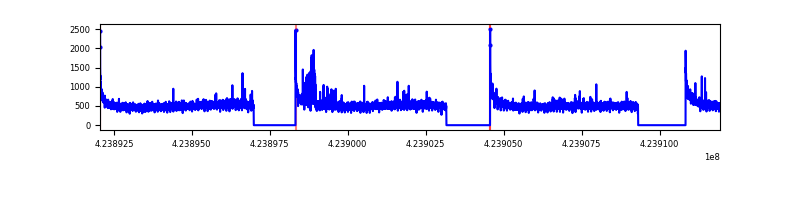 |
| B | 19885 | 15620 | 52 | 52 | 0.26% | 0.33% | 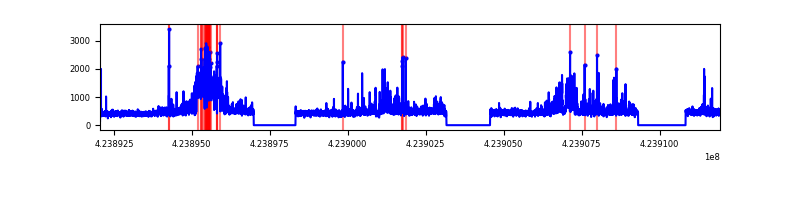 |
| C | 19885 | 15620 | 3800 | 3800 | 19.11% | 24.33% | 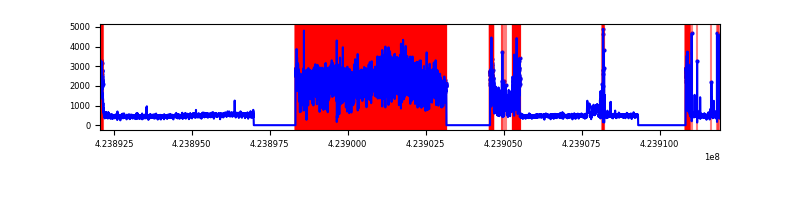 |
| D | 19885 | 15620 | 614 | 614 | 3.09% | 3.93% | 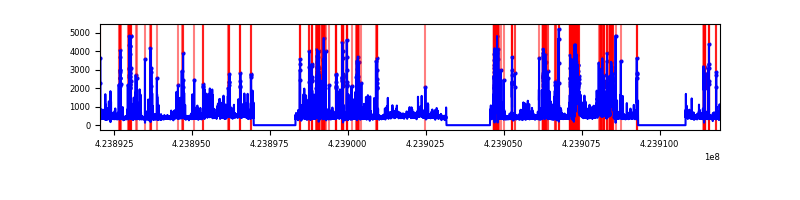 |
Top three noisy pixels from each quadrant. If the there are fewer than three noisy pixels in the level2.evt file, extra rows are filled as -1
| Pixel properties | Quadrant properties | ||||||
|---|---|---|---|---|---|---|---|
| Quadrant | DetID | PixID | Counts | Sigma | Mean | Median | Sigma |
| A | 10 | 83 | 1454860 | 4168.32 | 1704 | 1667 | 348.6 |
| A | 7 | 3 | 172982 | 491.4 | 1704 | 1667 | 348.6 |
| A | 13 | 6 | 29033 | 78.5 | 1704 | 1667 | 348.6 |
| B | 0 | 186 | 1077012 | 3306.14 | 1691 | 1641 | 325.3 |
| B | 0 | 190 | 264411 | 807.86 | 1691 | 1641 | 325.3 |
| B | 0 | 245 | 166244 | 506.06 | 1691 | 1641 | 325.3 |
| C | 0 | 15 | 9932874 | 28048.59 | 1529 | 1537 | 354.1 |
| C | 0 | 10 | 779126 | 2196.11 | 1529 | 1537 | 354.1 |
| C | 15 | 214 | 642499 | 1810.24 | 1529 | 1537 | 354.1 |
| D | 13 | 249 | 2282468 | 5737.0 | 1624 | 1576 | 397.6 |
| D | 2 | 120 | 457433 | 1146.59 | 1624 | 1576 | 397.6 |
| D | 12 | 6 | 253558 | 633.8 | 1624 | 1576 | 397.6 |
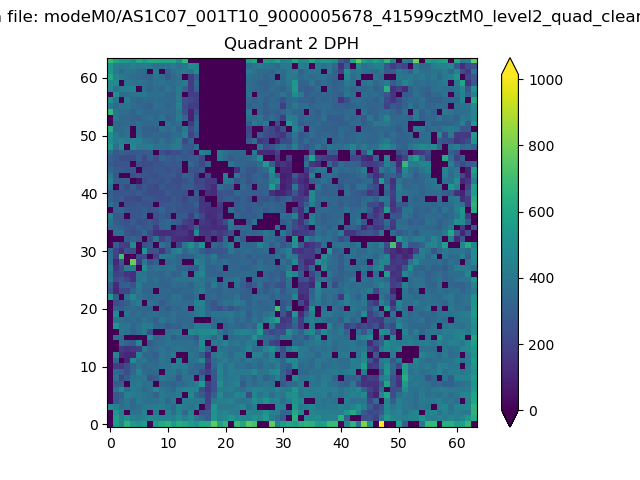
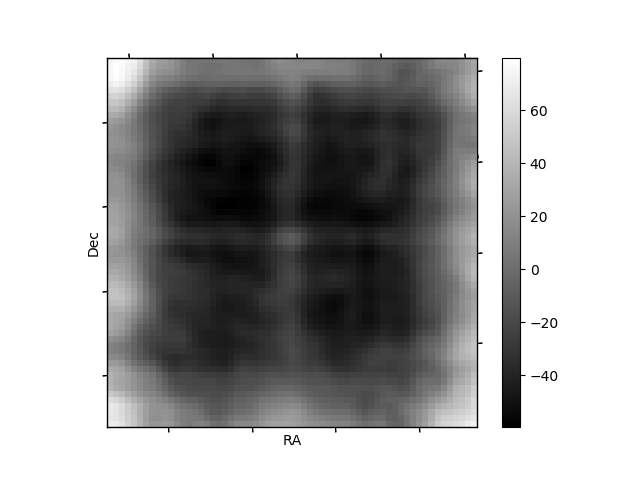
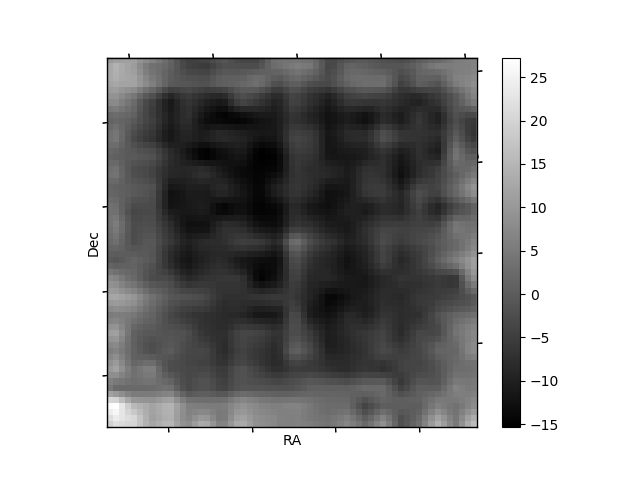
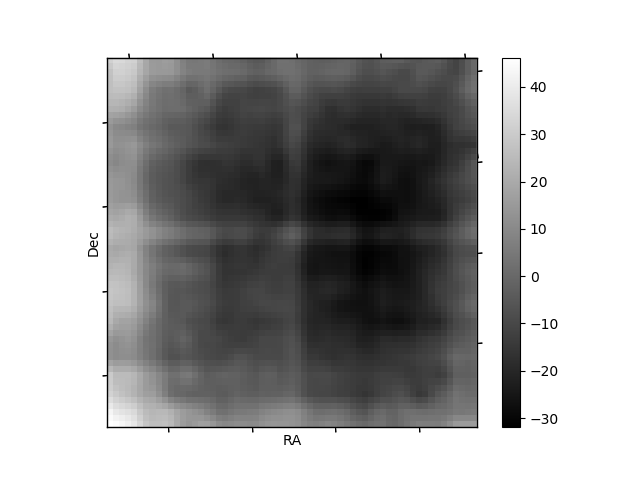
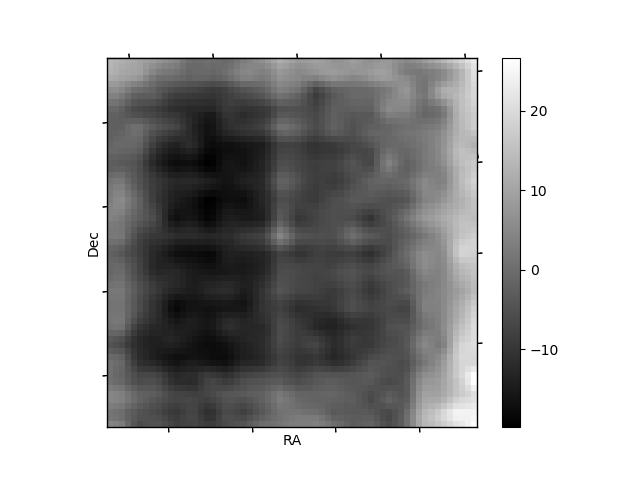
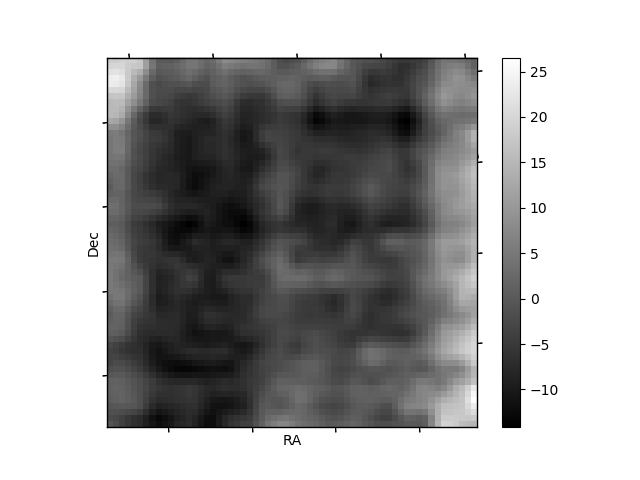
Histogram calculated using DETX and DETY for each event in the final _common_clean file
| Quadrant A | 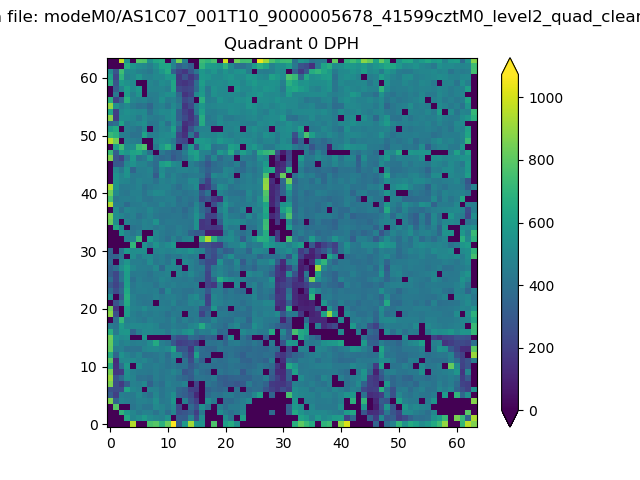 |
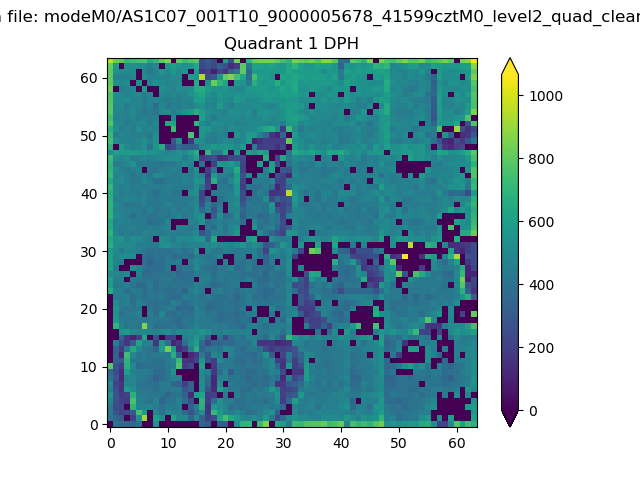 |
Quadrant B |
|---|---|---|---|
| Quadrant D | 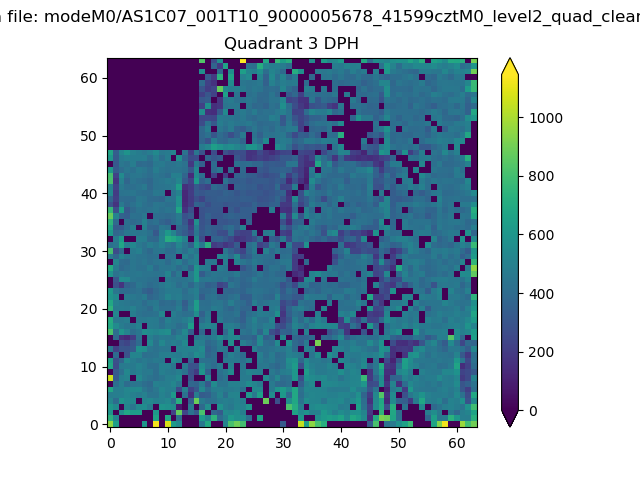 |
 |
Quadrant C |
| Plot type | Count rate plots | Images |
|---|---|---|
| Comparison with Poisson distribution Blue bars denote a histogram of data divided into 1 sec bins. Red curve is a Poisson curve with rate = median count rate of data. |
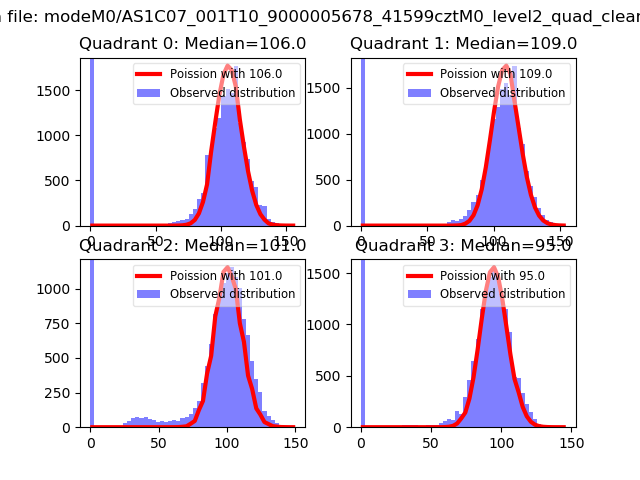 |
 |
| Quadrant-wise count rates Data is divided into 100 sec bins |
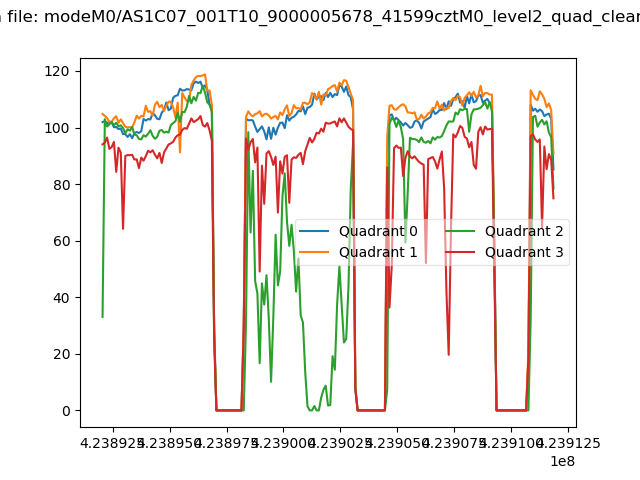 |
|
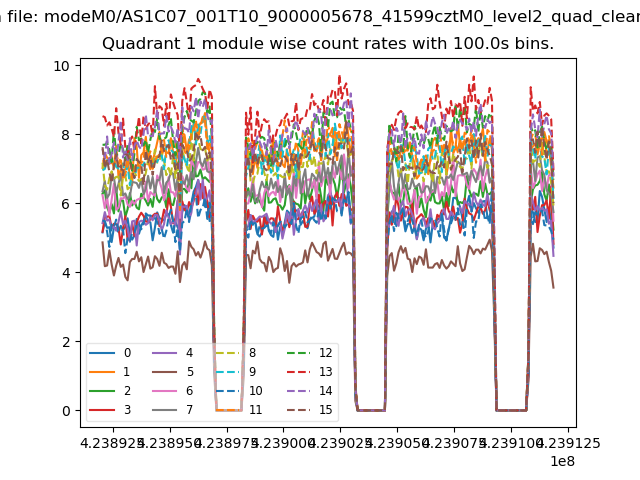
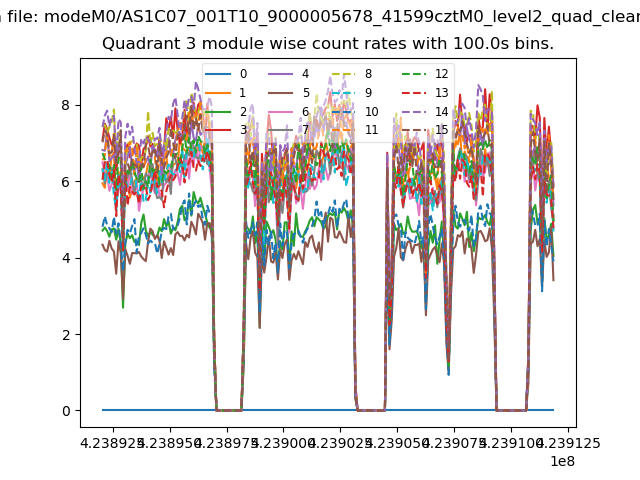
| Module-wise count rates for Quadrant A Data is divided into 100 sec bins |
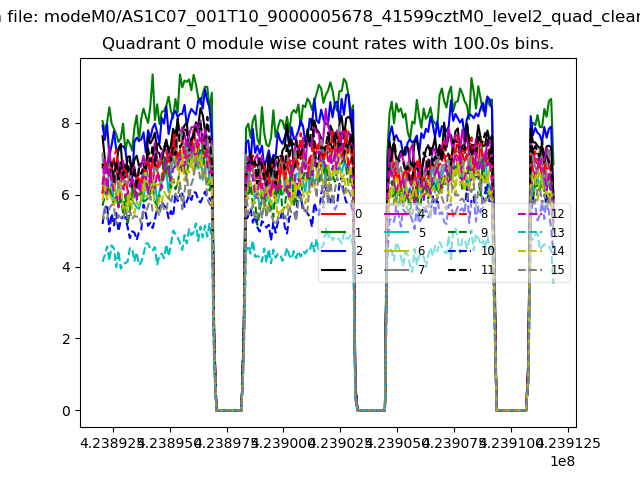 |
 |
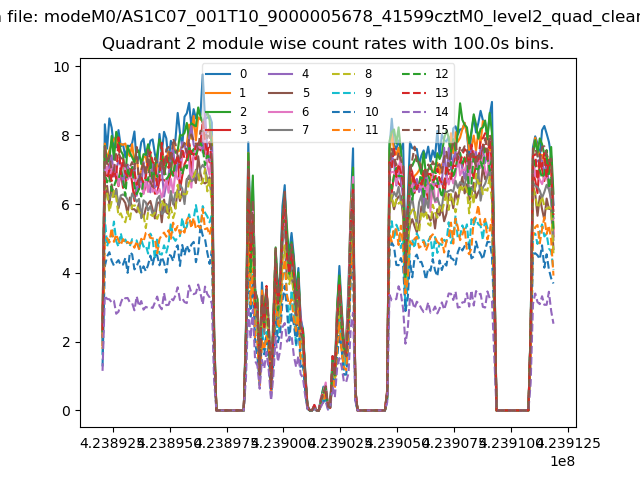
| Module-wise count rates for Quadrant B Data is divided into 100 sec bins |
 |
 |
| Module-wise count rates for Quadrant C Data is divided into 100 sec bins |
 |
 |
| Module-wise count rates for Quadrant D Data is divided into 100 sec bins |
 |
 |
| Parameter | Plot |
|---|---|
| CZT HV Monitor | 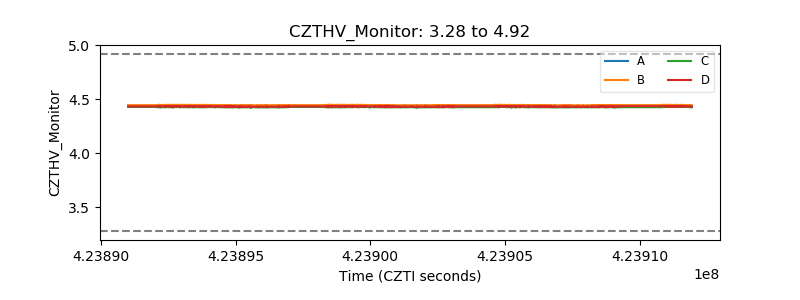 |
| D_VDD | 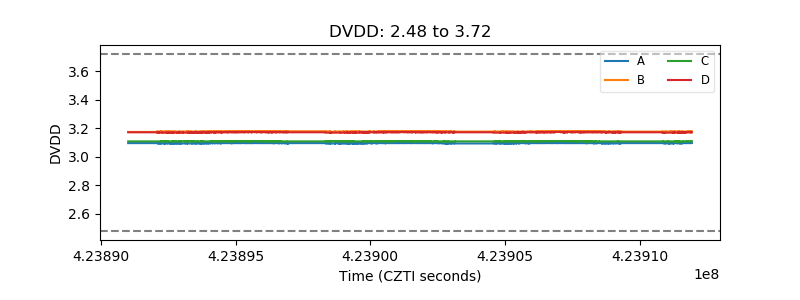 |
| Temperature 1 | 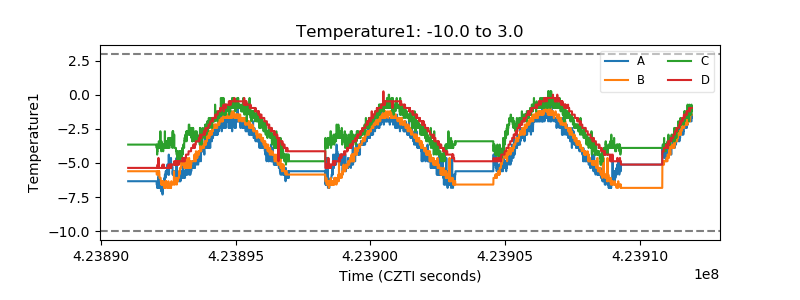 |
| Veto HV Monitor | 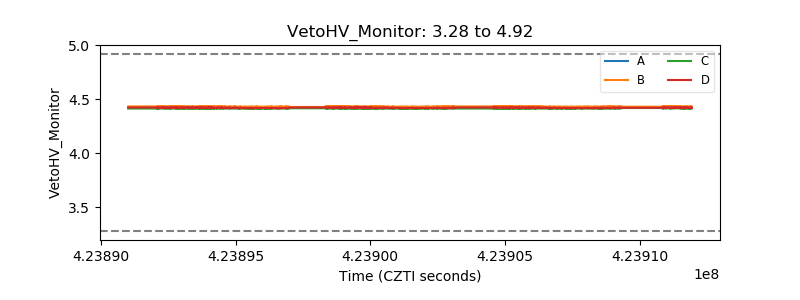 |
| Veto LLD | 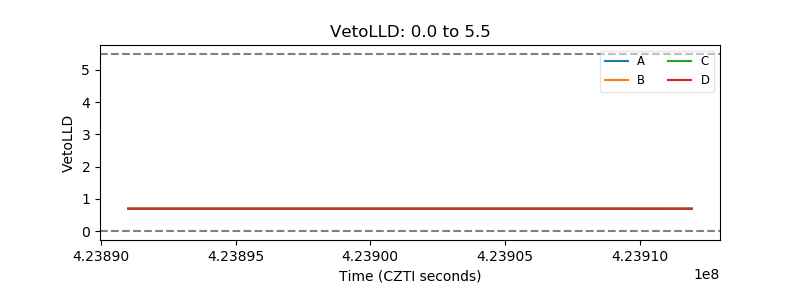 |
| Alpha Counter | 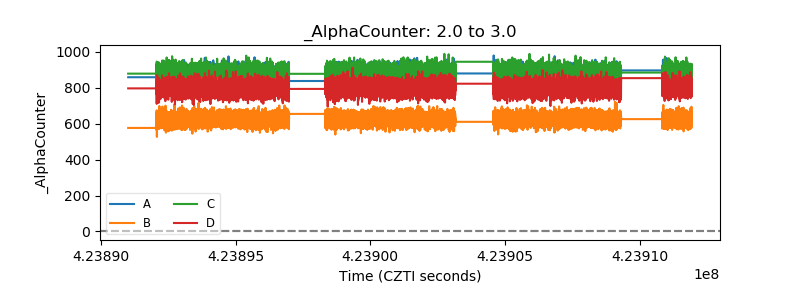 |
| _CPM_Rate | 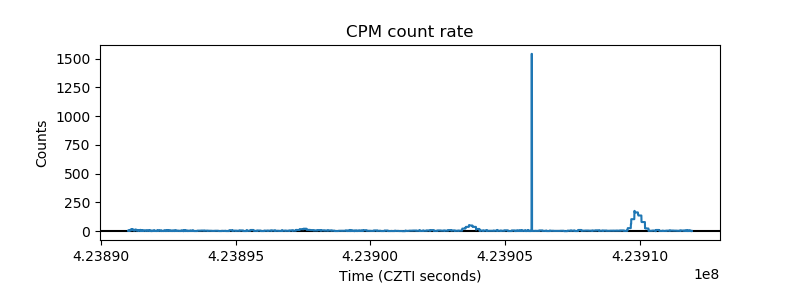 |
| CZT Counter | 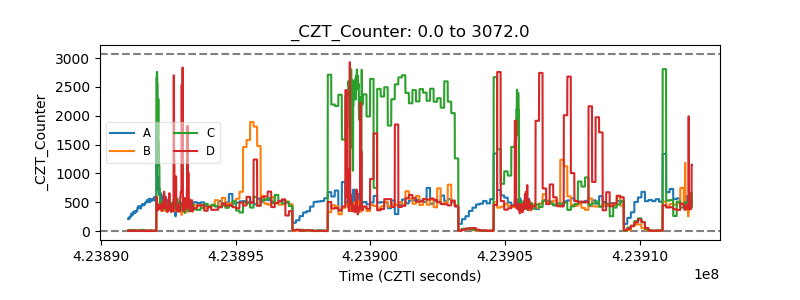 |
| +2.5 Volts monitor | 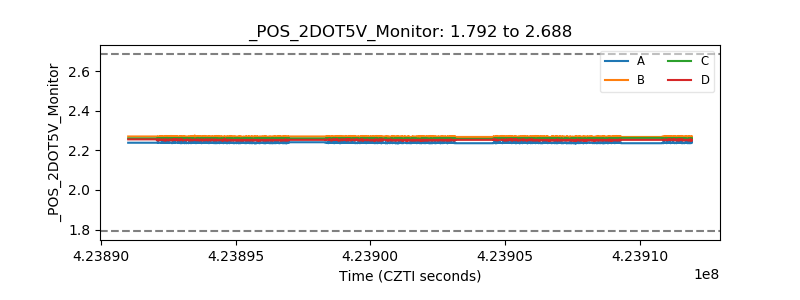 |
| +5 Volts monitor | 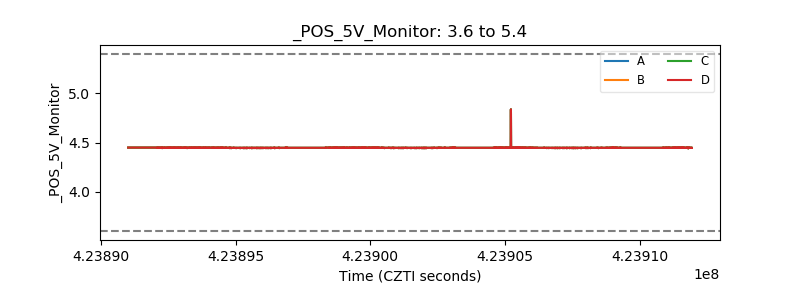 |
| _ROLL_ROT | 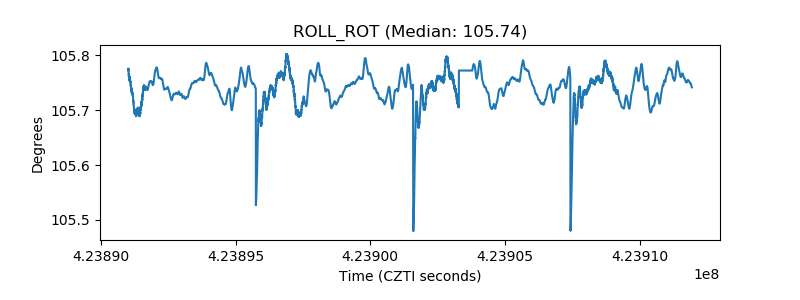 |
| _Roll_DEC | 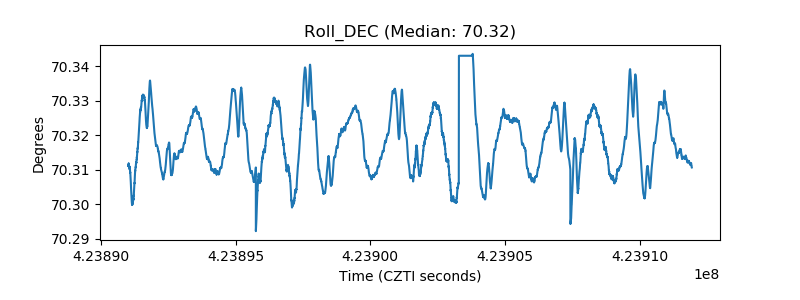 |
| _Roll_RA | 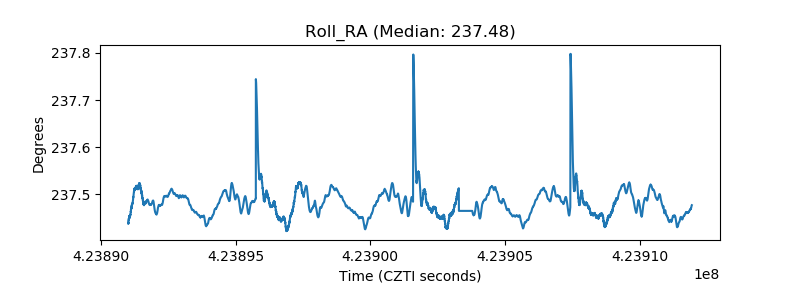 |
| Veto Counter | 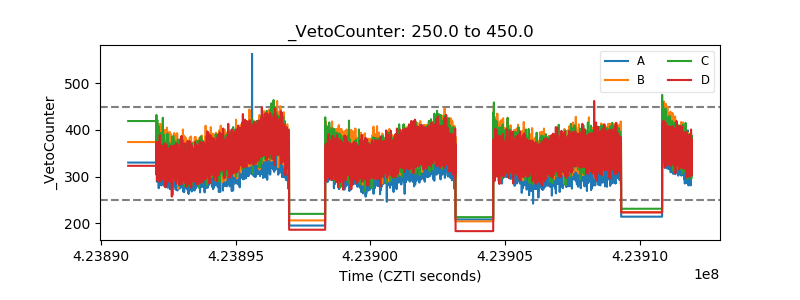 |