| Param | Original file | Final file |
|---|---|---|
| Filename | modeM0/AS1A12_035T02_9000005680_41602cztM0_level2.fits | modeM0/AS1A12_035T02_9000005680_41602cztM0_level2_quad_clean.evt |
| Size (bytes) | 359,830,080 | 90,527,040 |
| Size | 343.2 MB | 86.3 MB |
| Events in quadrant A | 2,975,528 | 619,684 |
| Events in quadrant B | 2,725,828 | 628,802 |
| Events in quadrant C | 3,523,514 | 581,482 |
| Events in quadrant D | 3,671,371 | 530,117 |
| Mode SS | |||
|---|---|---|---|
| Quadrant | BADHDUFLAG | Total packets | Discarded packets |
| A | 0 | 112 | 0 |
| B | 0 | 112 | 0 |
| C | 0 | 112 | 0 |
| D | 0 | 112 | 0 |
| Mode M0 | |||
|---|---|---|---|
| Quadrant | BADHDUFLAG | Total packets | Discarded packets |
| A | 0 | 12008 | 2 |
| B | 0 | 11599 | 2 |
| C | 0 | 13950 | 2 |
| D | 0 | 14666 | 3 |
| Mode M9 | |||
|---|---|---|---|
| Quadrant | BADHDUFLAG | Total packets | Discarded packets |
| A | 0 | 19 | 0 |
| B | 0 | 19 | 0 |
| C | 0 | 20 | 0 |
| D | 0 | 20 | 0 |
| Quadrant | Total seconds | Saturated seconds | Saturation percentage |
|---|---|---|---|
| A | 5439 | 18 | 0.330943% |
| B | 5439 | 22 | 0.404486% |
| C | 5439 | 223 | 4.100018% |
| D | 5438 | 362 | 6.656859% |
Noise dominated data is calculated using 1-second bins in cleaned event files. If a bin has >2000 counts, and if more than 50% of those come from <1% of pixels, then it is considered to be noise-dominated and hence unusable.
| Quadrant | # 1 sec bins | Bins with >0 counts | Bins with >2000 counts | High rate bins dominated by noise | Noise dominated (total time) | Noise dominated (detector-on time) | Marked lightcurve |
|---|---|---|---|---|---|---|---|
| A | 7232 | 5440 | 4 | 4 | 0.06% | 0.07% | 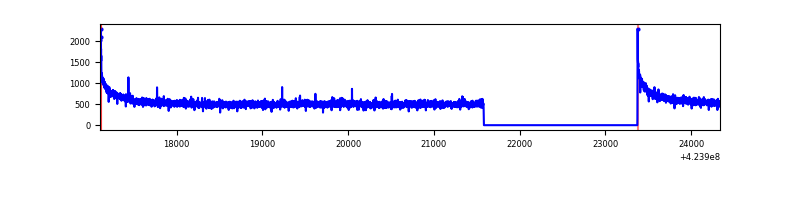 |
| B | 7232 | 5440 | 8 | 8 | 0.11% | 0.15% | 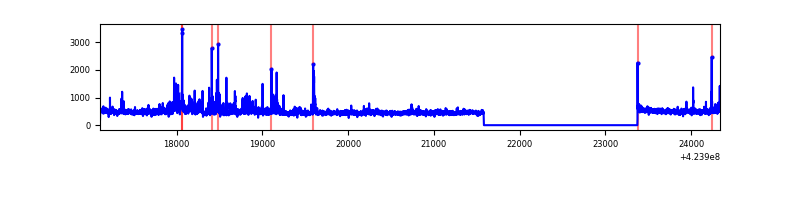 |
| C | 7232 | 5440 | 218 | 218 | 3.01% | 4.01% | 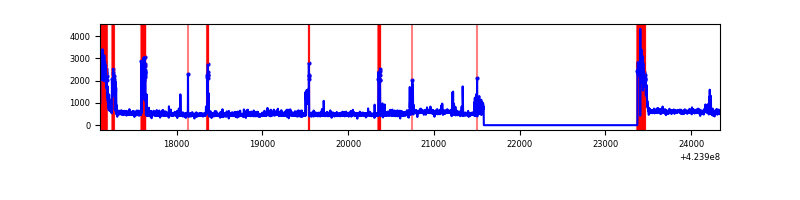 |
| D | 7231 | 5439 | 267 | 267 | 3.69% | 4.91% | 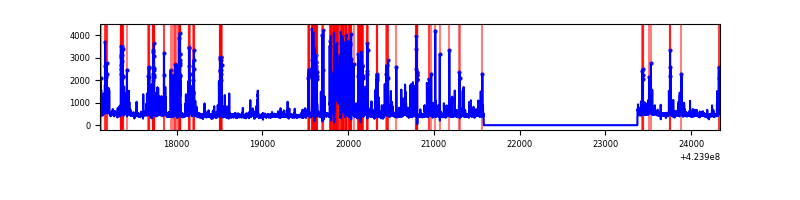 |
Top three noisy pixels from each quadrant. If the there are fewer than three noisy pixels in the level2.evt file, extra rows are filled as -1
| Pixel properties | Quadrant properties | ||||||
|---|---|---|---|---|---|---|---|
| Quadrant | DetID | PixID | Counts | Sigma | Mean | Median | Sigma |
| A | 10 | 83 | 575259 | 4551.05 | 614 | 600 | 126.3 |
| A | 13 | 254 | 8190 | 60.11 | 614 | 600 | 126.3 |
| A | 7 | 3 | 8066 | 59.13 | 614 | 600 | 126.3 |
| B | 0 | 245 | 129122 | 1100.7 | 607 | 591 | 116.8 |
| B | 0 | 186 | 118690 | 1011.37 | 607 | 591 | 116.8 |
| B | 15 | 85 | 26256 | 219.79 | 607 | 591 | 116.8 |
| C | 0 | 15 | 514735 | 3814.84 | 581 | 586 | 134.8 |
| C | 0 | 10 | 465998 | 3453.23 | 581 | 586 | 134.8 |
| C | 15 | 214 | 235473 | 1742.8 | 581 | 586 | 134.8 |
| D | 13 | 249 | 983848 | 6824.18 | 581 | 562 | 144.1 |
| D | 1 | 47 | 172912 | 1196.14 | 581 | 562 | 144.1 |
| D | 12 | 218 | 82372 | 567.78 | 581 | 562 | 144.1 |
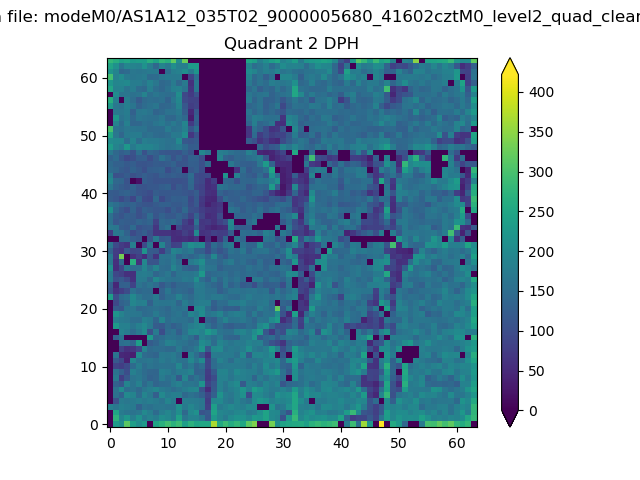
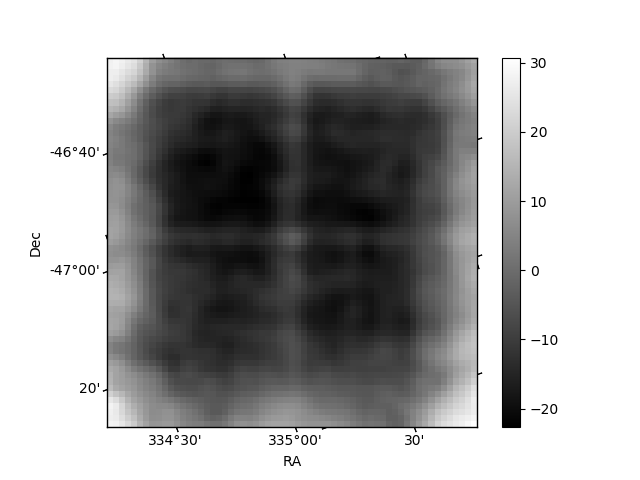
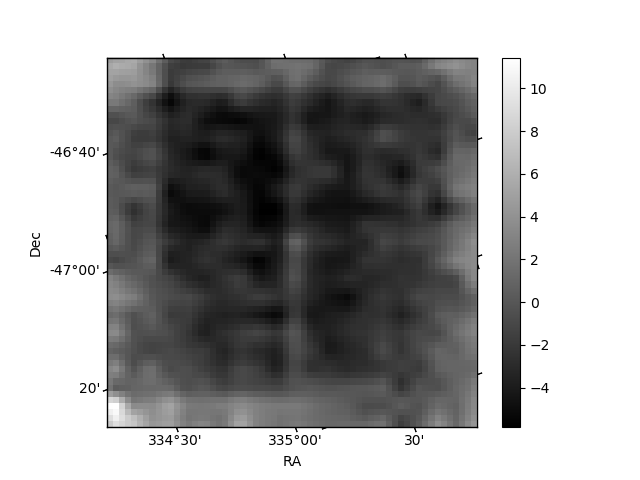
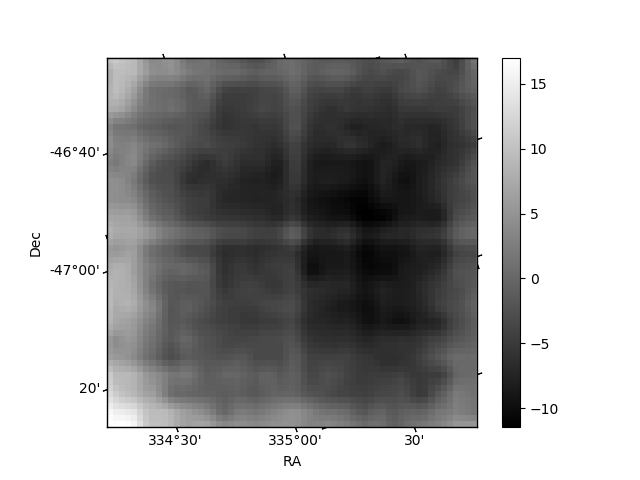
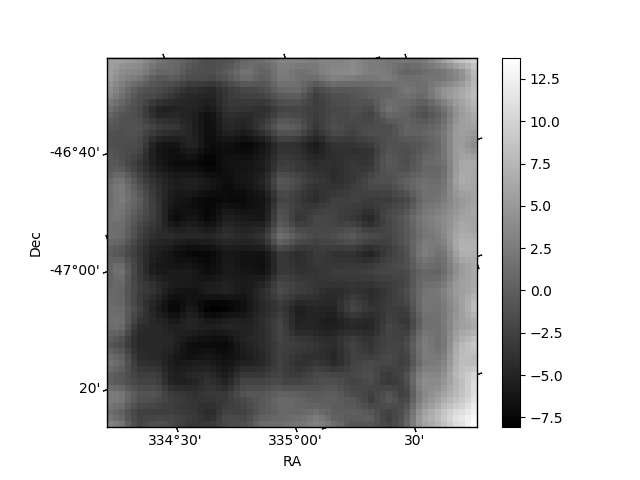
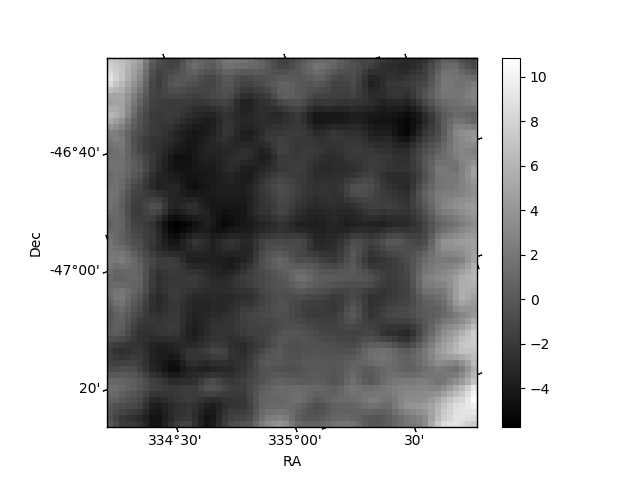
Histogram calculated using DETX and DETY for each event in the final _common_clean file
| Quadrant A | 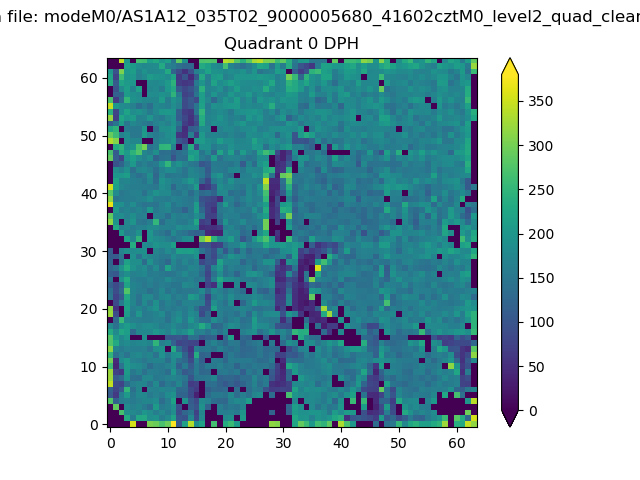 |
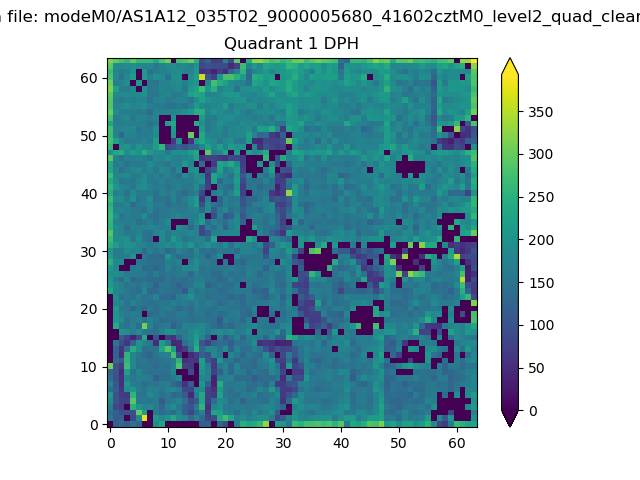 |
Quadrant B |
|---|---|---|---|
| Quadrant D | 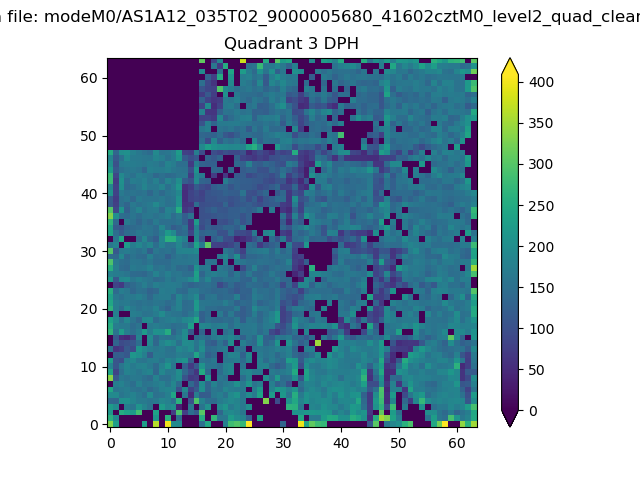 |
 |
Quadrant C |
| Plot type | Count rate plots | Images |
|---|---|---|
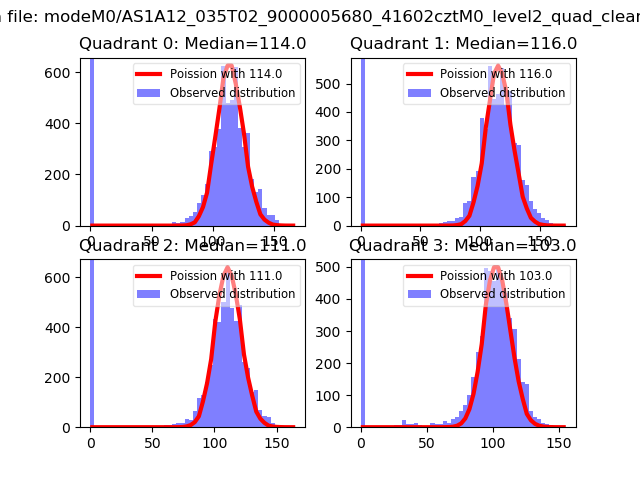
| Comparison with Poisson distribution Blue bars denote a histogram of data divided into 1 sec bins. Red curve is a Poisson curve with rate = median count rate of data. |
 |
 |
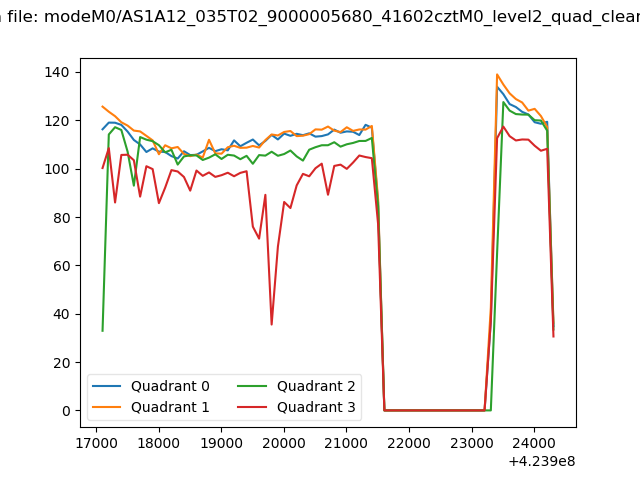
| Quadrant-wise count rates Data is divided into 100 sec bins |
 |
|
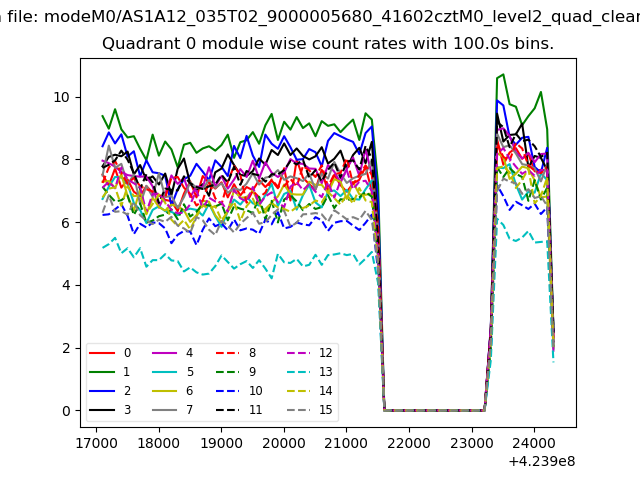
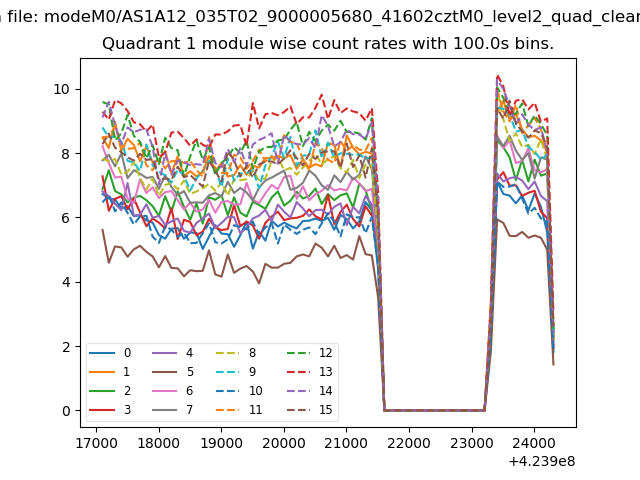
| Module-wise count rates for Quadrant A Data is divided into 100 sec bins |
 |
 |
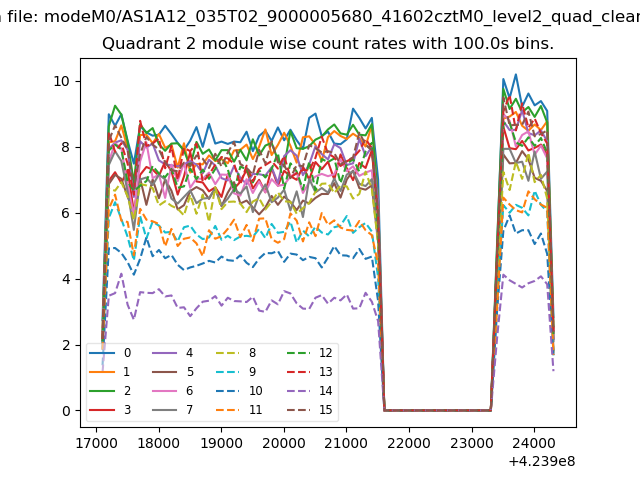
| Module-wise count rates for Quadrant B Data is divided into 100 sec bins |
 |
 |
| Module-wise count rates for Quadrant C Data is divided into 100 sec bins |
 |
 |
| Module-wise count rates for Quadrant D Data is divided into 100 sec bins |
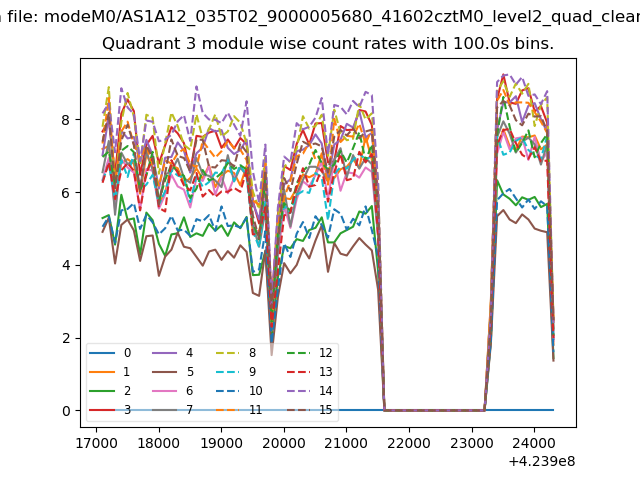 |
 |
| Parameter | Plot |
|---|---|
| CZT HV Monitor | 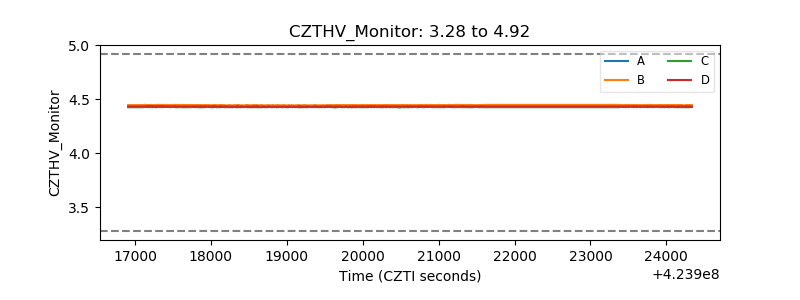 |
| D_VDD | 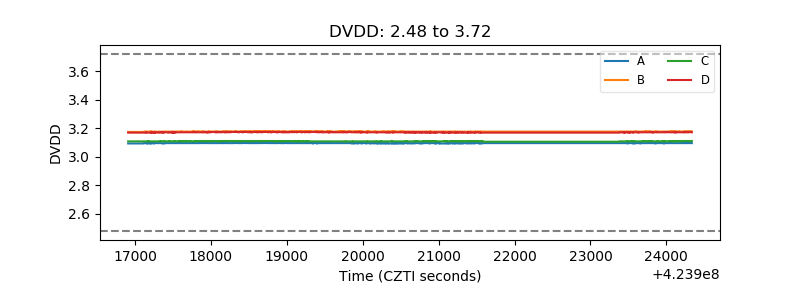 |
| Temperature 1 | 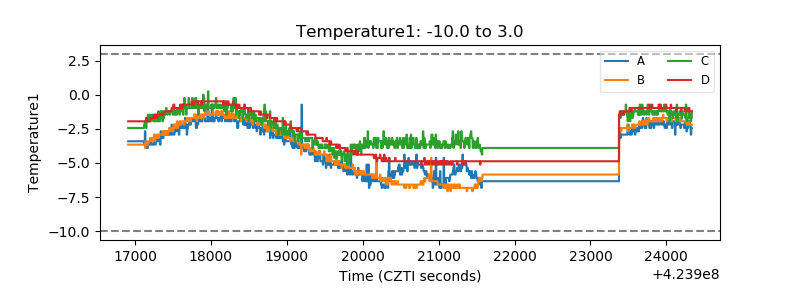 |
| Veto HV Monitor | 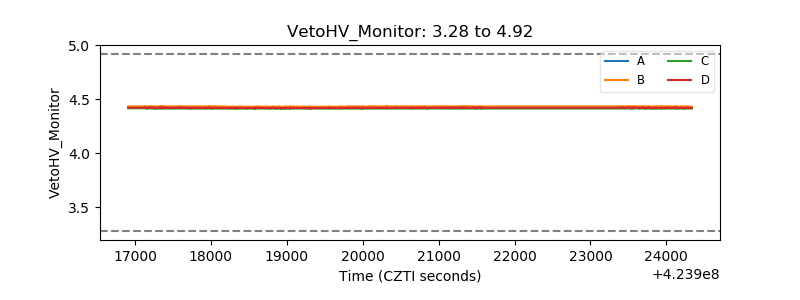 |
| Veto LLD | 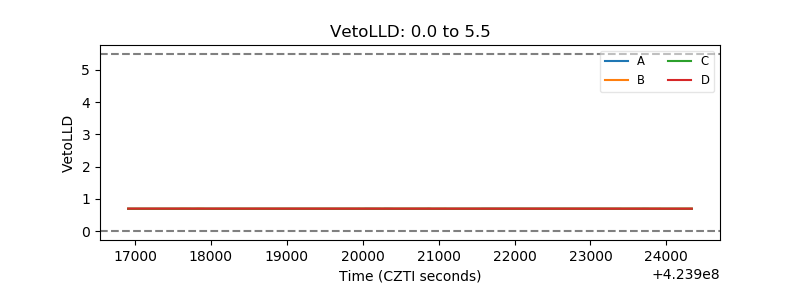 |
| Alpha Counter | 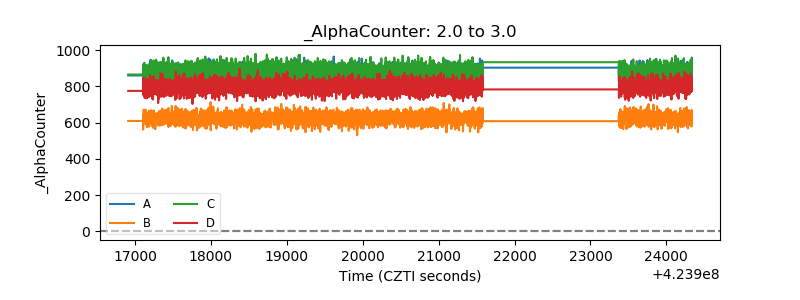 |
| _CPM_Rate | 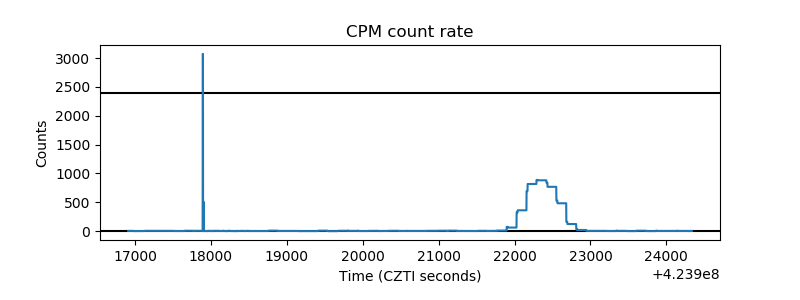 |
| CZT Counter | 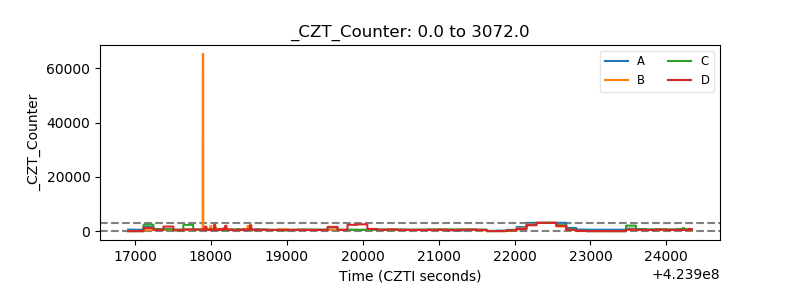 |
| +2.5 Volts monitor |  |
| +5 Volts monitor | 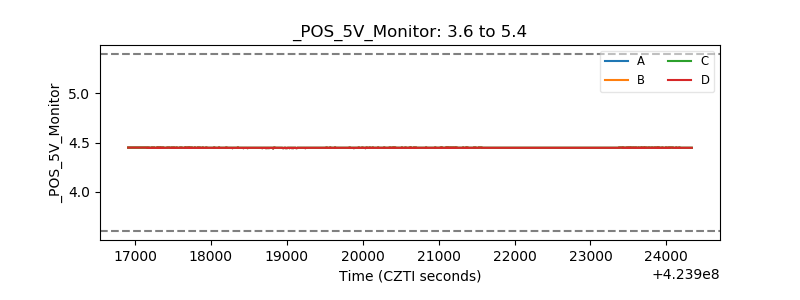 |
| _ROLL_ROT | 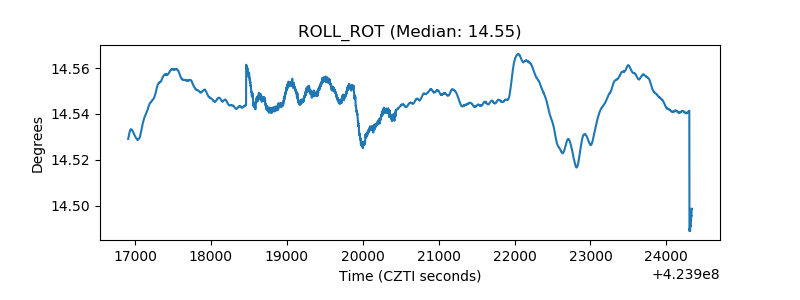 |
| _Roll_DEC | 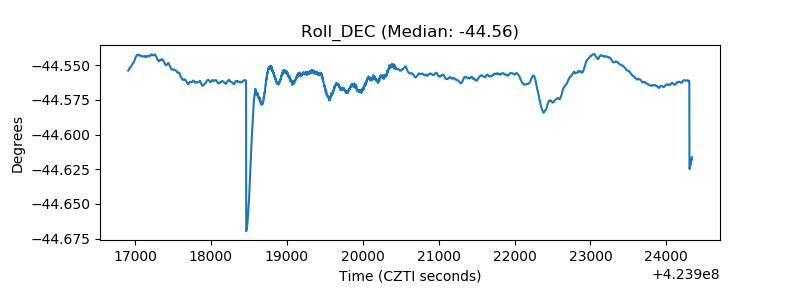 |
| _Roll_RA | 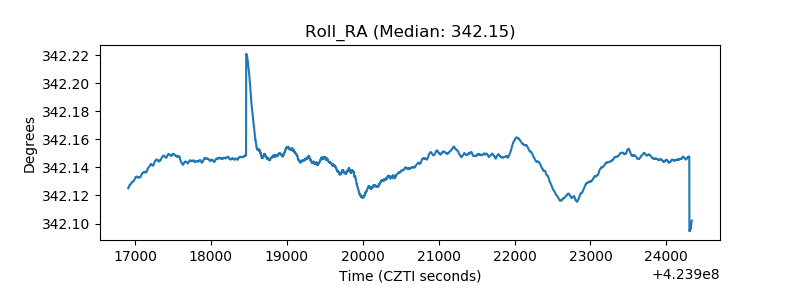 |
| Veto Counter | 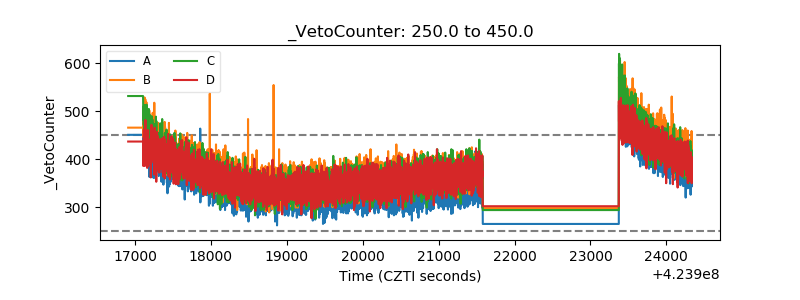 |