| Param | Original file | Final file |
|---|---|---|
| Filename | modeM0/AS1A12_035T02_9000005680_41603cztM0_level2.fits | modeM0/AS1A12_035T02_9000005680_41603cztM0_level2_quad_clean.evt |
| Size (bytes) | 344,808,000 | 93,003,840 |
| Size | 328.8 MB | 88.7 MB |
| Events in quadrant A | 2,976,227 | 638,631 |
| Events in quadrant B | 2,552,398 | 652,360 |
| Events in quadrant C | 3,659,147 | 591,438 |
| Events in quadrant D | 3,165,123 | 564,514 |
| Mode SS | |||
|---|---|---|---|
| Quadrant | BADHDUFLAG | Total packets | Discarded packets |
| A | 0 | 108 | 0 |
| B | 0 | 108 | 0 |
| C | 0 | 108 | 0 |
| D | 0 | 108 | 0 |
| Mode M0 | |||
|---|---|---|---|
| Quadrant | BADHDUFLAG | Total packets | Discarded packets |
| A | 0 | 12019 | 2 |
| B | 0 | 10965 | 2 |
| C | 0 | 14363 | 2 |
| D | 0 | 13039 | 2 |
| Mode M9 | |||
|---|---|---|---|
| Quadrant | BADHDUFLAG | Total packets | Discarded packets |
| A | 0 | 27 | 0 |
| B | 0 | 27 | 0 |
| C | 0 | 28 | 0 |
| D | 0 | 28 | 0 |
| Quadrant | Total seconds | Saturated seconds | Saturation percentage |
|---|---|---|---|
| A | 5274 | 22 | 0.417141% |
| B | 5274 | 16 | 0.303375% |
| C | 5274 | 218 | 4.133485% |
| D | 5274 | 156 | 2.957907% |
Noise dominated data is calculated using 1-second bins in cleaned event files. If a bin has >2000 counts, and if more than 50% of those come from <1% of pixels, then it is considered to be noise-dominated and hence unusable.
| Quadrant | # 1 sec bins | Bins with >0 counts | Bins with >2000 counts | High rate bins dominated by noise | Noise dominated (total time) | Noise dominated (detector-on time) | Marked lightcurve |
|---|---|---|---|---|---|---|---|
| A | 7156 | 5275 | 5 | 5 | 0.07% | 0.09% | 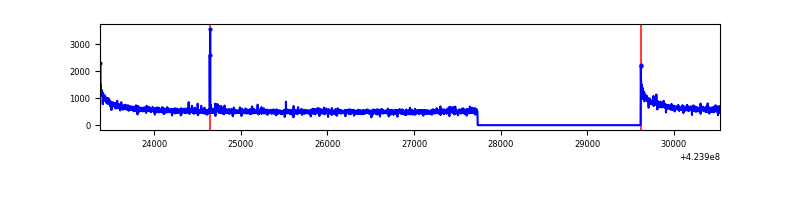 |
| B | 7156 | 5275 | 4 | 4 | 0.06% | 0.08% | 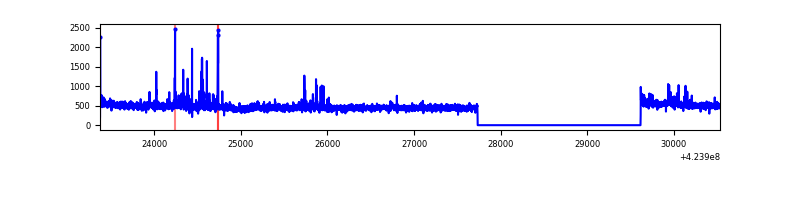 |
| C | 7156 | 5275 | 203 | 203 | 2.84% | 3.85% | 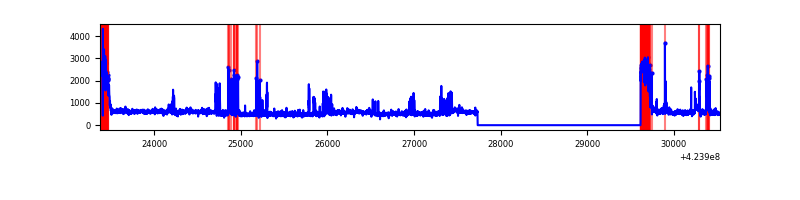 |
| D | 7156 | 5275 | 124 | 124 | 1.73% | 2.35% | 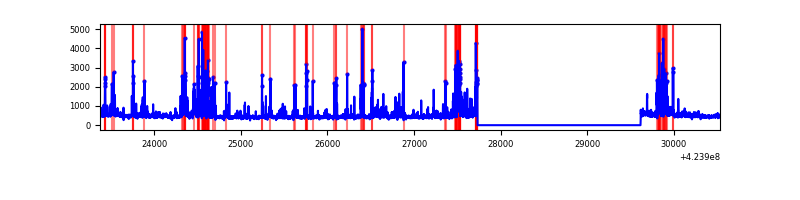 |
Top three noisy pixels from each quadrant. If the there are fewer than three noisy pixels in the level2.evt file, extra rows are filled as -1
| Pixel properties | Quadrant properties | ||||||
|---|---|---|---|---|---|---|---|
| Quadrant | DetID | PixID | Counts | Sigma | Mean | Median | Sigma |
| A | 10 | 83 | 557565 | 4385.85 | 616 | 603 | 127.0 |
| A | 2 | 79 | 17658 | 134.3 | 616 | 603 | 127.0 |
| A | 13 | 248 | 10345 | 76.71 | 616 | 603 | 127.0 |
| B | 0 | 245 | 59033 | 505.46 | 608 | 591 | 115.6 |
| B | 0 | 186 | 47099 | 402.24 | 608 | 591 | 115.6 |
| B | 5 | 255 | 22928 | 193.19 | 608 | 591 | 115.6 |
| C | 0 | 15 | 671740 | 5019.76 | 576 | 580 | 133.7 |
| C | 0 | 10 | 511121 | 3818.45 | 576 | 580 | 133.7 |
| C | 15 | 214 | 227417 | 1696.57 | 576 | 580 | 133.7 |
| D | 13 | 249 | 336827 | 2325.68 | 591 | 576 | 144.6 |
| D | 12 | 218 | 232872 | 1606.68 | 591 | 576 | 144.6 |
| D | 1 | 47 | 184945 | 1275.19 | 591 | 576 | 144.6 |
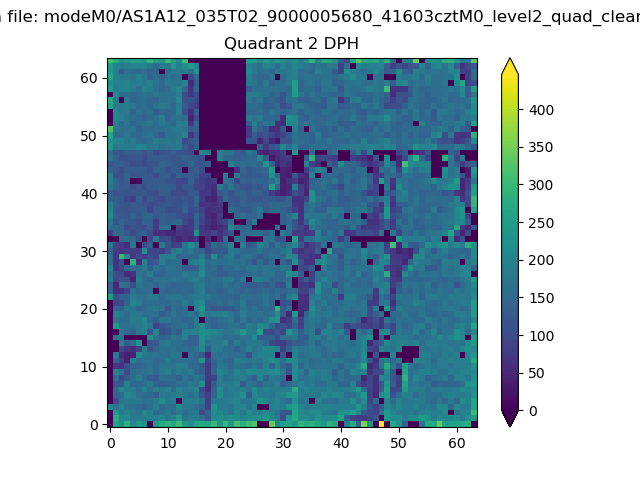
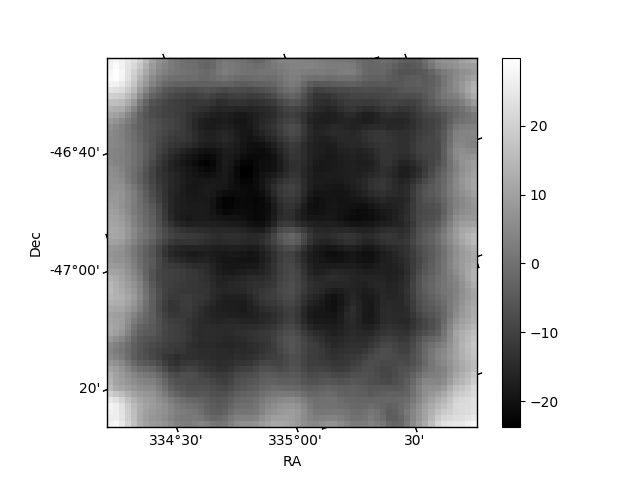
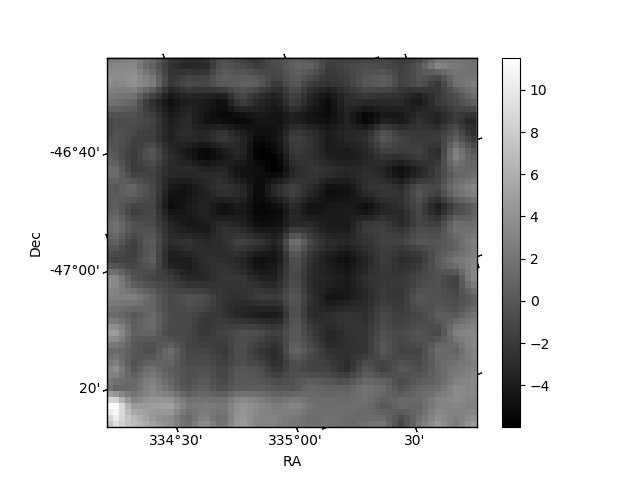
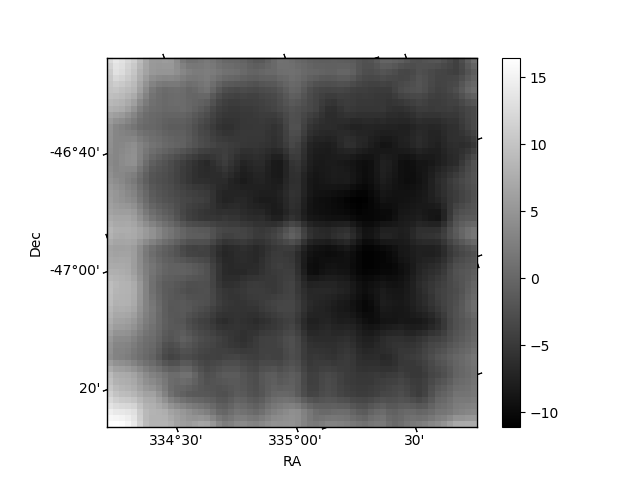
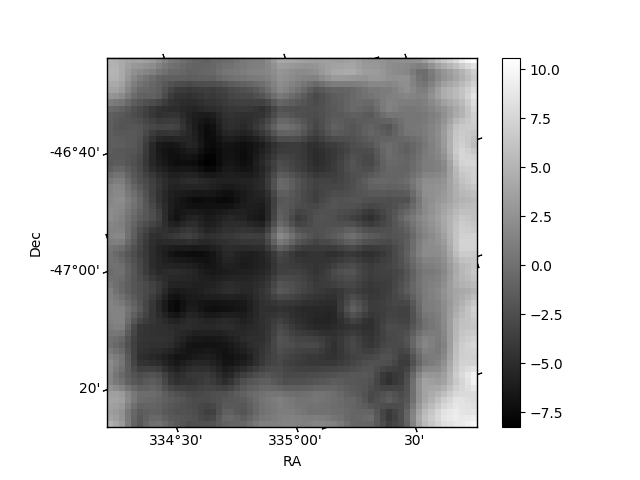
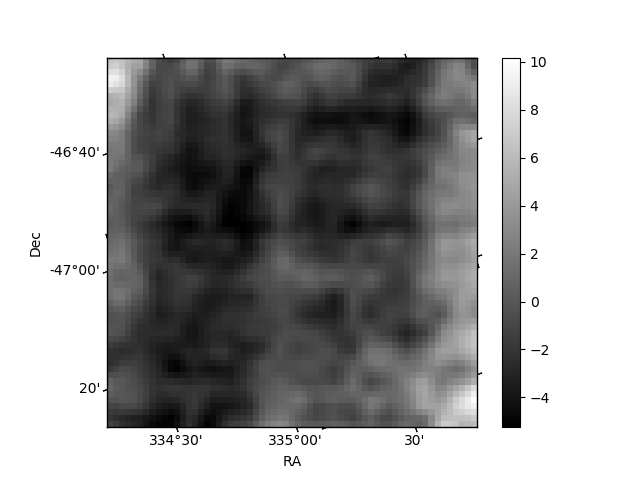
Histogram calculated using DETX and DETY for each event in the final _common_clean file
| Quadrant A | 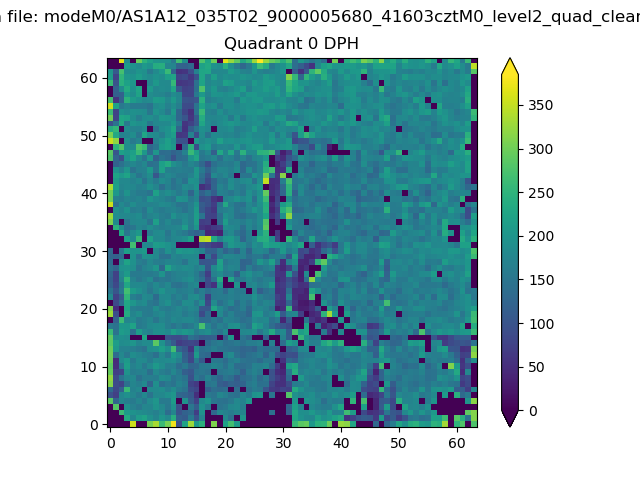 |
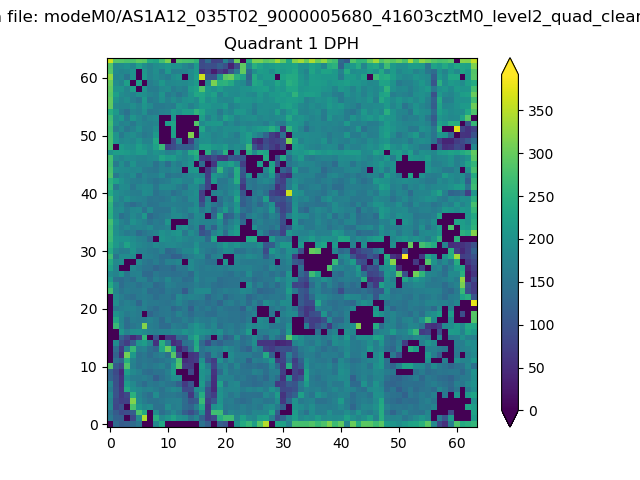 |
Quadrant B |
|---|---|---|---|
| Quadrant D | 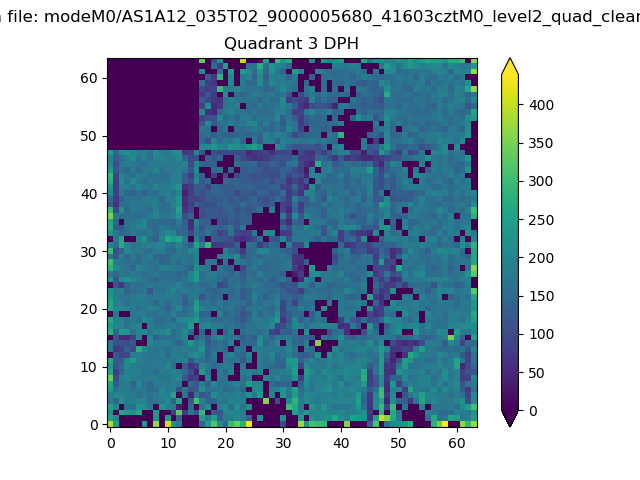 |
 |
Quadrant C |
| Plot type | Count rate plots | Images |
|---|---|---|
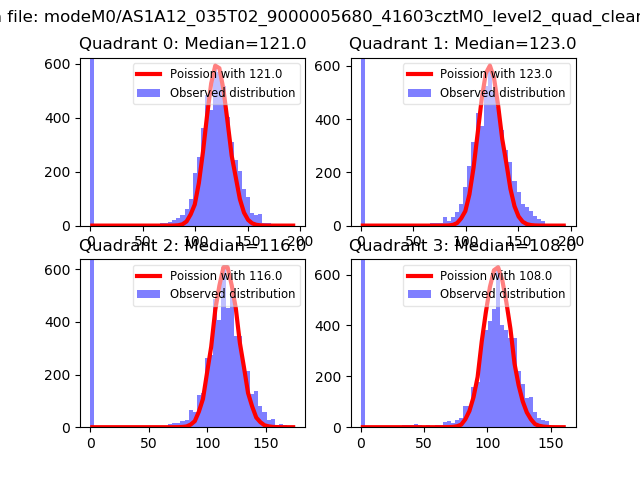
| Comparison with Poisson distribution Blue bars denote a histogram of data divided into 1 sec bins. Red curve is a Poisson curve with rate = median count rate of data. |
 |
 |
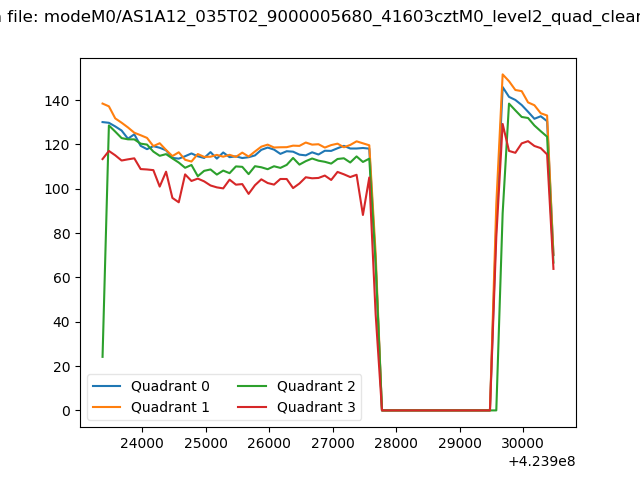
| Quadrant-wise count rates Data is divided into 100 sec bins |
 |
|
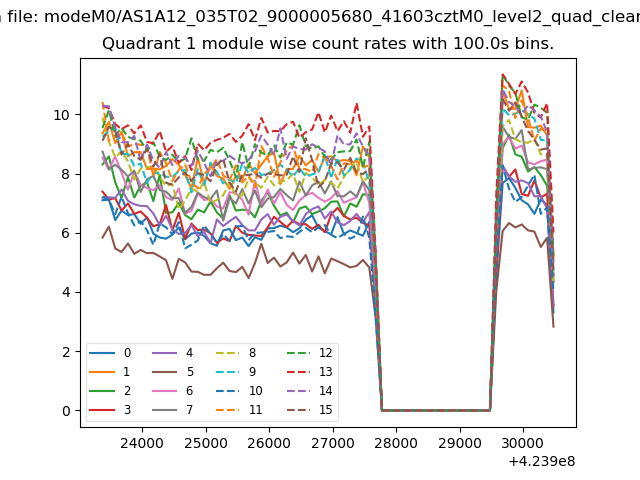
| Module-wise count rates for Quadrant A Data is divided into 100 sec bins |
 |
 |
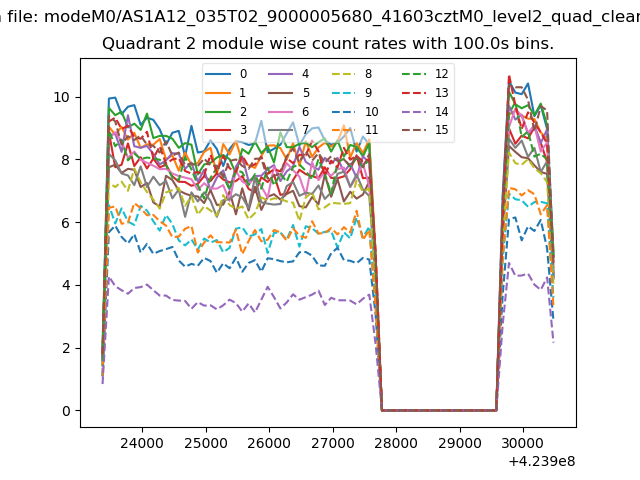
| Module-wise count rates for Quadrant B Data is divided into 100 sec bins |
 |
 |
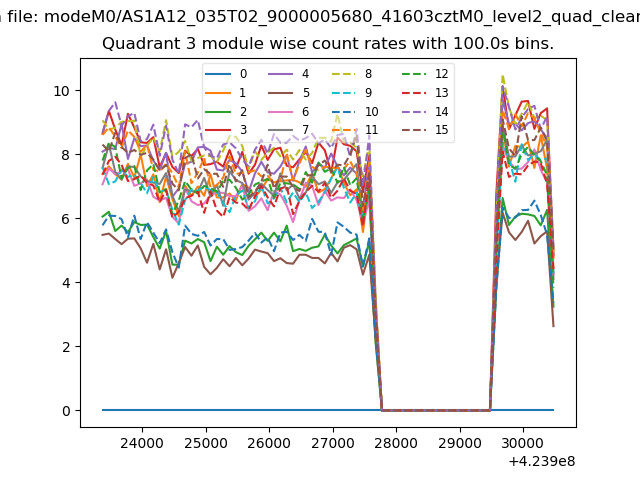
| Module-wise count rates for Quadrant C Data is divided into 100 sec bins |
 |
 |
| Module-wise count rates for Quadrant D Data is divided into 100 sec bins |
 |
 |
| Parameter | Plot |
|---|---|
| CZT HV Monitor | 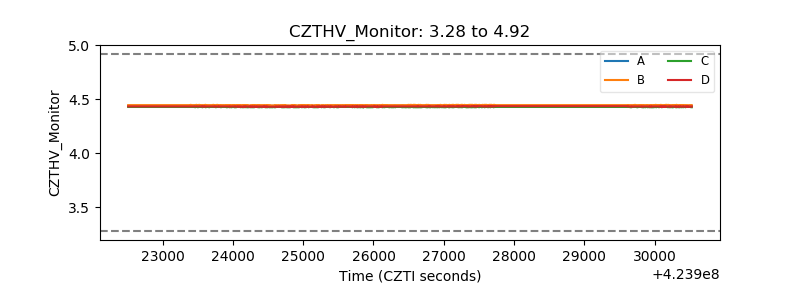 |
| D_VDD |  |
| Temperature 1 | 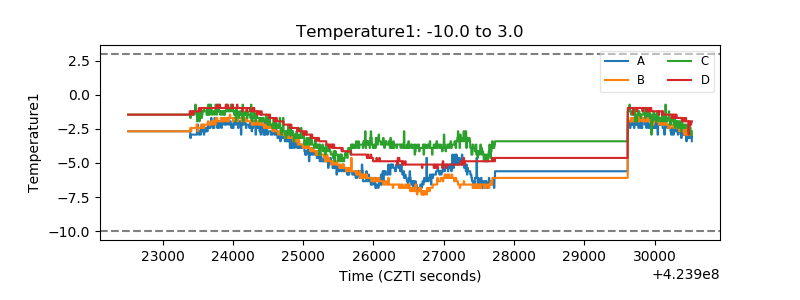 |
| Veto HV Monitor | 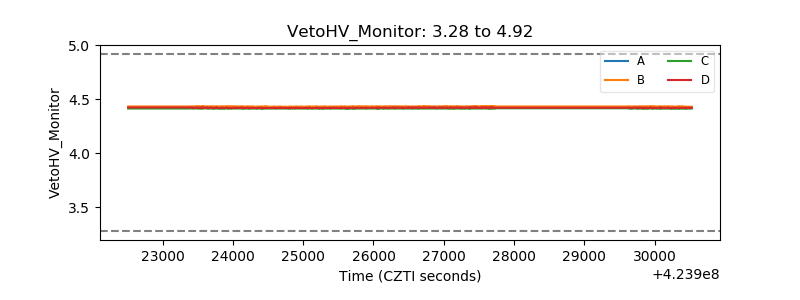 |
| Veto LLD | 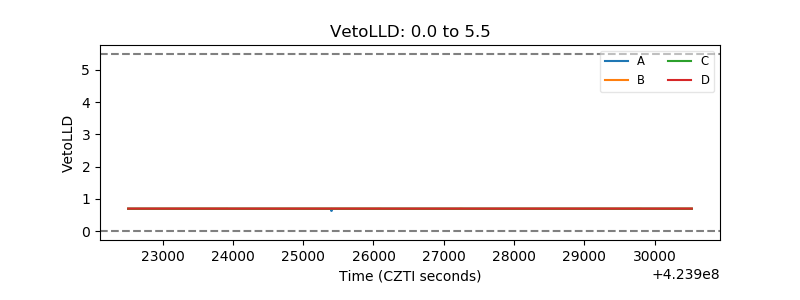 |
| Alpha Counter | 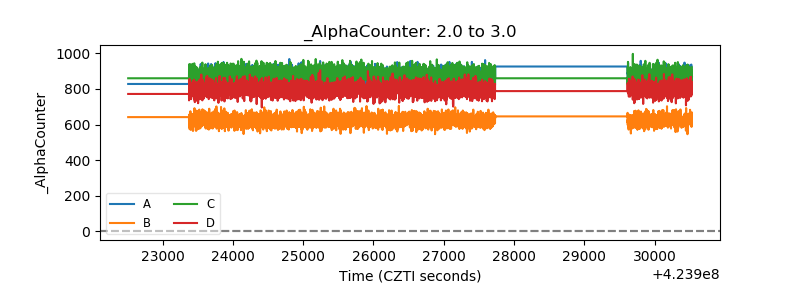 |
| _CPM_Rate | 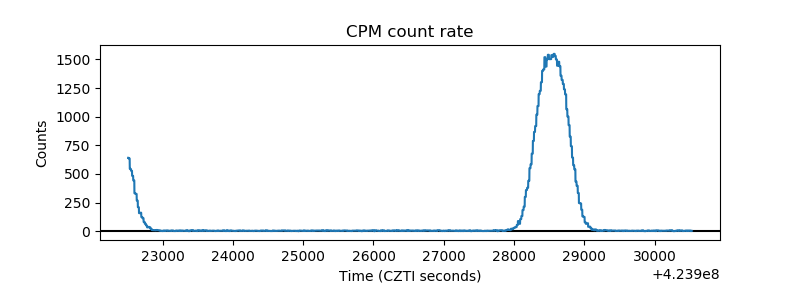 |
| CZT Counter | 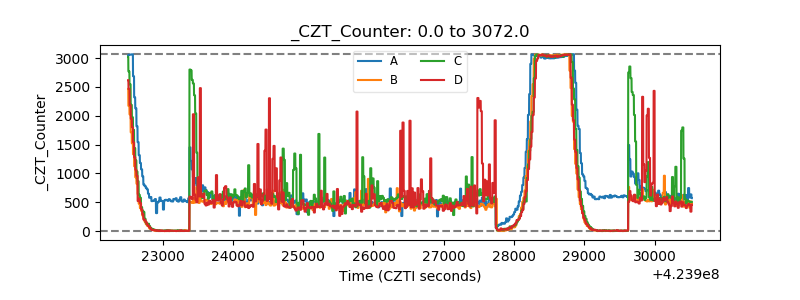 |
| +2.5 Volts monitor | 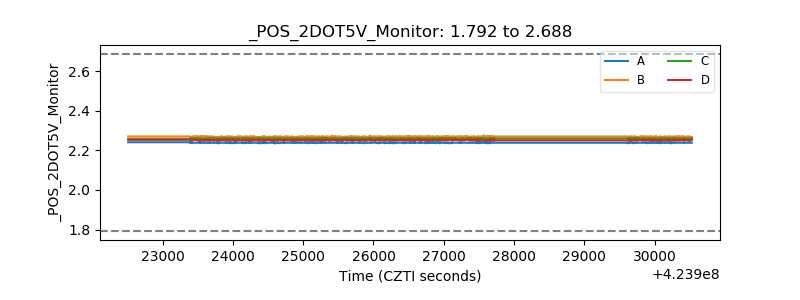 |
| +5 Volts monitor | 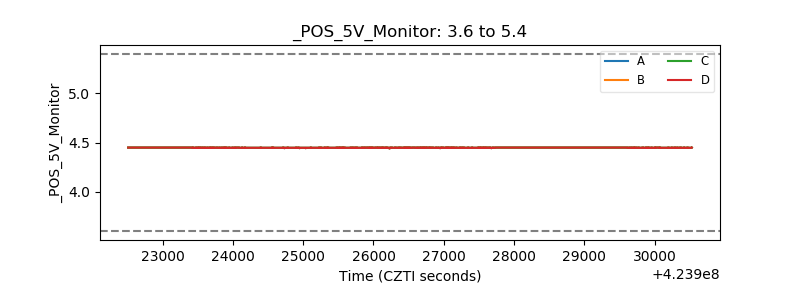 |
| _ROLL_ROT | 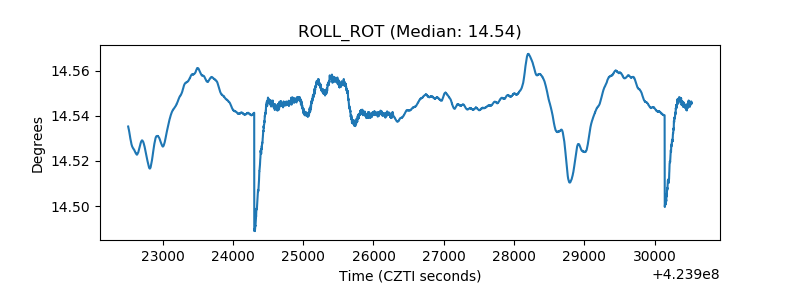 |
| _Roll_DEC | 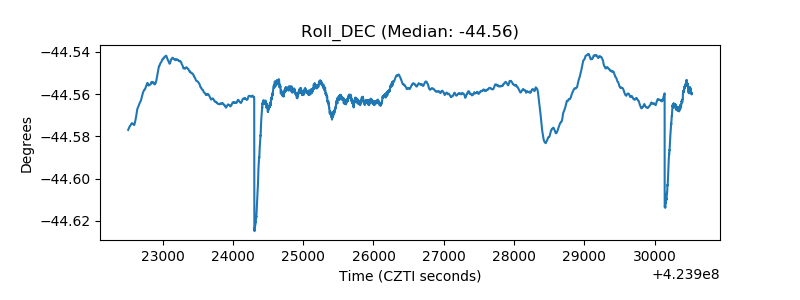 |
| _Roll_RA | 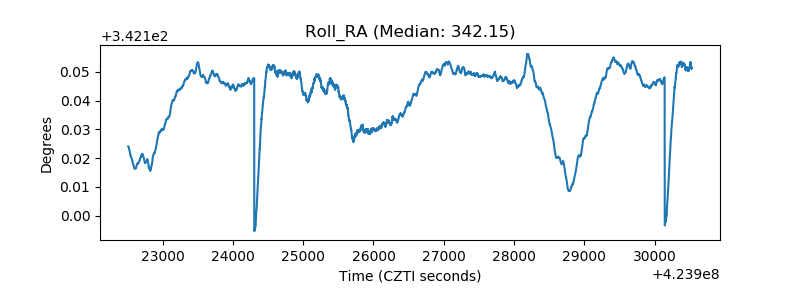 |
| Veto Counter | 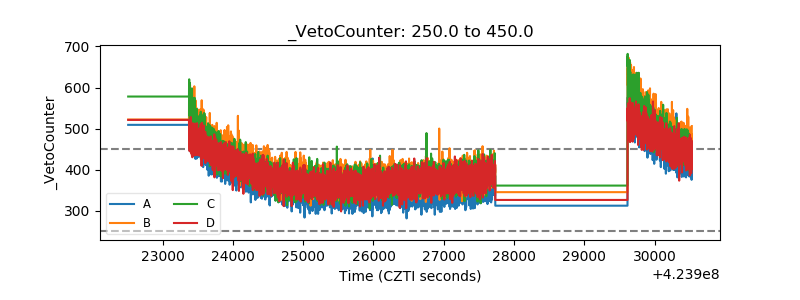 |