| Param | Original file | Final file |
|---|---|---|
| Filename | modeM0/AS1A12_035T02_9000005680_41604cztM0_level2.fits | modeM0/AS1A12_035T02_9000005680_41604cztM0_level2_quad_clean.evt |
| Size (bytes) | 390,360,960 | 93,689,280 |
| Size | 372.3 MB | 89.3 MB |
| Events in quadrant A | 2,998,493 | 663,430 |
| Events in quadrant B | 2,706,852 | 674,204 |
| Events in quadrant C | 3,816,384 | 603,922 |
| Events in quadrant D | 4,527,181 | 534,500 |
| Mode SS | |||
|---|---|---|---|
| Quadrant | BADHDUFLAG | Total packets | Discarded packets |
| A | 0 | 104 | 0 |
| B | 0 | 104 | 0 |
| C | 0 | 104 | 0 |
| D | 0 | 104 | 0 |
| Mode M0 | |||
|---|---|---|---|
| Quadrant | BADHDUFLAG | Total packets | Discarded packets |
| A | 0 | 11999 | 2 |
| B | 0 | 11296 | 2 |
| C | 0 | 14917 | 2 |
| D | 0 | 16993 | 5 |
| Mode M9 | |||
|---|---|---|---|
| Quadrant | BADHDUFLAG | Total packets | Discarded packets |
| A | 0 | 22 | 0 |
| B | 0 | 22 | 0 |
| C | 0 | 23 | 0 |
| D | 0 | 23 | 0 |
| Quadrant | Total seconds | Saturated seconds | Saturation percentage |
|---|---|---|---|
| A | 5156 | 22 | 0.426687% |
| B | 5156 | 35 | 0.678821% |
| C | 5156 | 257 | 4.984484% |
| D | 5155 | 533 | 10.339476% |
Noise dominated data is calculated using 1-second bins in cleaned event files. If a bin has >2000 counts, and if more than 50% of those come from <1% of pixels, then it is considered to be noise-dominated and hence unusable.
| Quadrant | # 1 sec bins | Bins with >0 counts | Bins with >2000 counts | High rate bins dominated by noise | Noise dominated (total time) | Noise dominated (detector-on time) | Marked lightcurve |
|---|---|---|---|---|---|---|---|
| A | 7157 | 5157 | 5 | 5 | 0.07% | 0.10% | 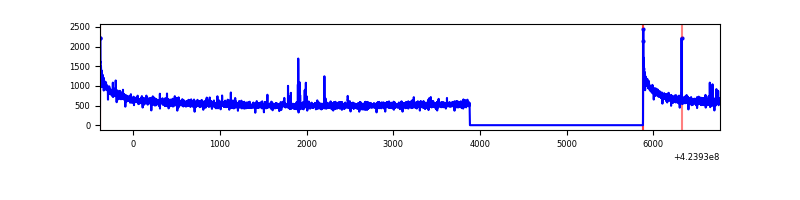 |
| B | 7157 | 5157 | 24 | 24 | 0.34% | 0.47% | 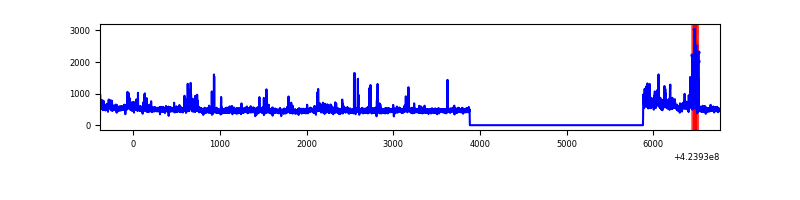 |
| C | 7157 | 5157 | 250 | 250 | 3.49% | 4.85% | 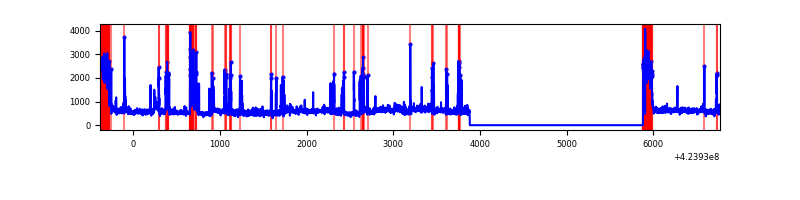 |
| D | 7156 | 5156 | 450 | 450 | 6.29% | 8.73% | 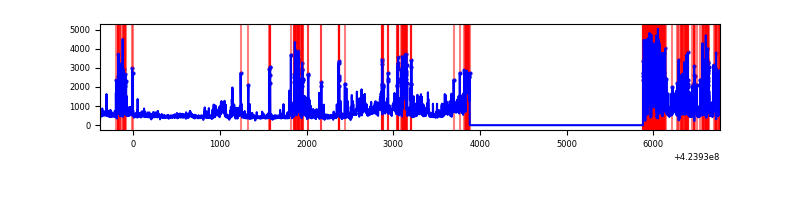 |
Top three noisy pixels from each quadrant. If the there are fewer than three noisy pixels in the level2.evt file, extra rows are filled as -1
| Pixel properties | Quadrant properties | ||||||
|---|---|---|---|---|---|---|---|
| Quadrant | DetID | PixID | Counts | Sigma | Mean | Median | Sigma |
| A | 10 | 83 | 553192 | 4326.59 | 621 | 607 | 127.7 |
| A | 7 | 3 | 18804 | 142.48 | 621 | 607 | 127.7 |
| A | 2 | 79 | 13069 | 97.57 | 621 | 607 | 127.7 |
| B | 0 | 186 | 111567 | 953.11 | 618 | 602 | 116.4 |
| B | 7 | 202 | 54864 | 466.07 | 618 | 602 | 116.4 |
| B | 0 | 245 | 53156 | 451.4 | 618 | 602 | 116.4 |
| C | 0 | 15 | 815940 | 6082.16 | 581 | 584 | 134.1 |
| C | 0 | 10 | 506956 | 3777.29 | 581 | 584 | 134.1 |
| C | 15 | 214 | 223342 | 1661.66 | 581 | 584 | 134.1 |
| D | 12 | 79 | 1205390 | 8874.17 | 563 | 549 | 135.8 |
| D | 1 | 47 | 510685 | 3757.37 | 563 | 549 | 135.8 |
| D | 13 | 249 | 502527 | 3697.28 | 563 | 549 | 135.8 |
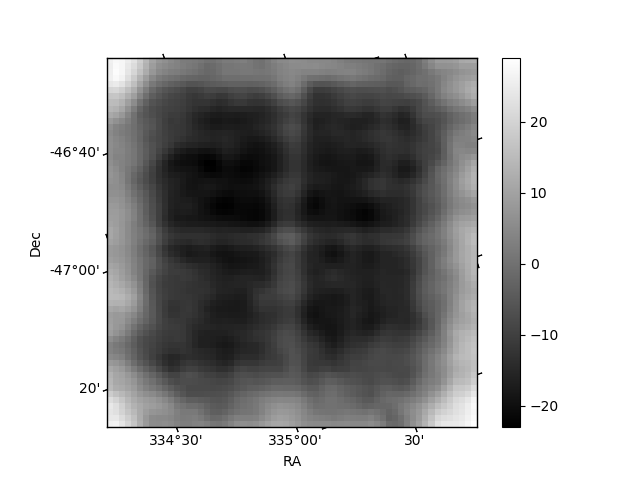
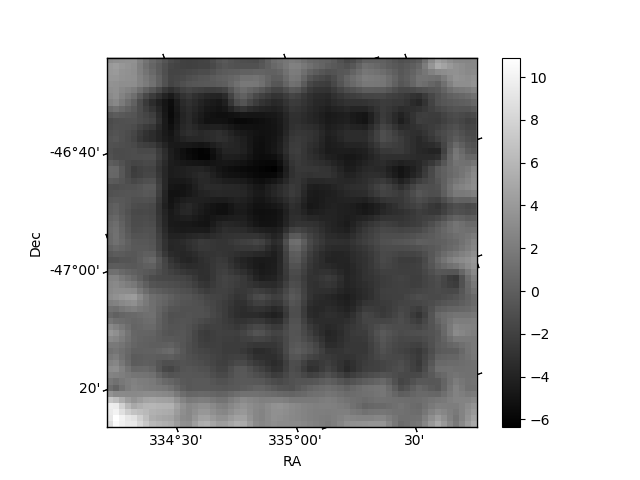
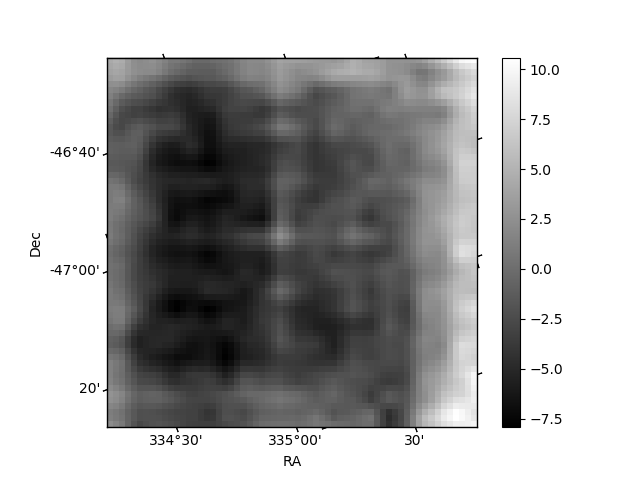
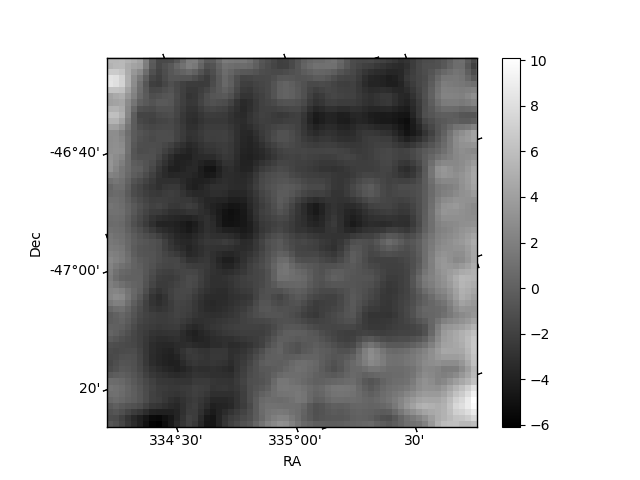
Histogram calculated using DETX and DETY for each event in the final _common_clean file
| Quadrant A | 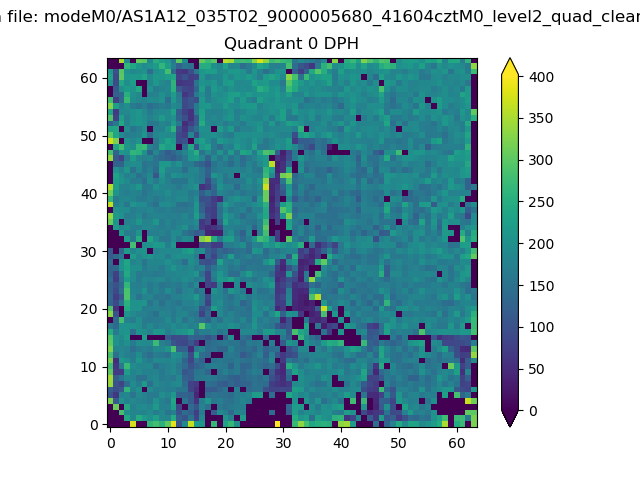 |
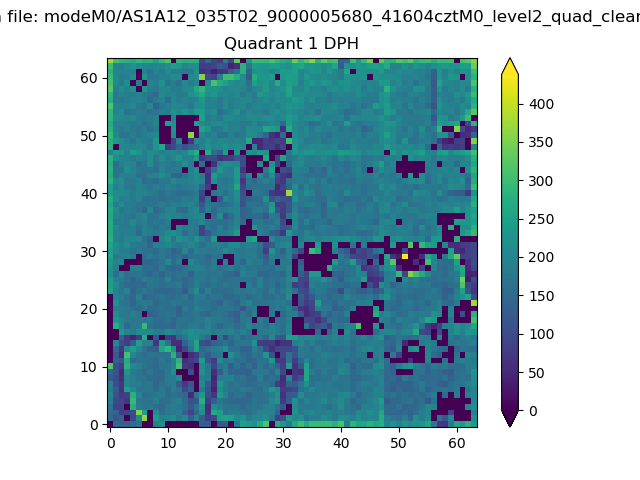 |
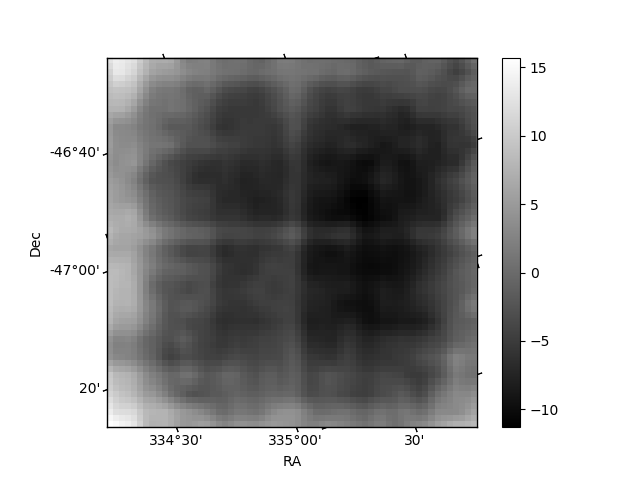
Quadrant B |
|---|---|---|---|
| Quadrant D | 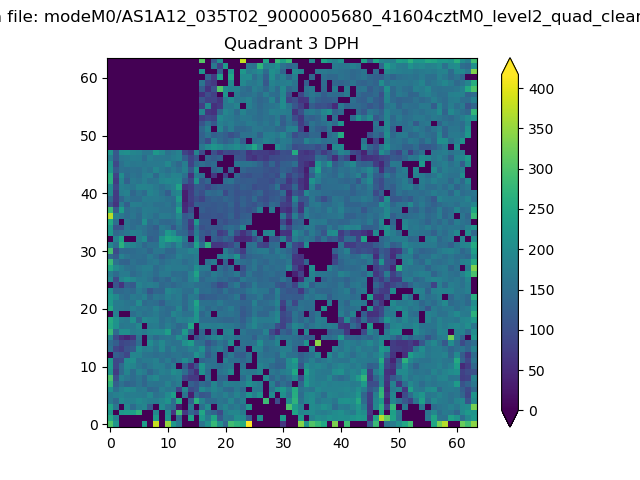 |
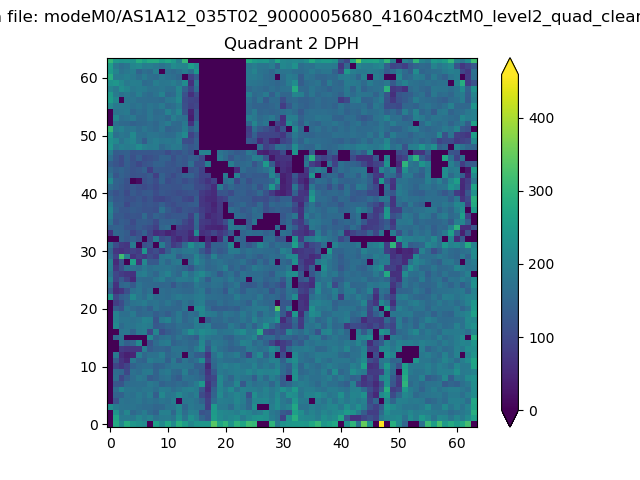 |
Quadrant C |
| Plot type | Count rate plots | Images |
|---|---|---|
| Comparison with Poisson distribution Blue bars denote a histogram of data divided into 1 sec bins. Red curve is a Poisson curve with rate = median count rate of data. |
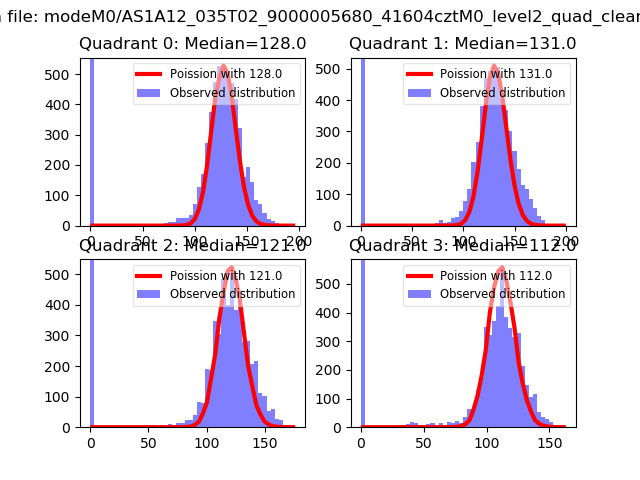 |
 |
| Quadrant-wise count rates Data is divided into 100 sec bins |
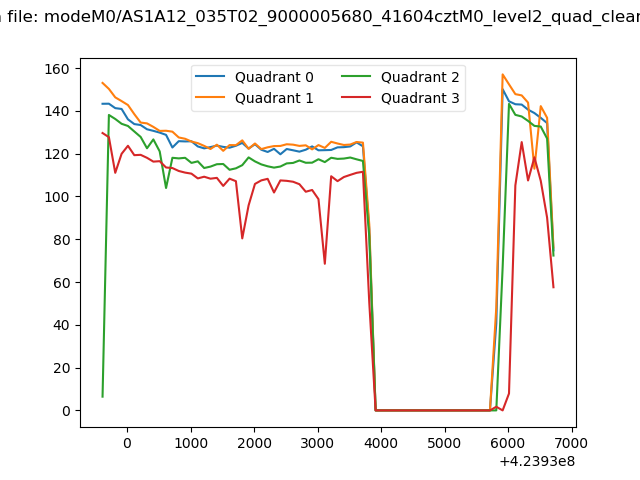 |
|
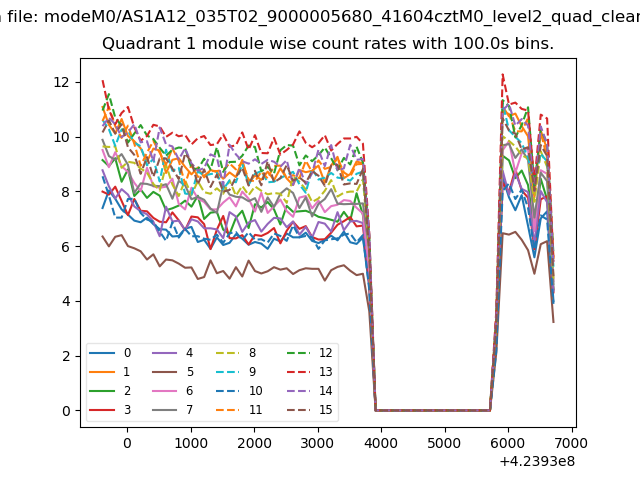
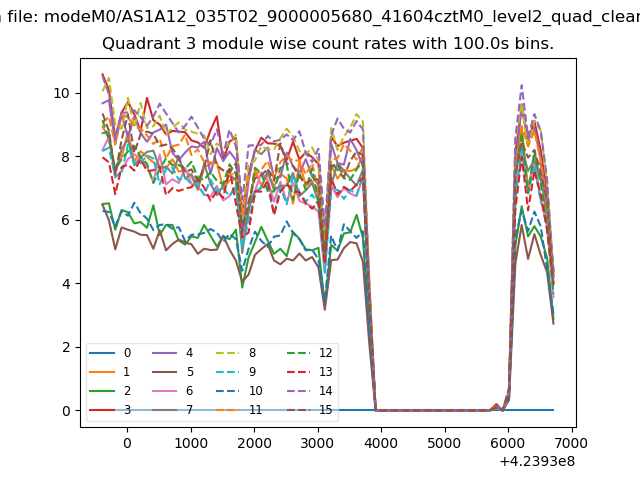
| Module-wise count rates for Quadrant A Data is divided into 100 sec bins |
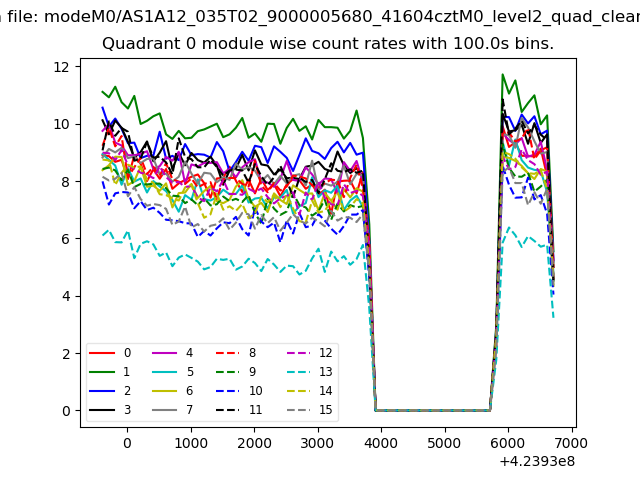 |
 |
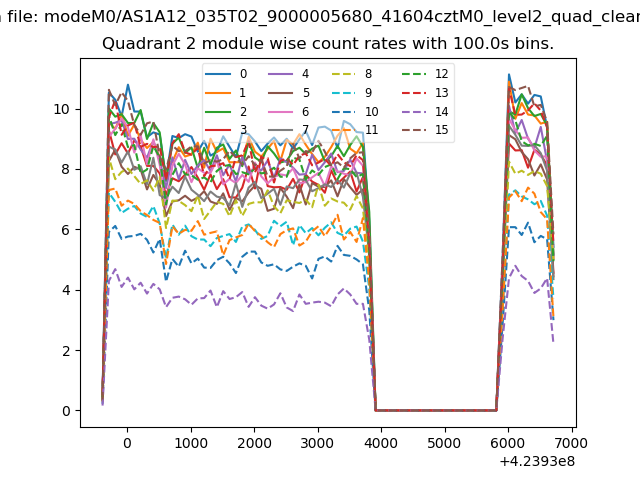
| Module-wise count rates for Quadrant B Data is divided into 100 sec bins |
 |
 |
| Module-wise count rates for Quadrant C Data is divided into 100 sec bins |
 |
 |
| Module-wise count rates for Quadrant D Data is divided into 100 sec bins |
 |
 |
| Parameter | Plot |
|---|---|
| CZT HV Monitor | 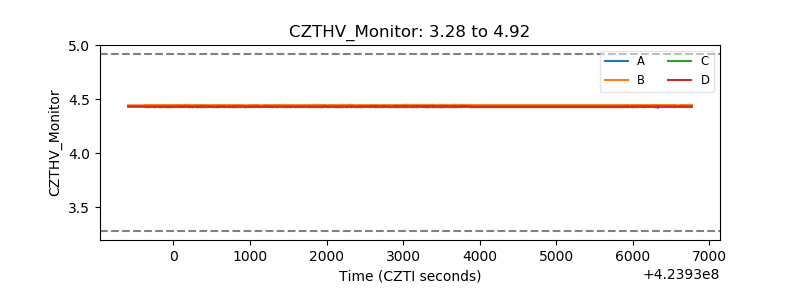 |
| D_VDD | 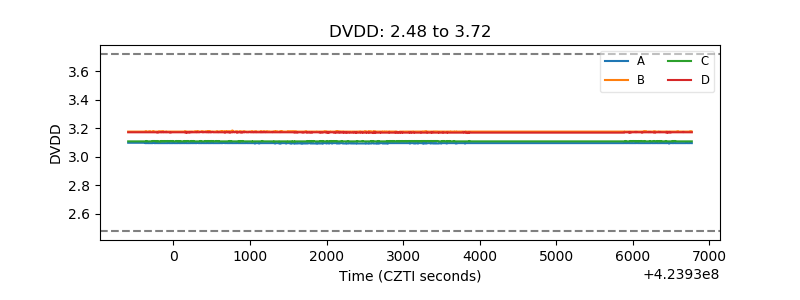 |
| Temperature 1 | 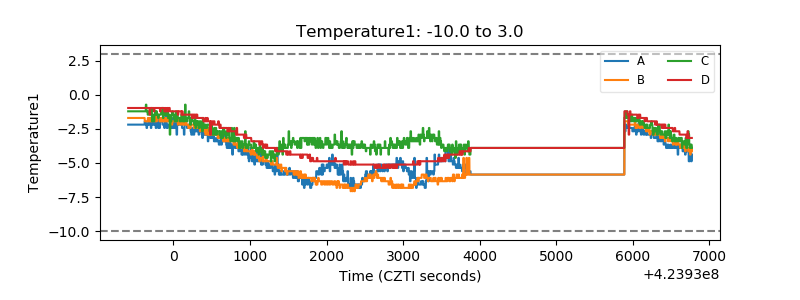 |
| Veto HV Monitor | 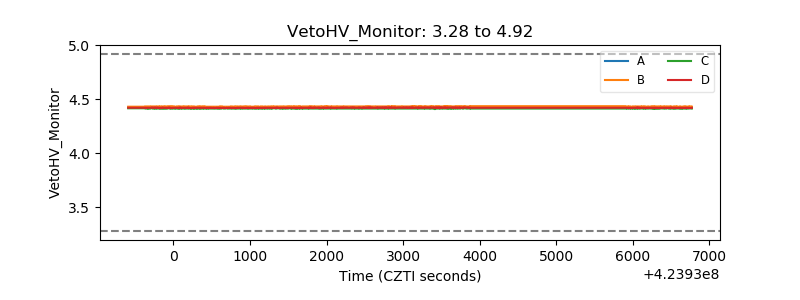 |
| Veto LLD | 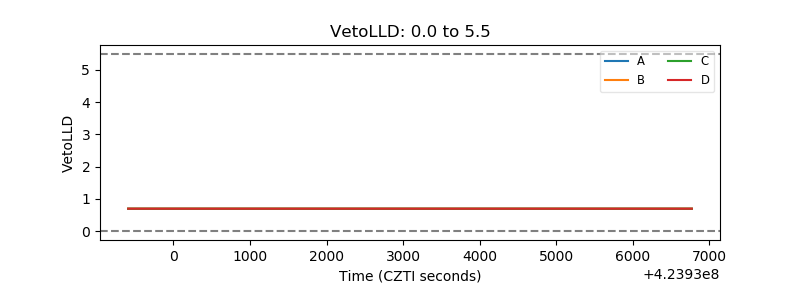 |
| Alpha Counter | 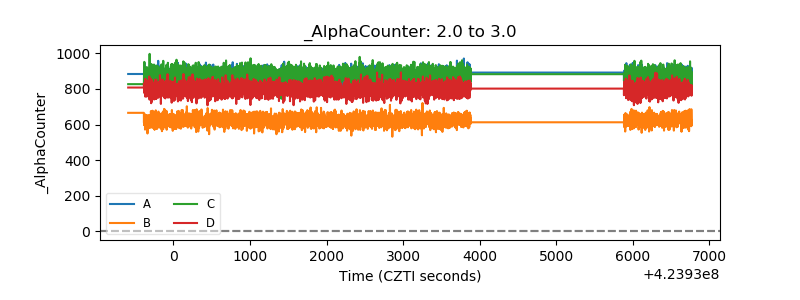 |
| _CPM_Rate | 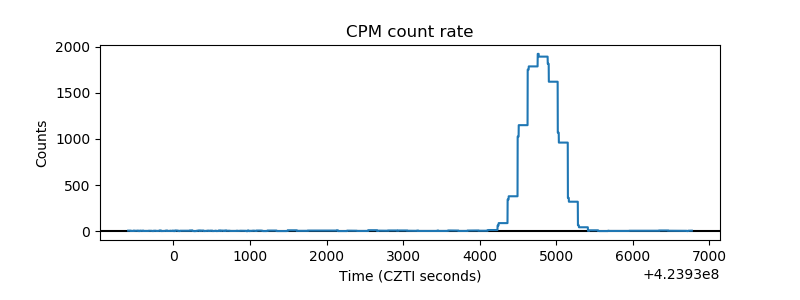 |
| CZT Counter | 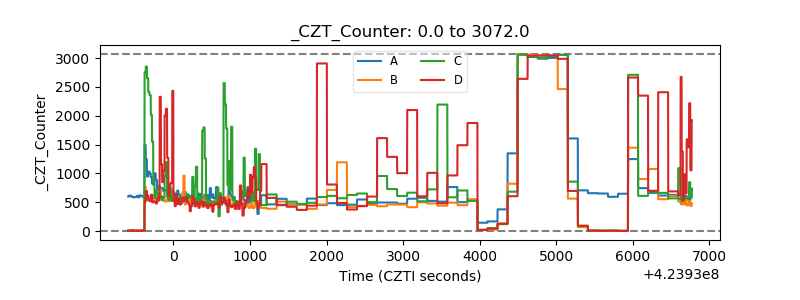 |
| +2.5 Volts monitor | 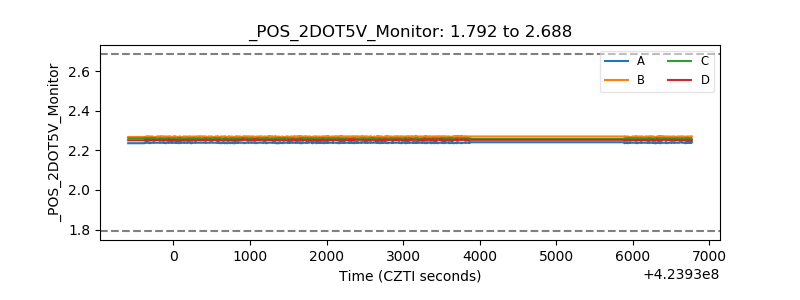 |
| +5 Volts monitor | 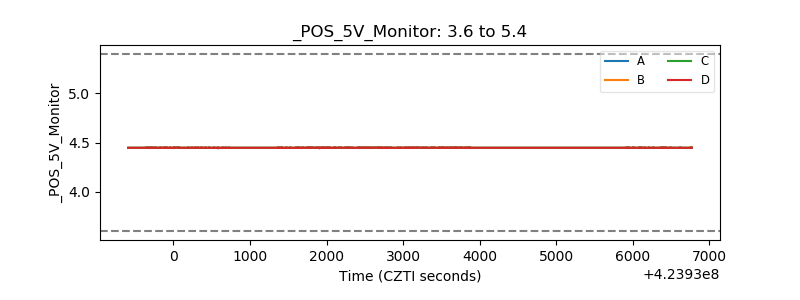 |
| _ROLL_ROT | 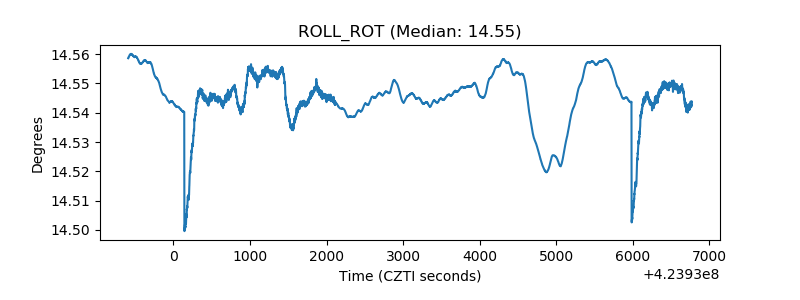 |
| _Roll_DEC |  |
| _Roll_RA | 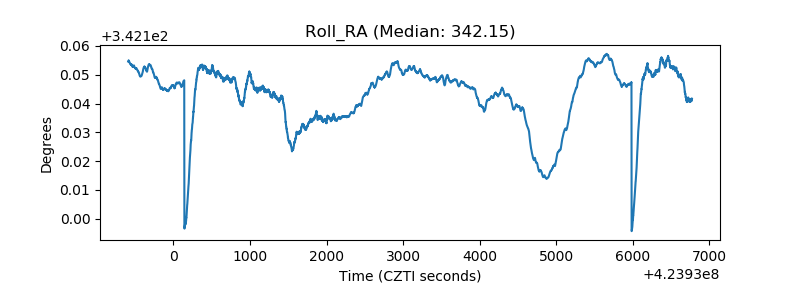 |
| Veto Counter | 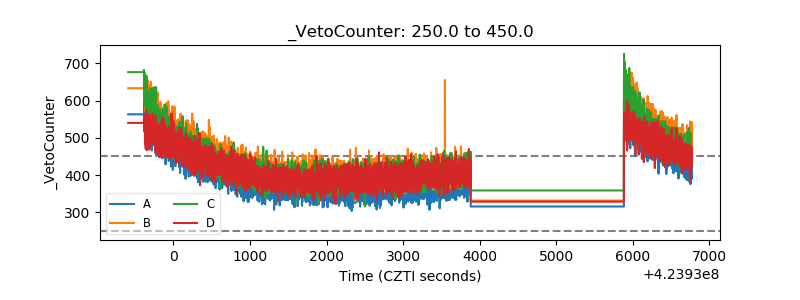 |