| Param | Original file | Final file |
|---|---|---|
| Filename | modeM0/AS1A12_035T02_9000005680_41605cztM0_level2.fits | modeM0/AS1A12_035T02_9000005680_41605cztM0_level2_quad_clean.evt |
| Size (bytes) | 418,227,840 | 88,637,760 |
| Size | 398.9 MB | 84.5 MB |
| Events in quadrant A | 2,927,202 | 649,672 |
| Events in quadrant B | 2,568,908 | 663,266 |
| Events in quadrant C | 4,834,026 | 504,668 |
| Events in quadrant D | 4,761,809 | 515,650 |
| Mode SS | |||
|---|---|---|---|
| Quadrant | BADHDUFLAG | Total packets | Discarded packets |
| A | 0 | 102 | 0 |
| B | 0 | 102 | 0 |
| C | 0 | 102 | 0 |
| D | 0 | 102 | 0 |
| Mode M0 | |||
|---|---|---|---|
| Quadrant | BADHDUFLAG | Total packets | Discarded packets |
| A | 0 | 11663 | 2 |
| B | 0 | 10843 | 2 |
| C | 0 | 17544 | 2 |
| D | 0 | 17645 | 2 |
| Mode M9 | |||
|---|---|---|---|
| Quadrant | BADHDUFLAG | Total packets | Discarded packets |
| A | 0 | 27 | 0 |
| B | 0 | 28 | 0 |
| C | 0 | 28 | 0 |
| D | 0 | 28 | 0 |
| Quadrant | Total seconds | Saturated seconds | Saturation percentage |
|---|---|---|---|
| A | 5006 | 30 | 0.599281% |
| B | 5006 | 38 | 0.759089% |
| C | 5006 | 924 | 18.457851% |
| D | 5006 | 623 | 12.445066% |
Noise dominated data is calculated using 1-second bins in cleaned event files. If a bin has >2000 counts, and if more than 50% of those come from <1% of pixels, then it is considered to be noise-dominated and hence unusable.
| Quadrant | # 1 sec bins | Bins with >0 counts | Bins with >2000 counts | High rate bins dominated by noise | Noise dominated (total time) | Noise dominated (detector-on time) | Marked lightcurve |
|---|---|---|---|---|---|---|---|
| A | 7098 | 5007 | 15 | 15 | 0.21% | 0.30% | 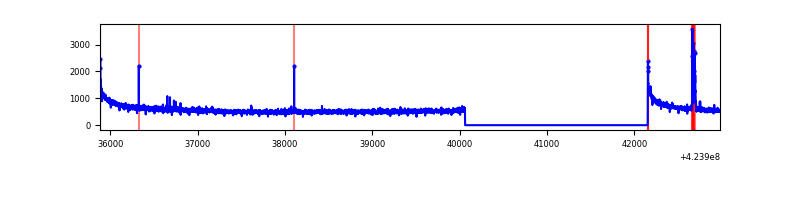 |
| B | 7098 | 5007 | 26 | 26 | 0.37% | 0.52% | 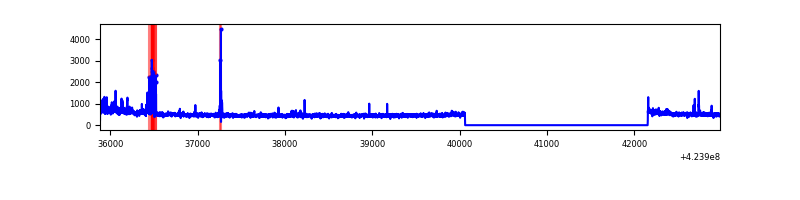 |
| C | 7097 | 5006 | 817 | 817 | 11.51% | 16.32% | 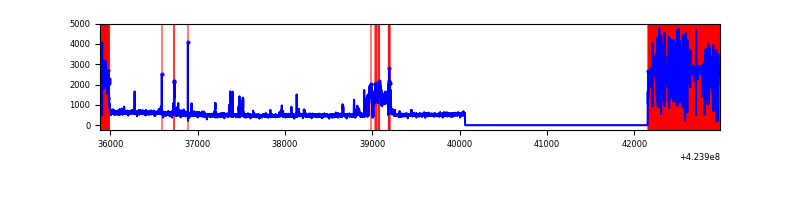 |
| D | 7098 | 5007 | 539 | 539 | 7.59% | 10.76% | 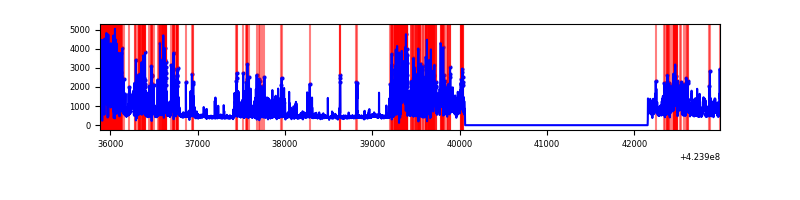 |
Top three noisy pixels from each quadrant. If the there are fewer than three noisy pixels in the level2.evt file, extra rows are filled as -1
| Pixel properties | Quadrant properties | ||||||
|---|---|---|---|---|---|---|---|
| Quadrant | DetID | PixID | Counts | Sigma | Mean | Median | Sigma |
| A | 10 | 83 | 528398 | 4316.48 | 602 | 591 | 122.3 |
| A | 15 | 223 | 48776 | 394.06 | 602 | 591 | 122.3 |
| A | 13 | 254 | 9491 | 72.79 | 602 | 591 | 122.3 |
| B | 0 | 186 | 91381 | 799.02 | 600 | 586 | 113.6 |
| B | 7 | 202 | 59202 | 515.84 | 600 | 586 | 113.6 |
| B | 0 | 245 | 42951 | 372.82 | 600 | 586 | 113.6 |
| C | 0 | 15 | 2309696 | 19967.65 | 503 | 506 | 115.6 |
| C | 0 | 10 | 366838 | 3167.69 | 503 | 506 | 115.6 |
| C | 15 | 214 | 191262 | 1649.47 | 503 | 506 | 115.6 |
| D | 13 | 249 | 921574 | 7005.02 | 544 | 530 | 131.5 |
| D | 12 | 79 | 920189 | 6994.49 | 544 | 530 | 131.5 |
| D | 1 | 47 | 678680 | 5157.68 | 544 | 530 | 131.5 |
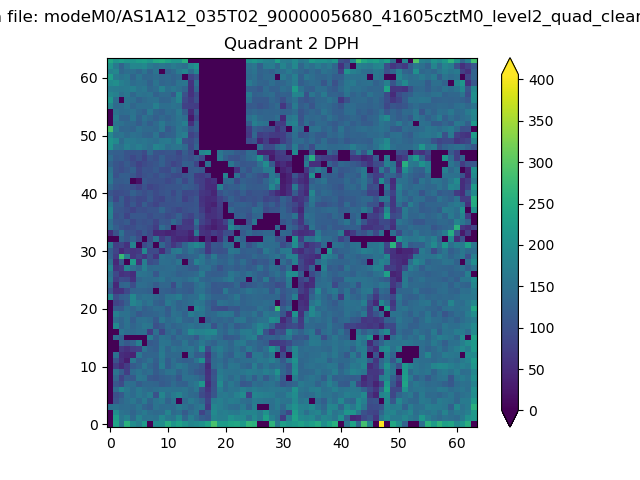
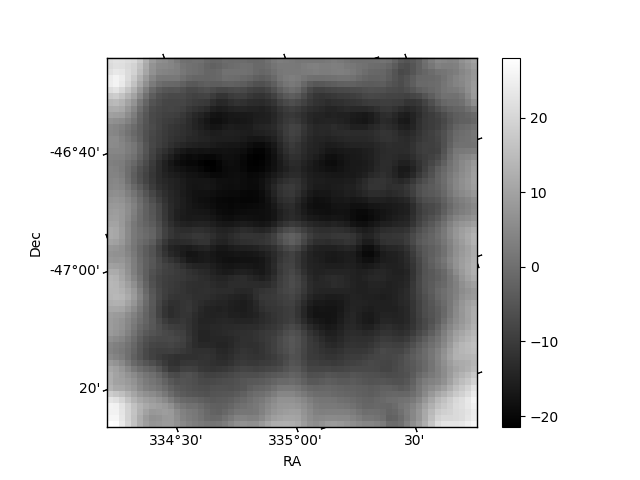
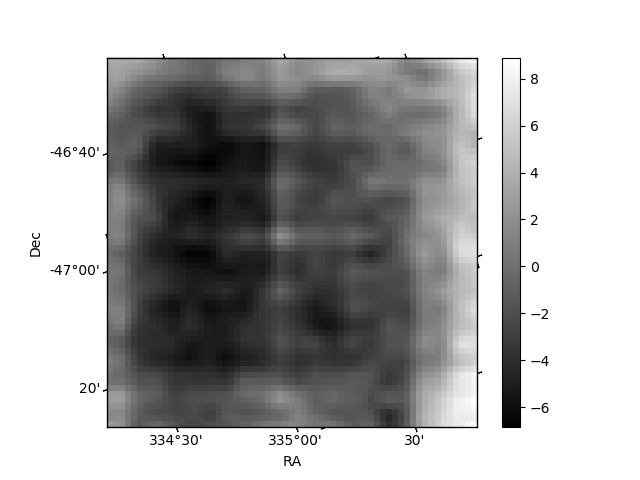
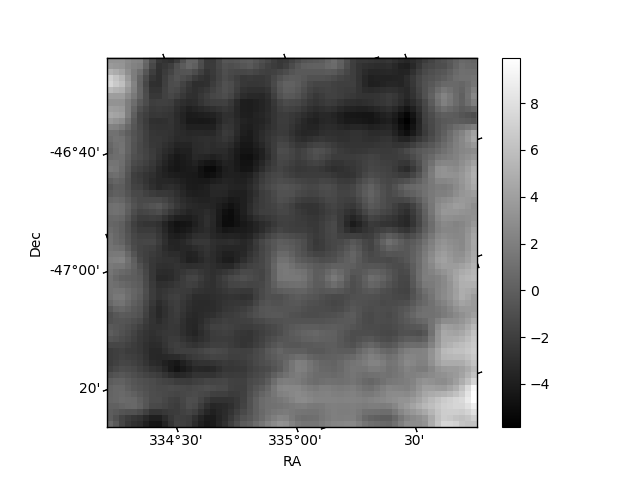
Histogram calculated using DETX and DETY for each event in the final _common_clean file
| Quadrant A | 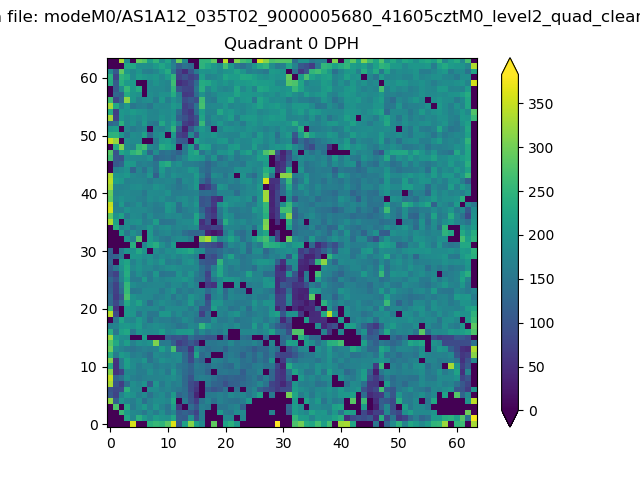 |
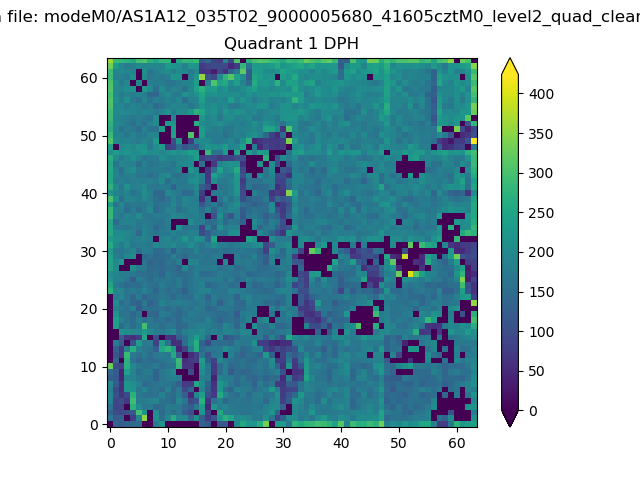 |
Quadrant B |
|---|---|---|---|
| Quadrant D | 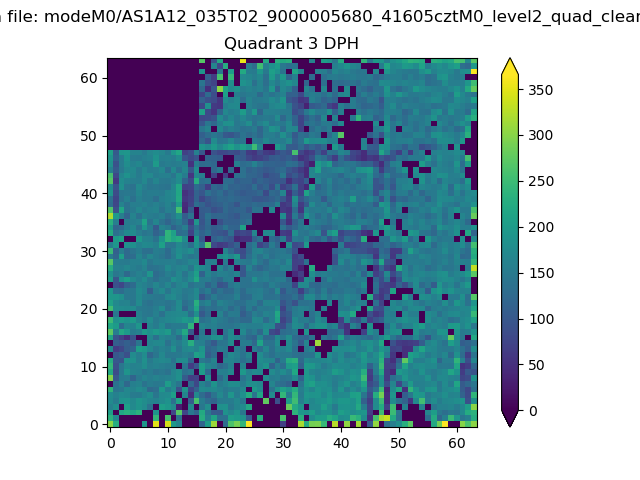 |
 |
Quadrant C |
| Plot type | Count rate plots | Images |
|---|---|---|
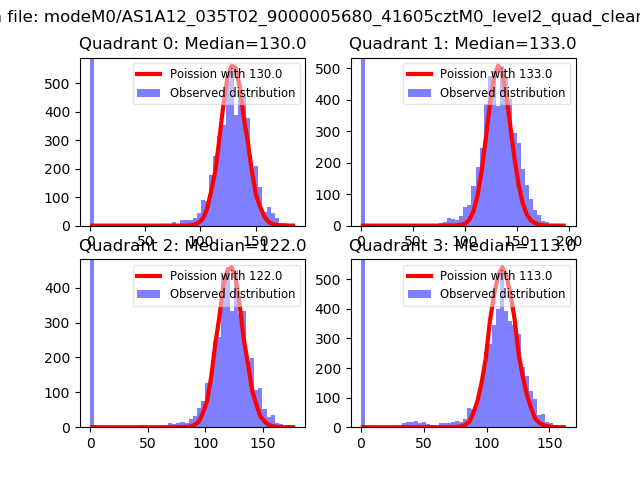
| Comparison with Poisson distribution Blue bars denote a histogram of data divided into 1 sec bins. Red curve is a Poisson curve with rate = median count rate of data. |
 |
 |
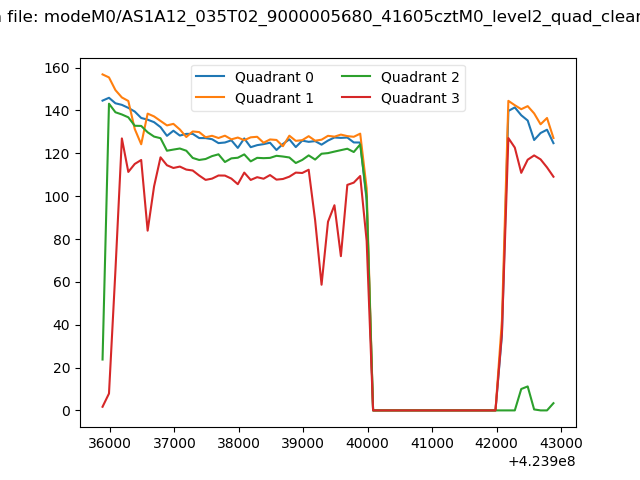
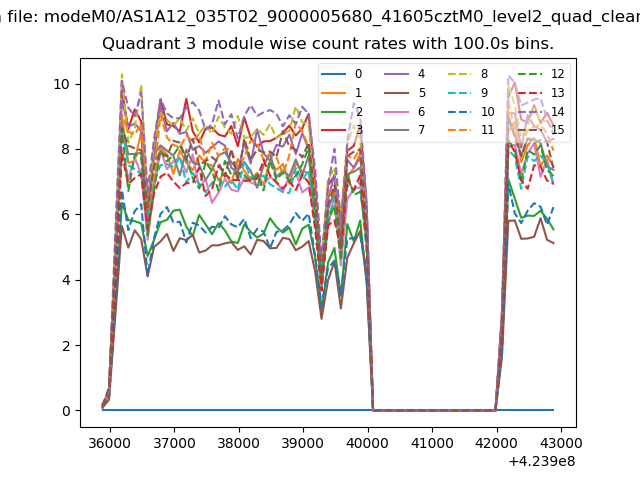
| Quadrant-wise count rates Data is divided into 100 sec bins |
 |
|
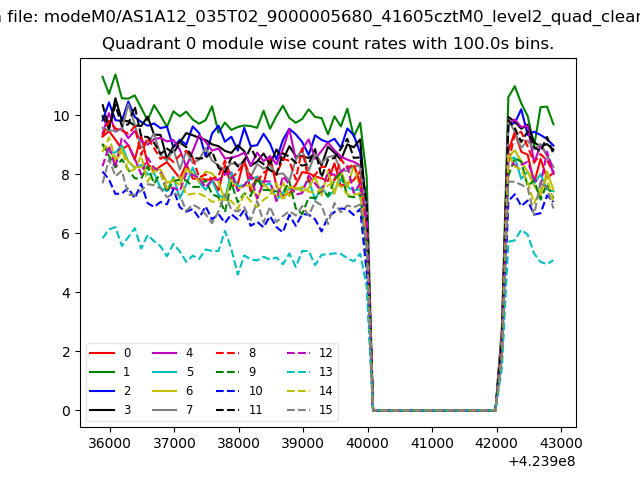
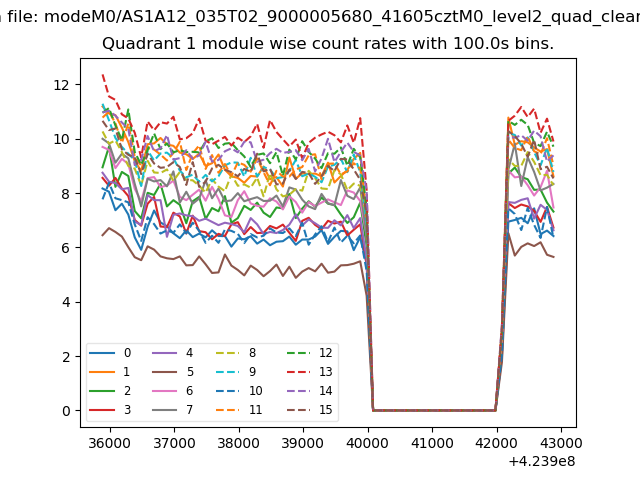
| Module-wise count rates for Quadrant A Data is divided into 100 sec bins |
 |
 |
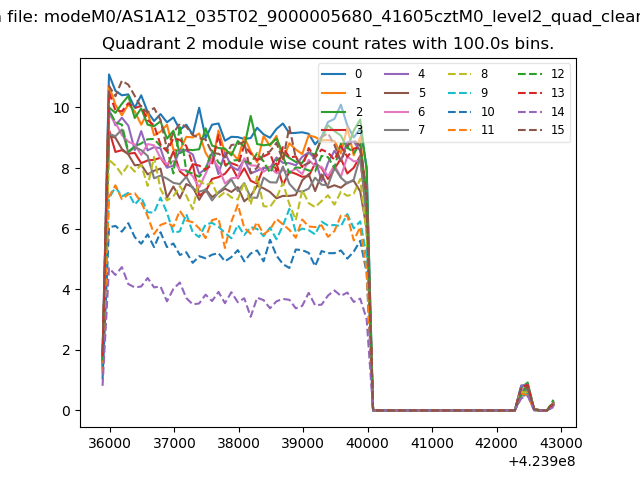
| Module-wise count rates for Quadrant B Data is divided into 100 sec bins |
 |
 |
| Module-wise count rates for Quadrant C Data is divided into 100 sec bins |
 |
 |
| Module-wise count rates for Quadrant D Data is divided into 100 sec bins |
 |
 |
| Parameter | Plot |
|---|---|
| CZT HV Monitor | 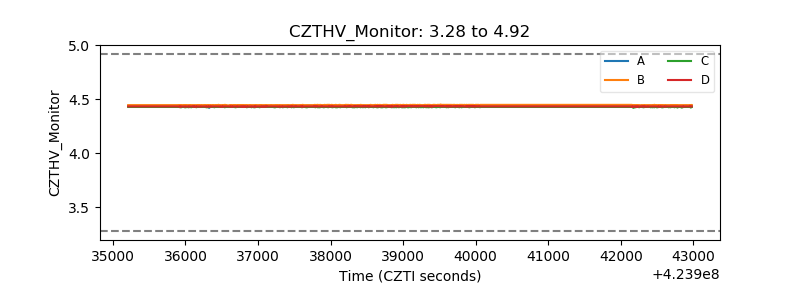 |
| D_VDD | 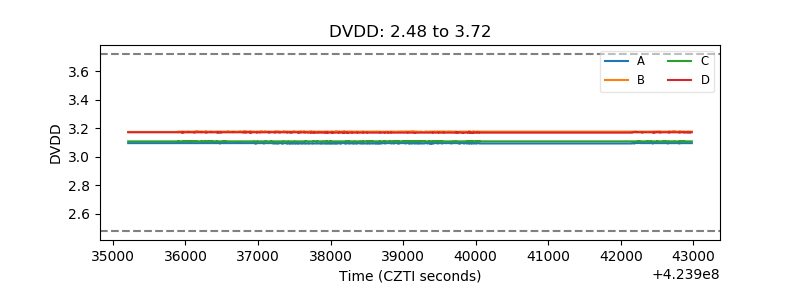 |
| Temperature 1 | 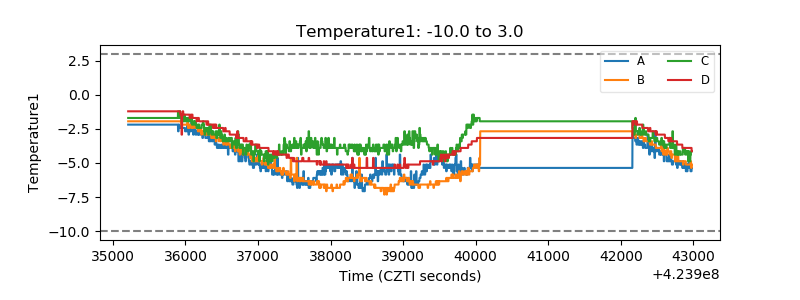 |
| Veto HV Monitor | 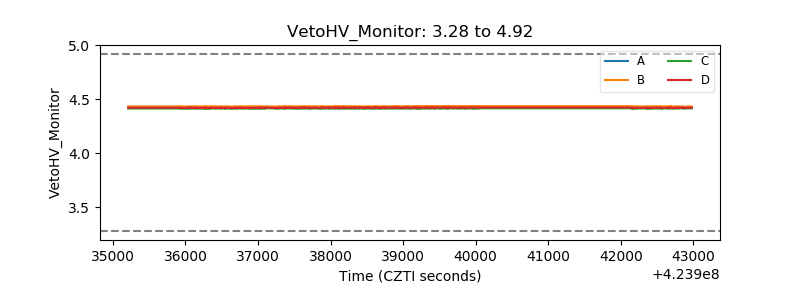 |
| Veto LLD | 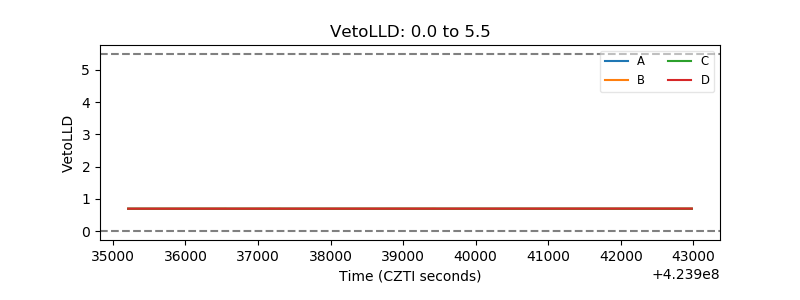 |
| Alpha Counter | 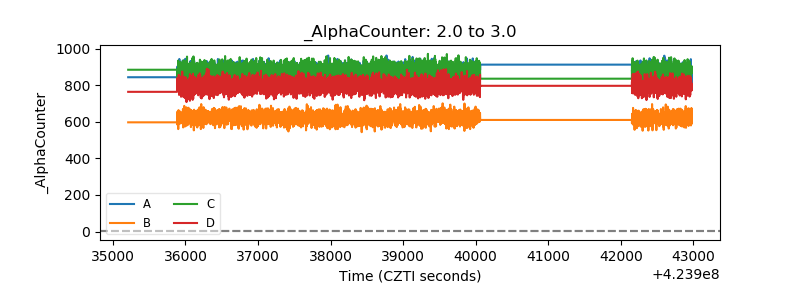 |
| _CPM_Rate | 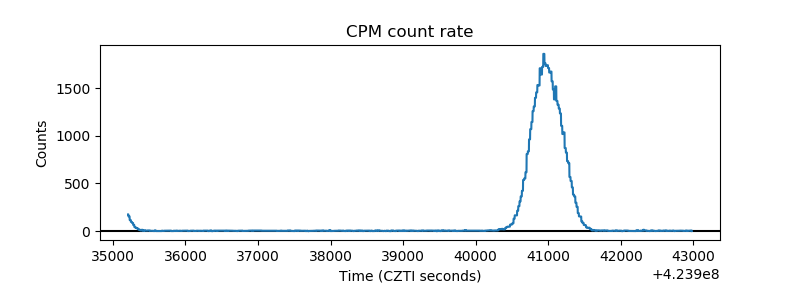 |
| CZT Counter | 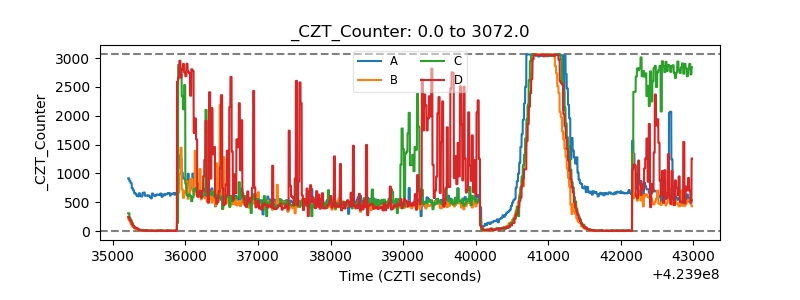 |
| +2.5 Volts monitor | 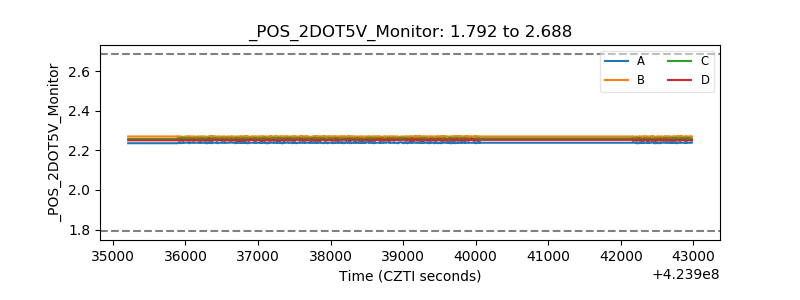 |
| +5 Volts monitor | 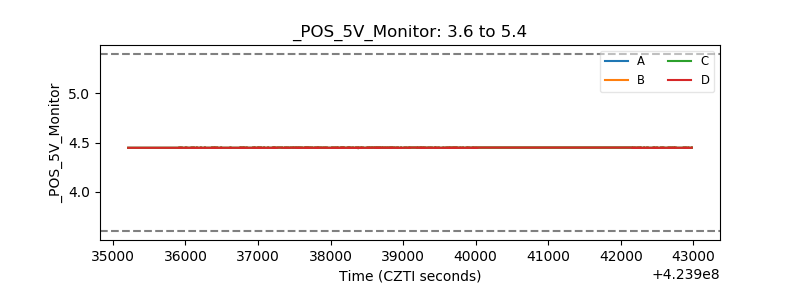 |
| _ROLL_ROT | 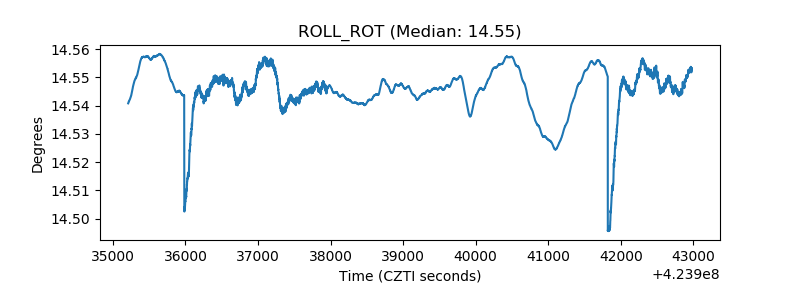 |
| _Roll_DEC | 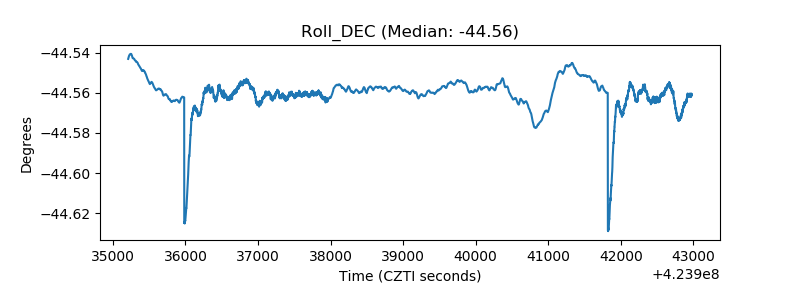 |
| _Roll_RA | 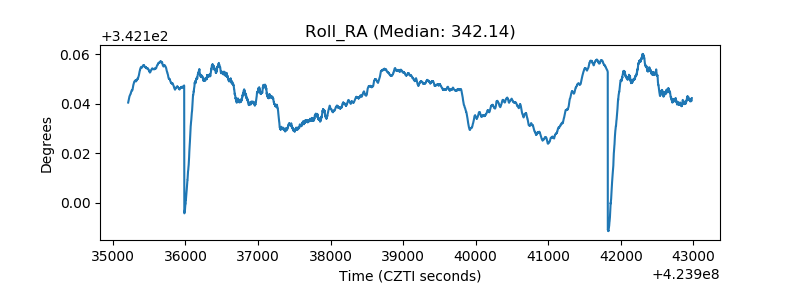 |
| Veto Counter | 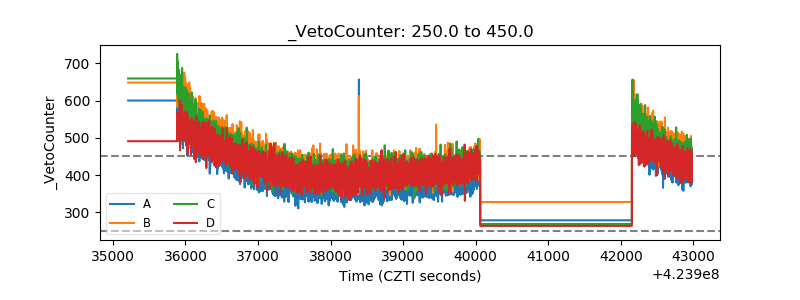 |