| Param | Original file | Final file |
|---|---|---|
| Filename | modeM0/AS1A12_035T02_9000005680_41606cztM0_level2.fits | modeM0/AS1A12_035T02_9000005680_41606cztM0_level2_quad_clean.evt |
| Size (bytes) | 592,839,360 | 72,659,520 |
| Size | 565.4 MB | 69.3 MB |
| Events in quadrant A | 2,817,115 | 612,703 |
| Events in quadrant B | 2,354,144 | 626,732 |
| Events in quadrant C | 11,780,837 | 94,472 |
| Events in quadrant D | 4,614,334 | 525,008 |
| Mode SS | |||
|---|---|---|---|
| Quadrant | BADHDUFLAG | Total packets | Discarded packets |
| A | 0 | 98 | 0 |
| B | 0 | 98 | 0 |
| C | 0 | 98 | 0 |
| D | 0 | 98 | 0 |
| Mode M0 | |||
|---|---|---|---|
| Quadrant | BADHDUFLAG | Total packets | Discarded packets |
| A | 0 | 11265 | 2 |
| B | 0 | 10125 | 3 |
| C | 0 | 38284 | 2 |
| D | 0 | 17101 | 2 |
| Mode M9 | |||
|---|---|---|---|
| Quadrant | BADHDUFLAG | Total packets | Discarded packets |
| A | 0 | 33 | 0 |
| B | 0 | 33 | 0 |
| C | 0 | 34 | 0 |
| D | 0 | 34 | 0 |
| Quadrant | Total seconds | Saturated seconds | Saturation percentage |
|---|---|---|---|
| A | 4869 | 38 | 0.780448% |
| B | 4868 | 21 | 0.431389% |
| C | 4868 | 4167 | 85.599836% |
| D | 4868 | 282 | 5.792933% |
Noise dominated data is calculated using 1-second bins in cleaned event files. If a bin has >2000 counts, and if more than 50% of those come from <1% of pixels, then it is considered to be noise-dominated and hence unusable.
| Quadrant | # 1 sec bins | Bins with >0 counts | Bins with >2000 counts | High rate bins dominated by noise | Noise dominated (total time) | Noise dominated (detector-on time) | Marked lightcurve |
|---|---|---|---|---|---|---|---|
| A | 6992 | 4870 | 18 | 18 | 0.26% | 0.37% | 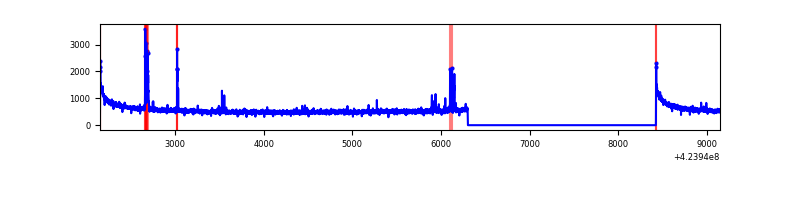 |
| B | 6991 | 4869 | 6 | 6 | 0.09% | 0.12% | 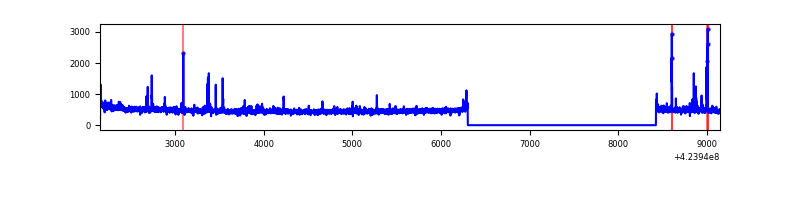 |
| C | 6990 | 4868 | 3671 | 3671 | 52.52% | 75.41% | 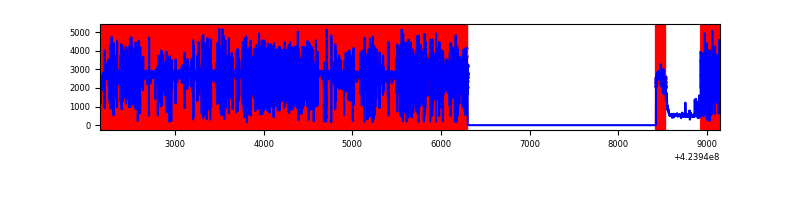 |
| D | 6991 | 4869 | 280 | 280 | 4.01% | 5.75% |  |
Top three noisy pixels from each quadrant. If the there are fewer than three noisy pixels in the level2.evt file, extra rows are filled as -1
| Pixel properties | Quadrant properties | ||||||
|---|---|---|---|---|---|---|---|
| Quadrant | DetID | PixID | Counts | Sigma | Mean | Median | Sigma |
| A | 10 | 83 | 502865 | 4332.05 | 568 | 557 | 116.0 |
| A | 2 | 79 | 58087 | 496.16 | 568 | 557 | 116.0 |
| A | 15 | 223 | 48724 | 415.41 | 568 | 557 | 116.0 |
| B | 0 | 245 | 49621 | 453.7 | 567 | 553 | 108.2 |
| B | 5 | 255 | 44847 | 409.55 | 567 | 553 | 108.2 |
| B | 0 | 186 | 16701 | 149.31 | 567 | 553 | 108.2 |
| C | 0 | 15 | 10383761 | 197537.1 | 223 | 223 | 52.6 |
| C | 0 | 10 | 422159 | 8026.94 | 223 | 223 | 52.6 |
| C | 15 | 214 | 95138 | 1805.67 | 223 | 223 | 52.6 |
| D | 12 | 79 | 1314434 | 10018.71 | 542 | 528 | 131.1 |
| D | 2 | 249 | 511525 | 3896.42 | 542 | 528 | 131.1 |
| D | 1 | 47 | 315115 | 2398.77 | 542 | 528 | 131.1 |
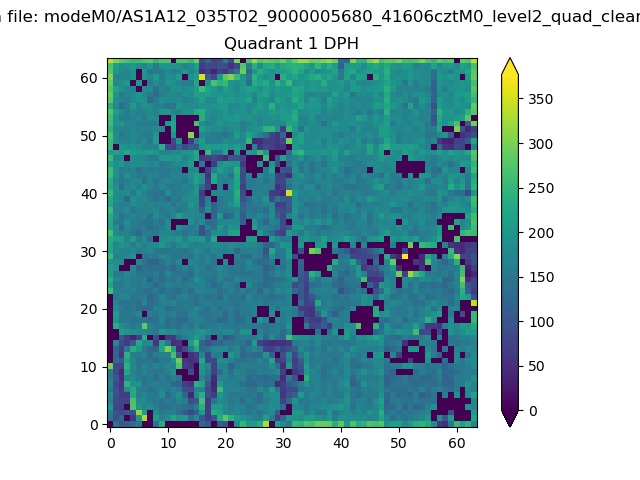
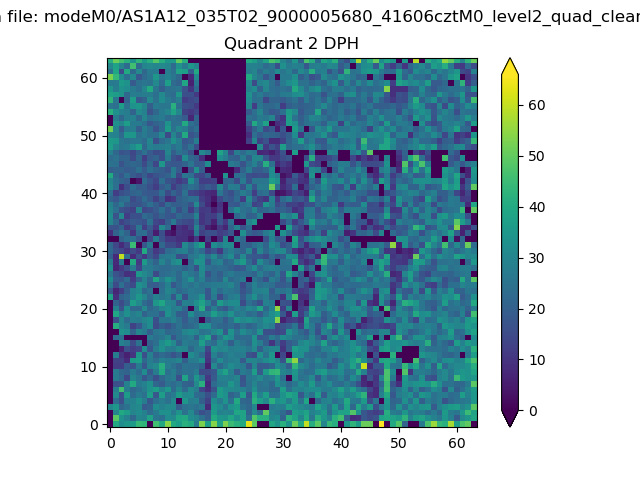
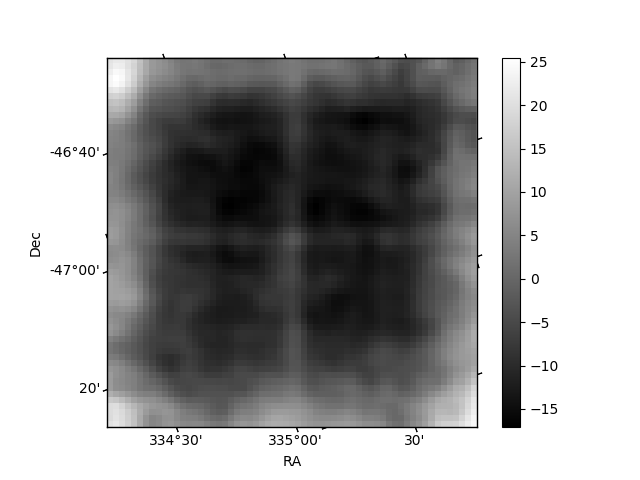
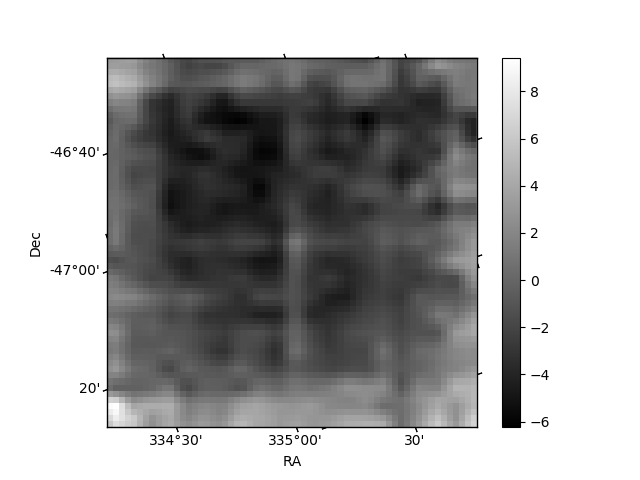
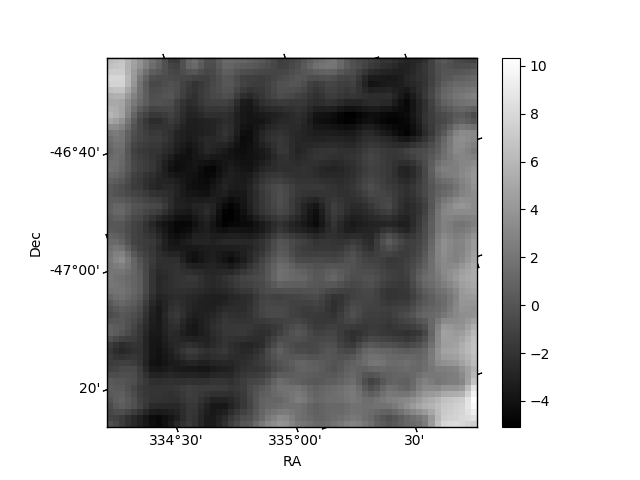
Histogram calculated using DETX and DETY for each event in the final _common_clean file
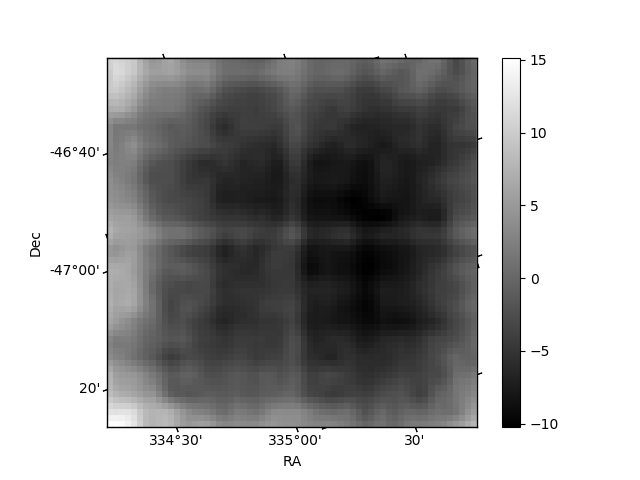
| Quadrant A | 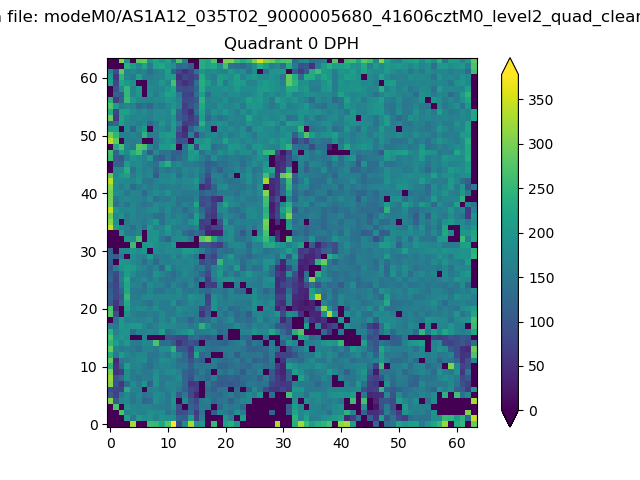 |
 |
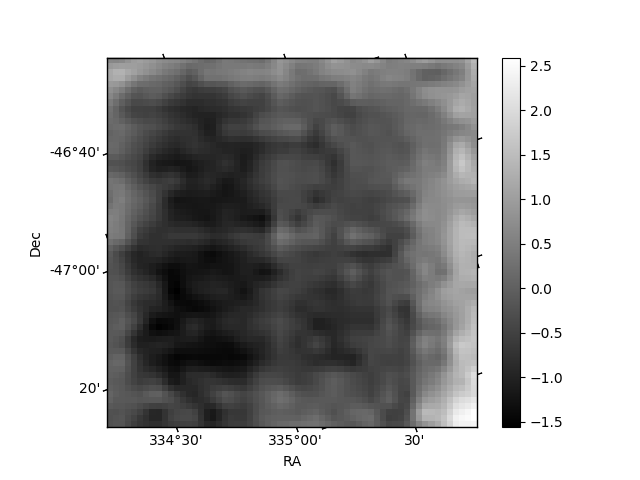
Quadrant B |
|---|---|---|---|
| Quadrant D | 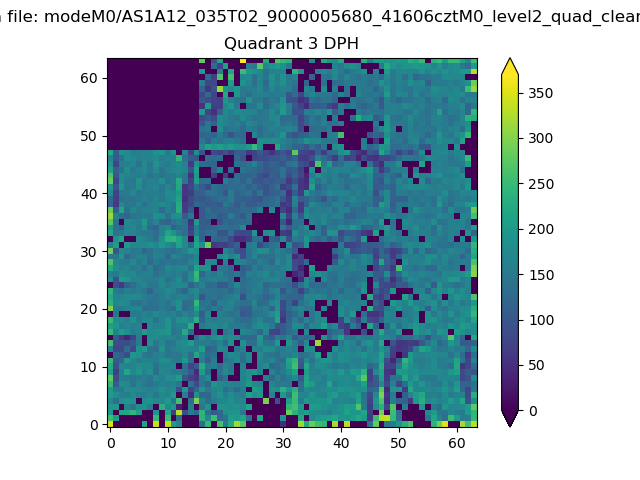 |
 |
Quadrant C |
| Plot type | Count rate plots | Images |
|---|---|---|
| Comparison with Poisson distribution Blue bars denote a histogram of data divided into 1 sec bins. Red curve is a Poisson curve with rate = median count rate of data. |
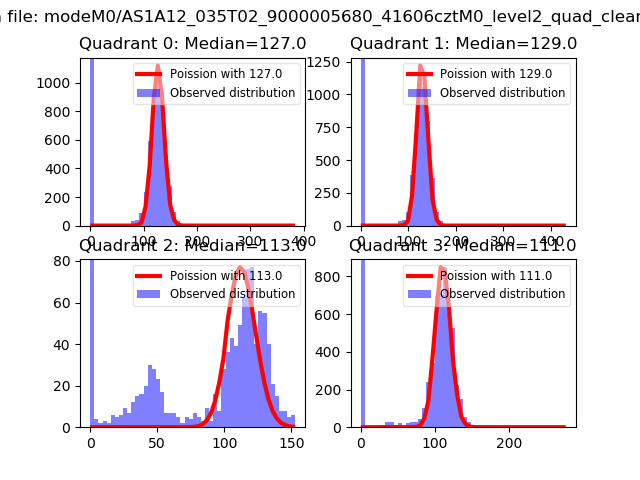 |
 |
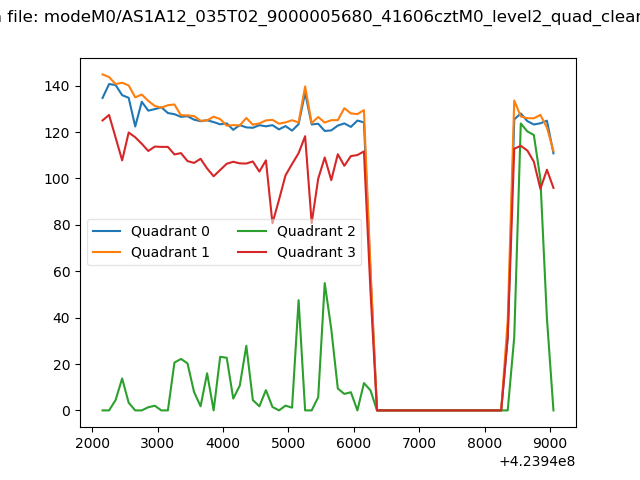
| Quadrant-wise count rates Data is divided into 100 sec bins |
 |
|
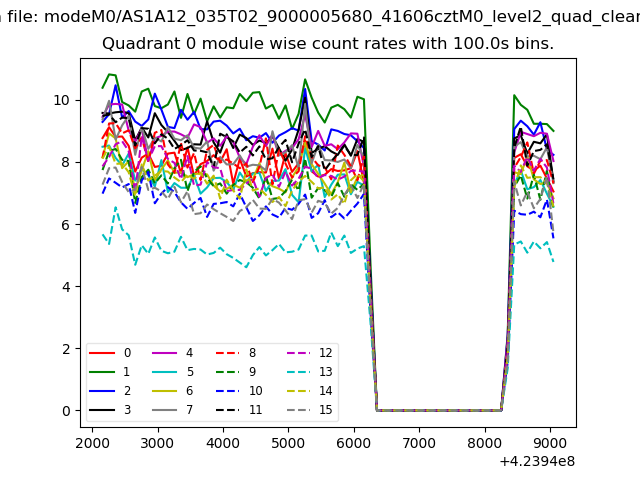
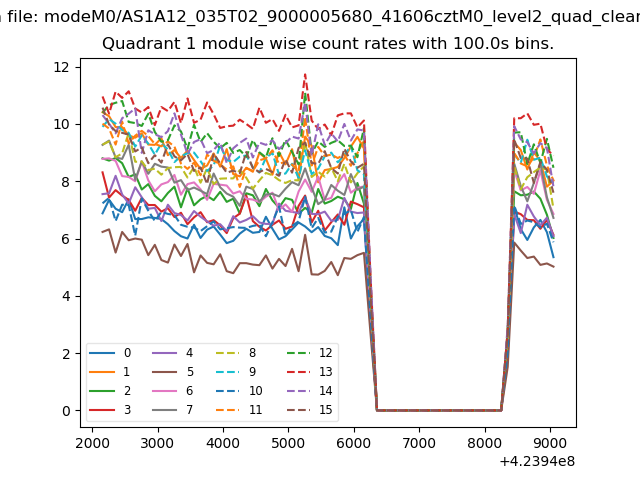
| Module-wise count rates for Quadrant A Data is divided into 100 sec bins |
 |
 |
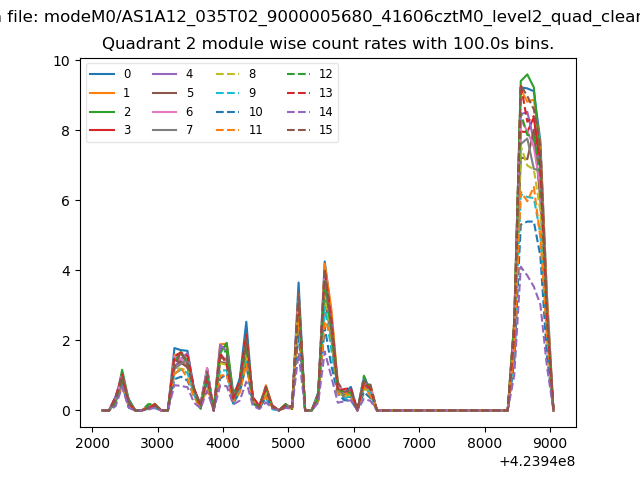
| Module-wise count rates for Quadrant B Data is divided into 100 sec bins |
 |
 |
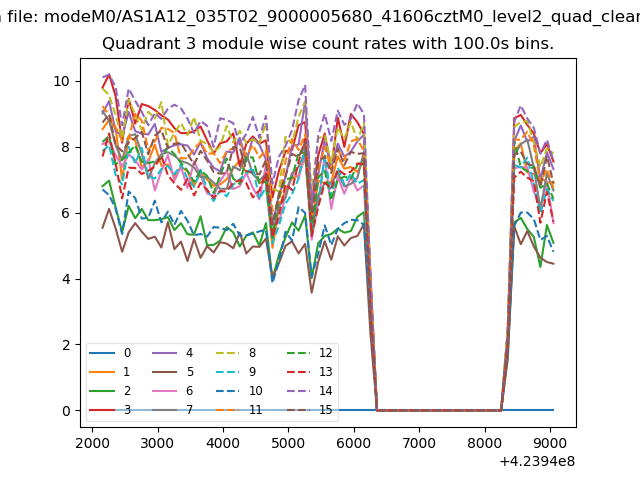
| Module-wise count rates for Quadrant C Data is divided into 100 sec bins |
 |
 |
| Module-wise count rates for Quadrant D Data is divided into 100 sec bins |
 |
 |
| Parameter | Plot |
|---|---|
| CZT HV Monitor | 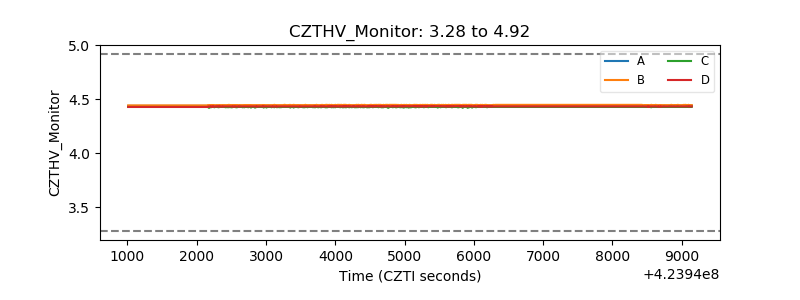 |
| D_VDD | 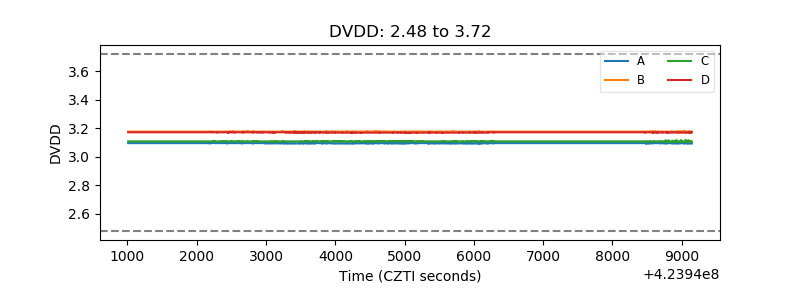 |
| Temperature 1 | 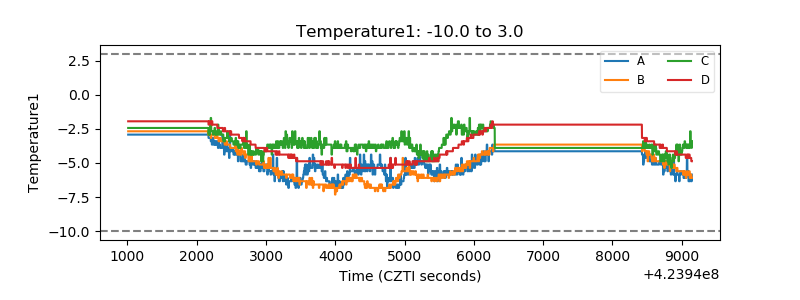 |
| Veto HV Monitor | 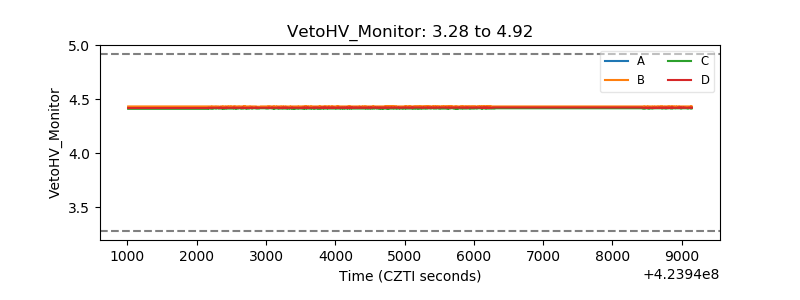 |
| Veto LLD | 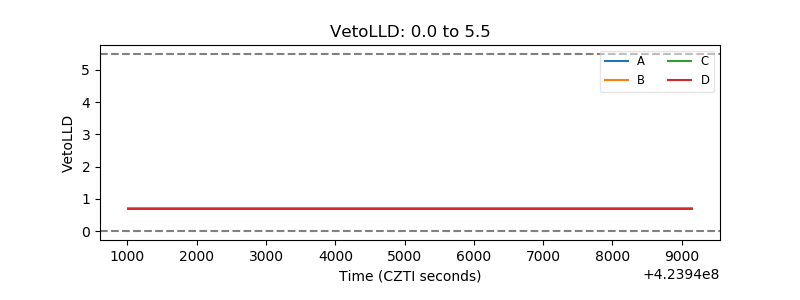 |
| Alpha Counter | 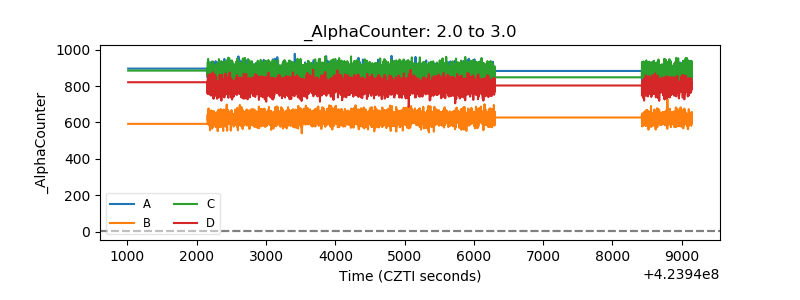 |
| _CPM_Rate | 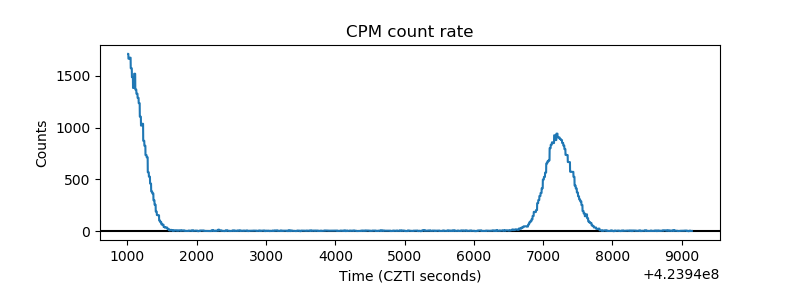 |
| CZT Counter | 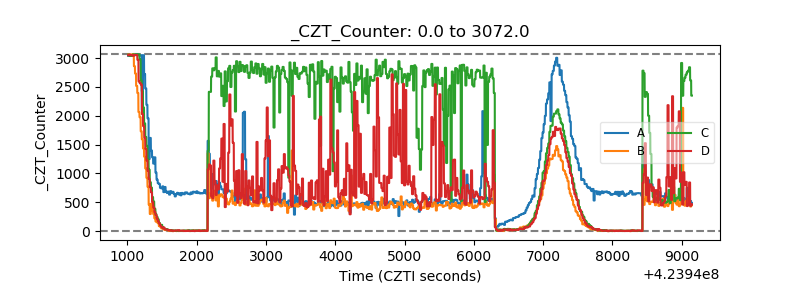 |
| +2.5 Volts monitor | 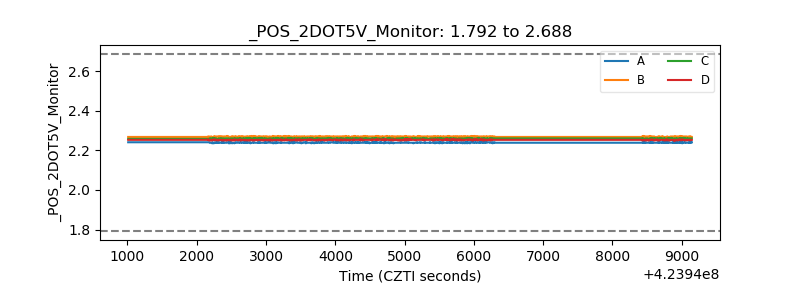 |
| +5 Volts monitor | 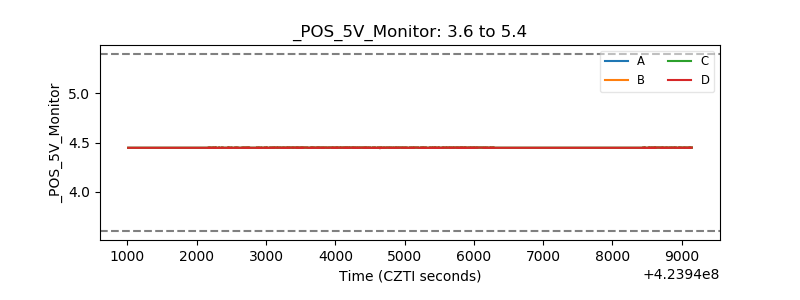 |
| _ROLL_ROT | 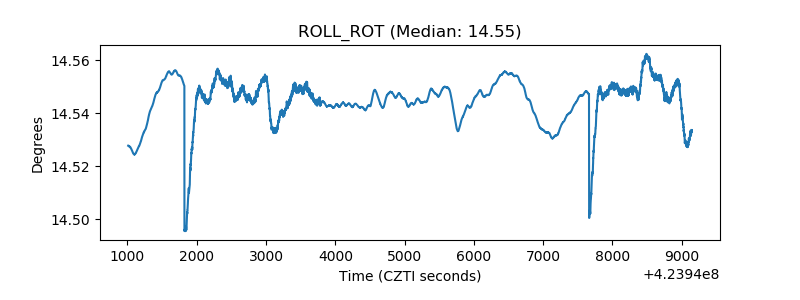 |
| _Roll_DEC | 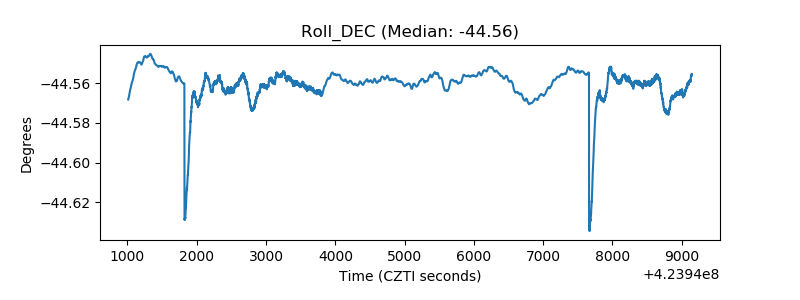 |
| _Roll_RA | 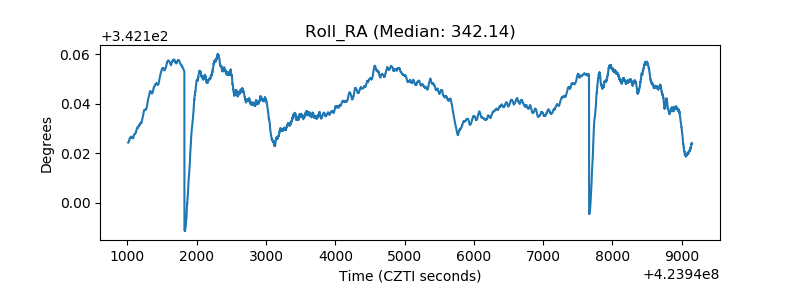 |
| Veto Counter | 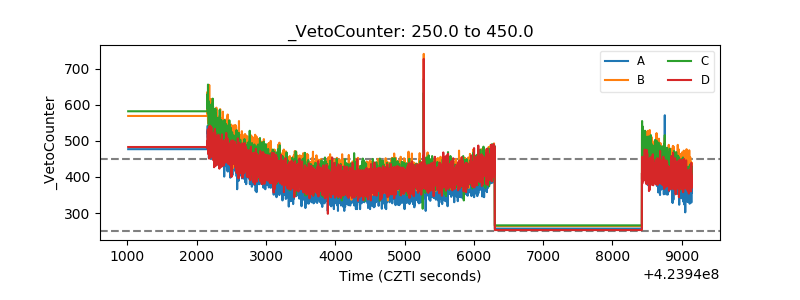 |