| Param | Original file | Final file |
|---|---|---|
| Filename | modeM0/AS1A12_035T02_9000005680_41607cztM0_level2.fits | modeM0/AS1A12_035T02_9000005680_41607cztM0_level2_quad_clean.evt |
| Size (bytes) | 439,303,680 | 78,068,160 |
| Size | 419.0 MB | 74.5 MB |
| Events in quadrant A | 2,685,674 | 584,117 |
| Events in quadrant B | 2,278,764 | 598,016 |
| Events in quadrant C | 5,871,776 | 397,099 |
| Events in quadrant D | 5,039,922 | 437,439 |
| Mode SS | |||
|---|---|---|---|
| Quadrant | BADHDUFLAG | Total packets | Discarded packets |
| A | 0 | 102 | 0 |
| B | 0 | 102 | 0 |
| C | 0 | 102 | 0 |
| D | 0 | 102 | 0 |
| Mode M0 | |||
|---|---|---|---|
| Quadrant | BADHDUFLAG | Total packets | Discarded packets |
| A | 0 | 10929 | 2 |
| B | 0 | 10108 | 2 |
| C | 0 | 20387 | 2 |
| D | 0 | 18447 | 2 |
| Mode M9 | |||
|---|---|---|---|
| Quadrant | BADHDUFLAG | Total packets | Discarded packets |
| A | 0 | 33 | 0 |
| B | 0 | 33 | 0 |
| C | 0 | 34 | 0 |
| D | 0 | 34 | 0 |
| Quadrant | Total seconds | Saturated seconds | Saturation percentage |
|---|---|---|---|
| A | 4945 | 18 | 0.364004% |
| B | 4945 | 15 | 0.303337% |
| C | 4945 | 1508 | 30.495450% |
| D | 4945 | 905 | 18.301314% |
Noise dominated data is calculated using 1-second bins in cleaned event files. If a bin has >2000 counts, and if more than 50% of those come from <1% of pixels, then it is considered to be noise-dominated and hence unusable.
| Quadrant | # 1 sec bins | Bins with >0 counts | Bins with >2000 counts | High rate bins dominated by noise | Noise dominated (total time) | Noise dominated (detector-on time) | Marked lightcurve |
|---|---|---|---|---|---|---|---|
| A | 7008 | 4946 | 3 | 3 | 0.04% | 0.06% | 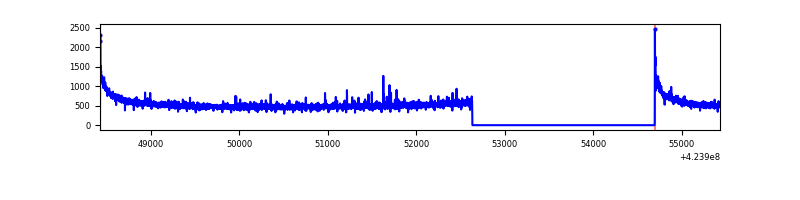 |
| B | 7008 | 4946 | 5 | 5 | 0.07% | 0.10% | 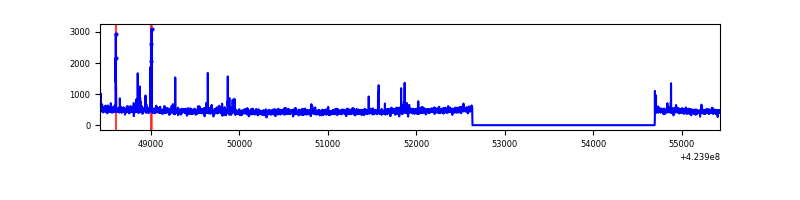 |
| C | 7008 | 4946 | 1304 | 1304 | 18.61% | 26.36% | 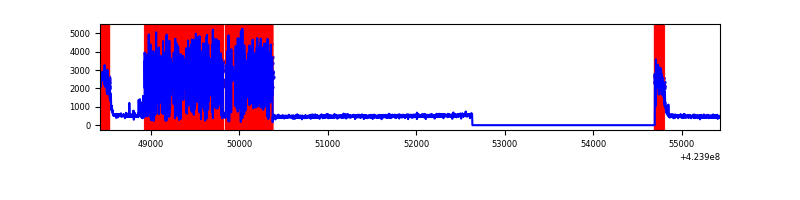 |
| D | 7008 | 4946 | 757 | 757 | 10.80% | 15.31% | 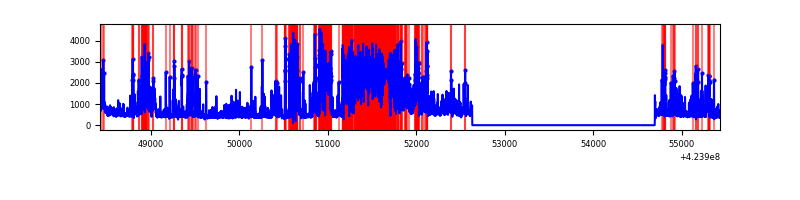 |
Top three noisy pixels from each quadrant. If the there are fewer than three noisy pixels in the level2.evt file, extra rows are filled as -1
| Pixel properties | Quadrant properties | ||||||
|---|---|---|---|---|---|---|---|
| Quadrant | DetID | PixID | Counts | Sigma | Mean | Median | Sigma |
| A | 10 | 83 | 499168 | 4367.84 | 555 | 544 | 114.2 |
| A | 2 | 79 | 24714 | 211.72 | 555 | 544 | 114.2 |
| A | 13 | 254 | 8393 | 68.76 | 555 | 544 | 114.2 |
| B | 5 | 255 | 51096 | 471.11 | 554 | 539 | 107.3 |
| B | 0 | 245 | 27614 | 252.3 | 554 | 539 | 107.3 |
| B | 15 | 35 | 14828 | 133.15 | 554 | 539 | 107.3 |
| C | 0 | 15 | 3424166 | 33345.21 | 440 | 443 | 102.7 |
| C | 0 | 10 | 538343 | 5238.85 | 440 | 443 | 102.7 |
| C | 15 | 214 | 180964 | 1758.18 | 440 | 443 | 102.7 |
| D | 13 | 249 | 1942085 | 15854.0 | 492 | 477 | 122.5 |
| D | 2 | 249 | 608419 | 4964.09 | 492 | 477 | 122.5 |
| D | 12 | 79 | 502589 | 4099.94 | 492 | 477 | 122.5 |
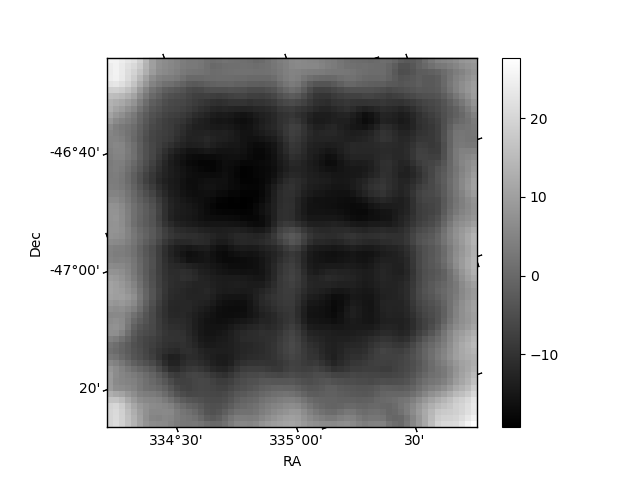
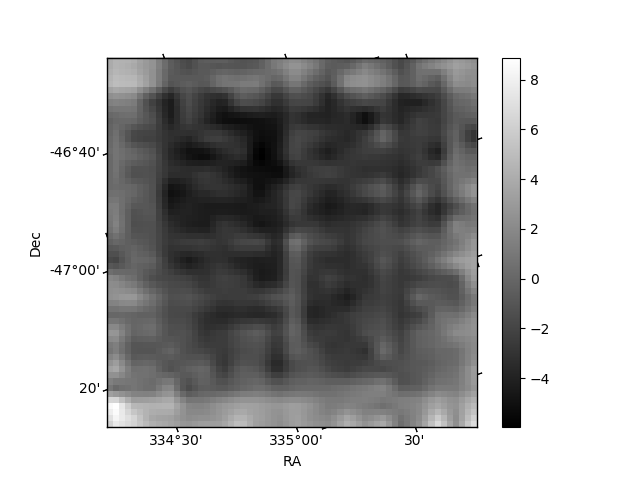
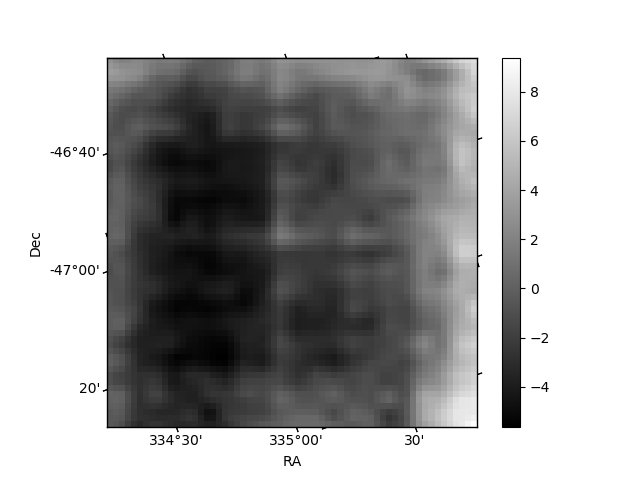
Histogram calculated using DETX and DETY for each event in the final _common_clean file
| Quadrant A | 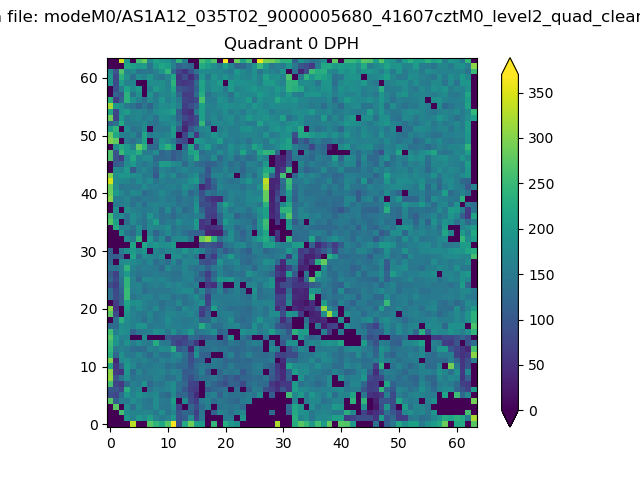 |
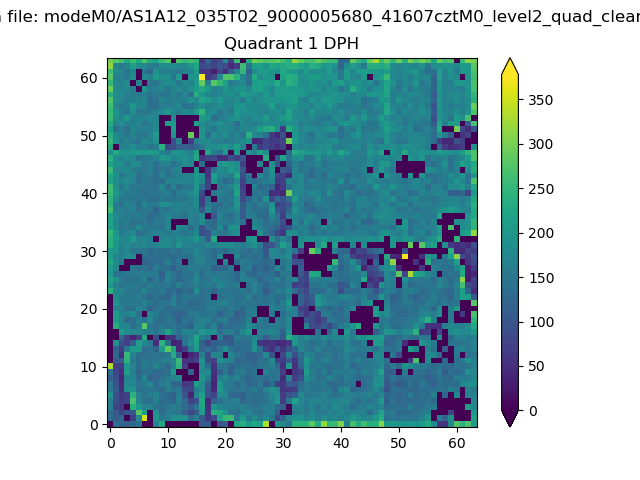 |
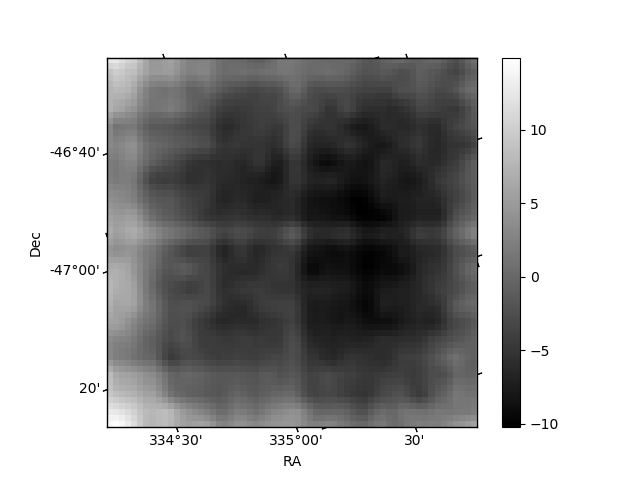
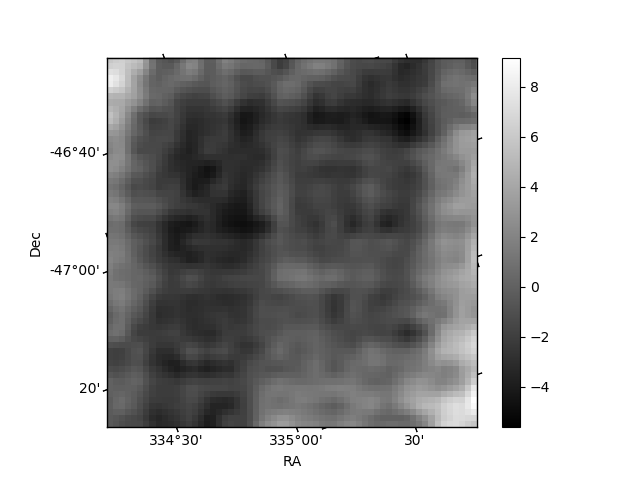
Quadrant B |
|---|---|---|---|
| Quadrant D | 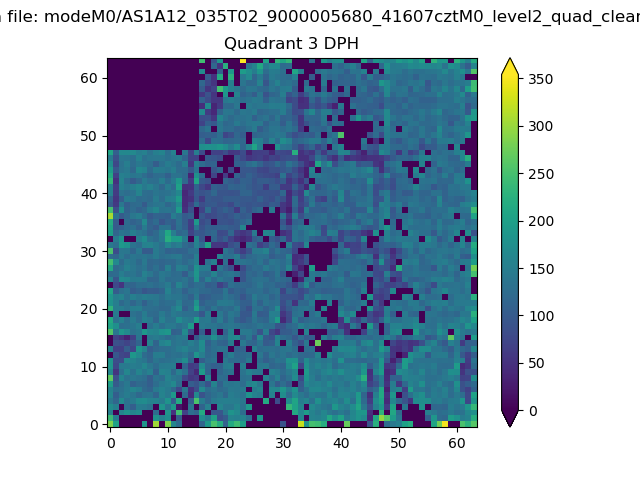 |
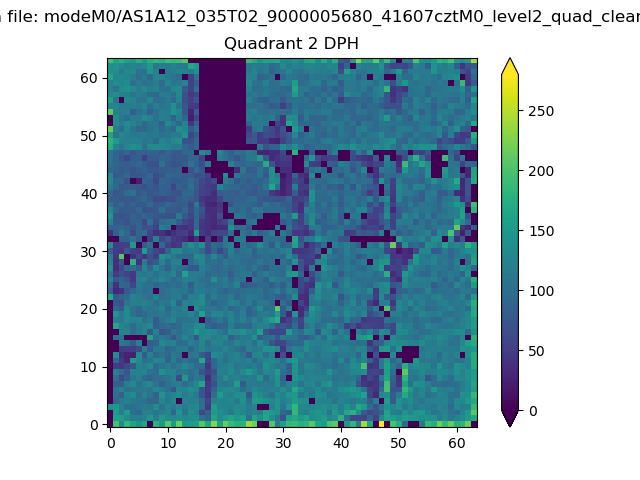 |
Quadrant C |
| Plot type | Count rate plots | Images |
|---|---|---|
| Comparison with Poisson distribution Blue bars denote a histogram of data divided into 1 sec bins. Red curve is a Poisson curve with rate = median count rate of data. |
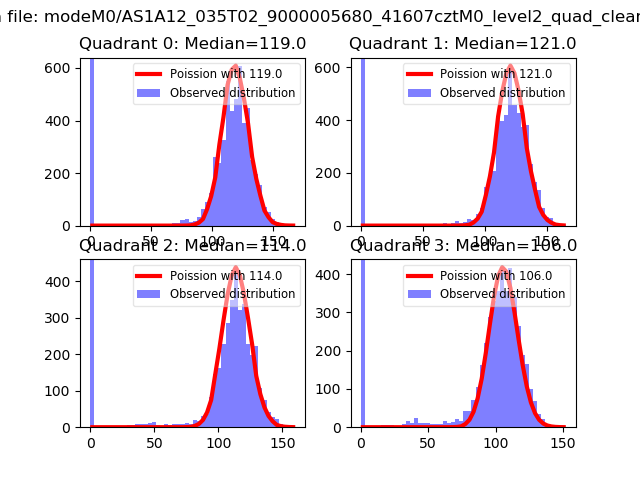 |
 |
| Quadrant-wise count rates Data is divided into 100 sec bins |
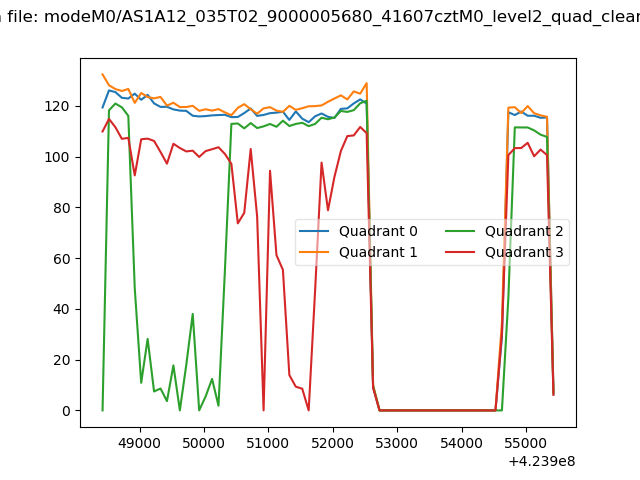 |
|
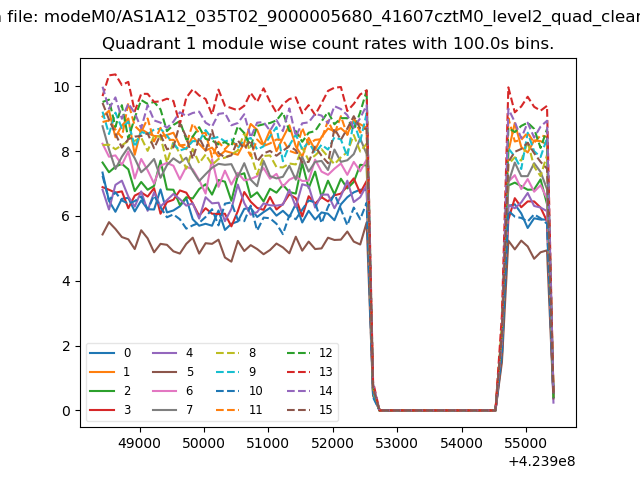
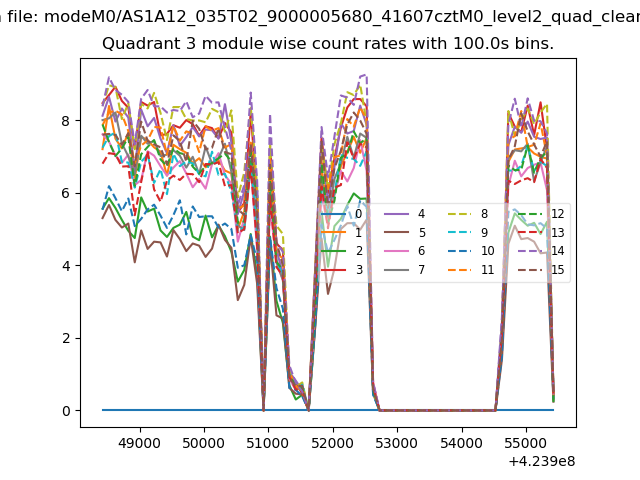
| Module-wise count rates for Quadrant A Data is divided into 100 sec bins |
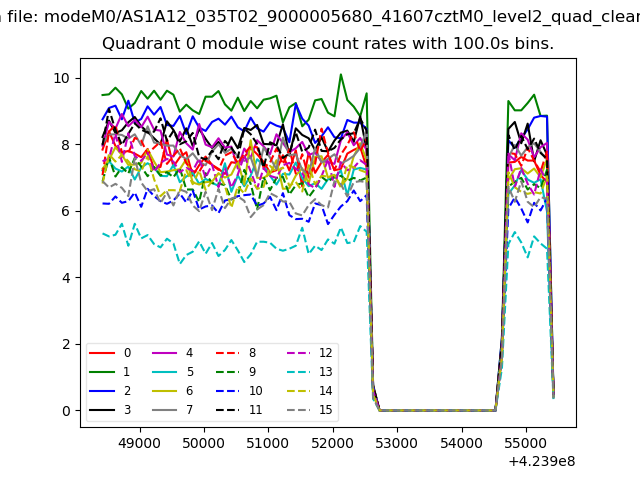 |
 |
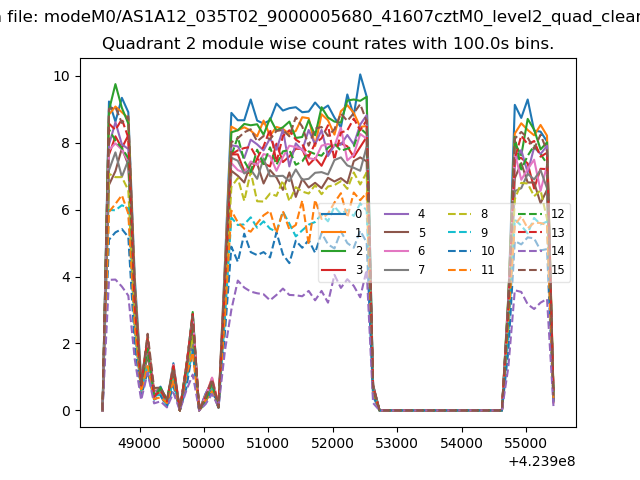
| Module-wise count rates for Quadrant B Data is divided into 100 sec bins |
 |
 |
| Module-wise count rates for Quadrant C Data is divided into 100 sec bins |
 |
 |
| Module-wise count rates for Quadrant D Data is divided into 100 sec bins |
 |
 |
| Parameter | Plot |
|---|---|
| CZT HV Monitor | 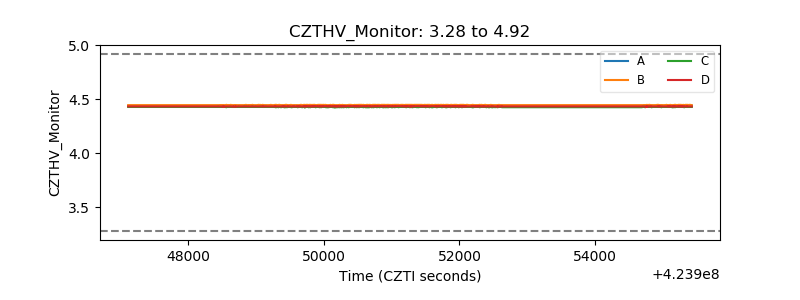 |
| D_VDD | 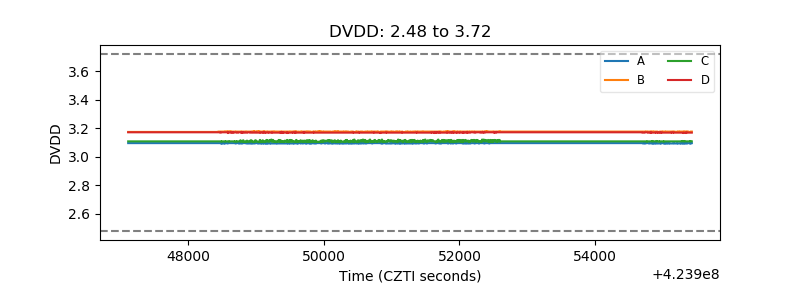 |
| Temperature 1 | 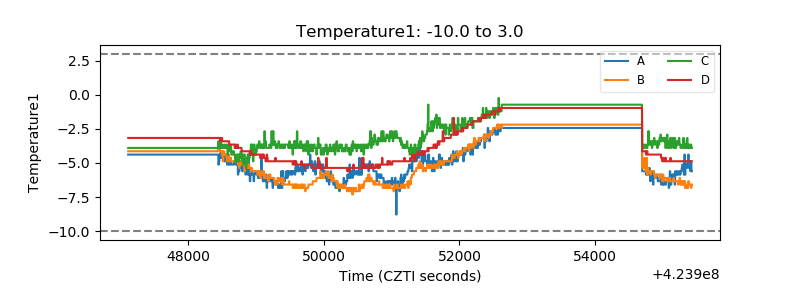 |
| Veto HV Monitor | 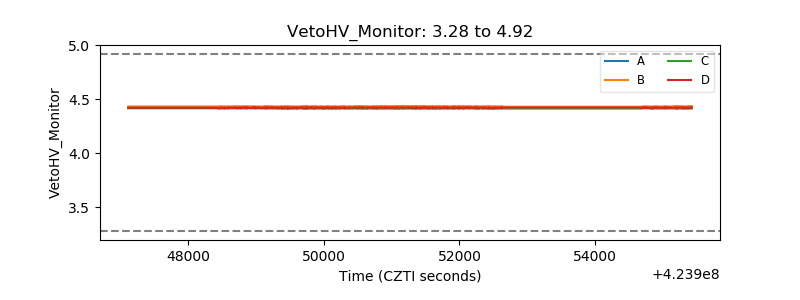 |
| Veto LLD | 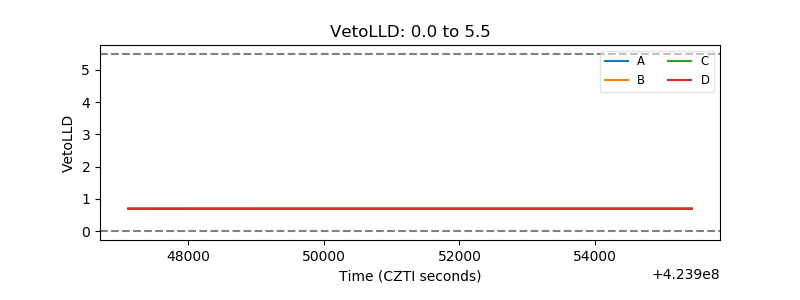 |
| Alpha Counter | 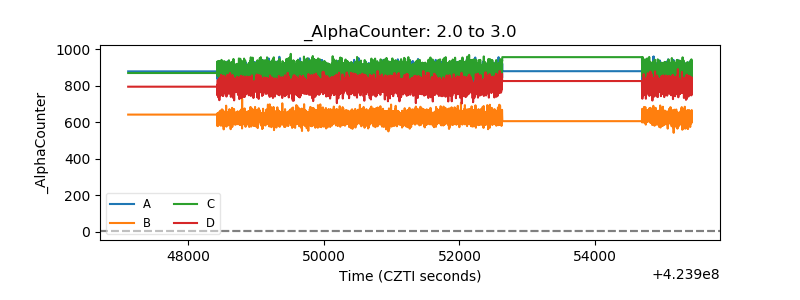 |
| _CPM_Rate | 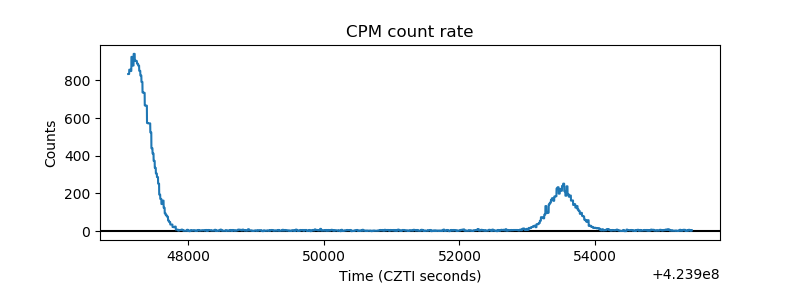 |
| CZT Counter | 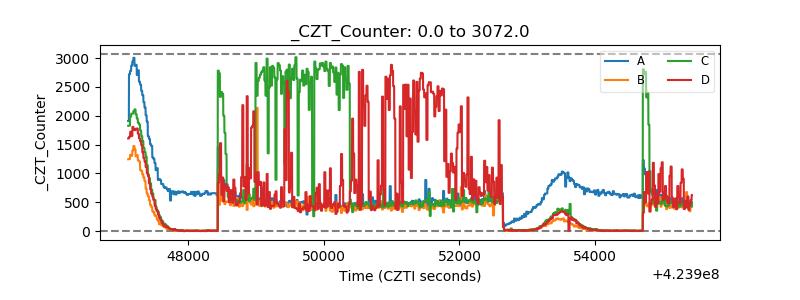 |
| +2.5 Volts monitor | 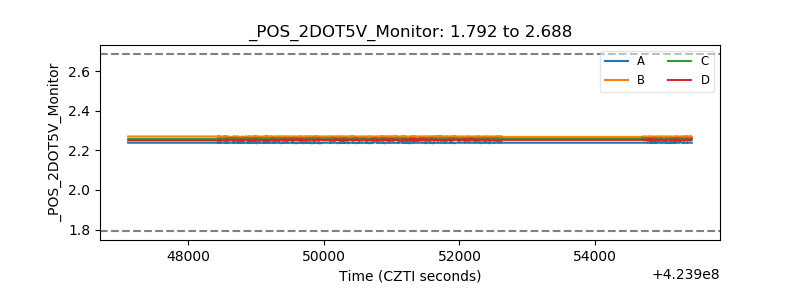 |
| +5 Volts monitor | 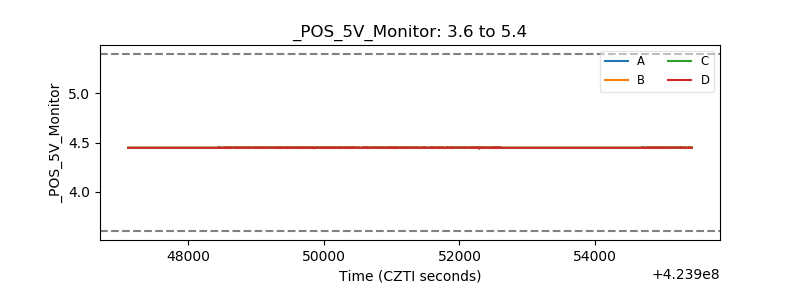 |
| _ROLL_ROT | 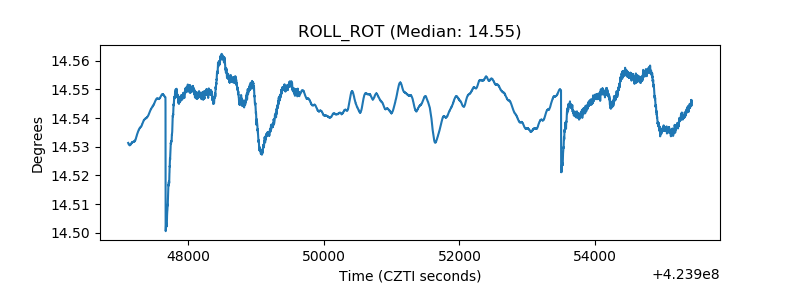 |
| _Roll_DEC | 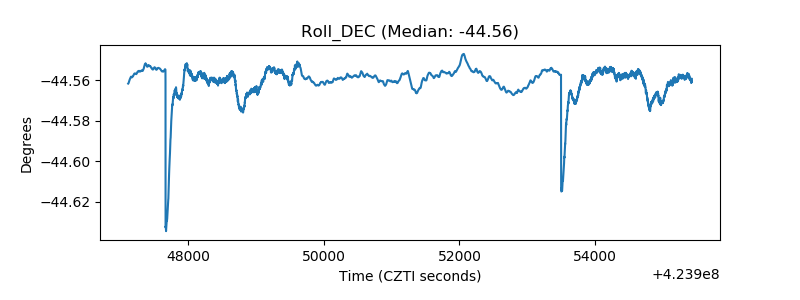 |
| _Roll_RA | 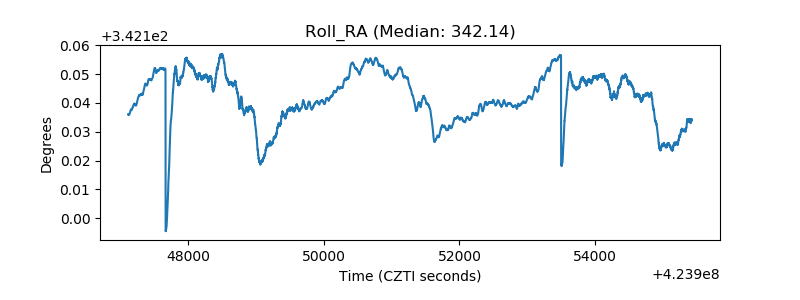 |
| Veto Counter | 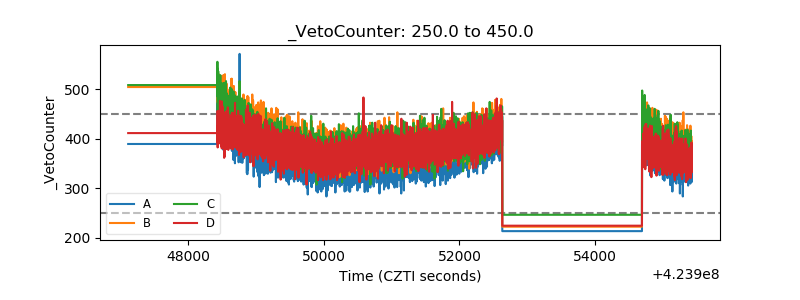 |