| Param | Original file | Final file |
|---|---|---|
| Filename | modeM0/AS1A12_035T02_9000005680_41608cztM0_level2.fits | modeM0/AS1A12_035T02_9000005680_41608cztM0_level2_quad_clean.evt |
| Size (bytes) | 347,400,000 | 88,873,920 |
| Size | 331.3 MB | 84.8 MB |
| Events in quadrant A | 2,830,138 | 604,922 |
| Events in quadrant B | 2,553,093 | 617,794 |
| Events in quadrant C | 2,994,669 | 566,830 |
| Events in quadrant D | 4,065,240 | 526,874 |
| Mode SS | |||
|---|---|---|---|
| Quadrant | BADHDUFLAG | Total packets | Discarded packets |
| A | 0 | 112 | 0 |
| B | 0 | 112 | 0 |
| C | 0 | 112 | 0 |
| D | 0 | 112 | 0 |
| Mode M0 | |||
|---|---|---|---|
| Quadrant | BADHDUFLAG | Total packets | Discarded packets |
| A | 0 | 11636 | 2 |
| B | 0 | 11352 | 2 |
| C | 0 | 12159 | 2 |
| D | 0 | 15841 | 3 |
| Mode M9 | |||
|---|---|---|---|
| Quadrant | BADHDUFLAG | Total packets | Discarded packets |
| A | 0 | 38 | 0 |
| B | 0 | 38 | 0 |
| C | 0 | 38 | 0 |
| D | 0 | 38 | 0 |
| Quadrant | Total seconds | Saturated seconds | Saturation percentage |
|---|---|---|---|
| A | 5347 | 11 | 0.205723% |
| B | 5348 | 23 | 0.430067% |
| C | 5348 | 182 | 3.403141% |
| D | 5347 | 249 | 4.656817% |
Noise dominated data is calculated using 1-second bins in cleaned event files. If a bin has >2000 counts, and if more than 50% of those come from <1% of pixels, then it is considered to be noise-dominated and hence unusable.
| Quadrant | # 1 sec bins | Bins with >0 counts | Bins with >2000 counts | High rate bins dominated by noise | Noise dominated (total time) | Noise dominated (detector-on time) | Marked lightcurve |
|---|---|---|---|---|---|---|---|
| A | 9233 | 5349 | 2 | 2 | 0.02% | 0.04% | 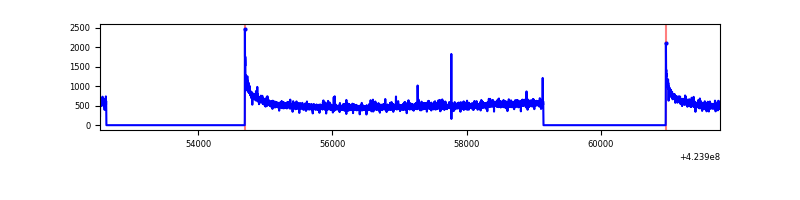 |
| B | 9234 | 5350 | 2 | 2 | 0.02% | 0.04% | 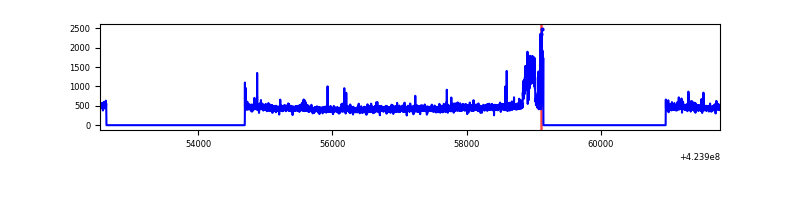 |
| C | 9234 | 5350 | 171 | 171 | 1.85% | 3.20% | 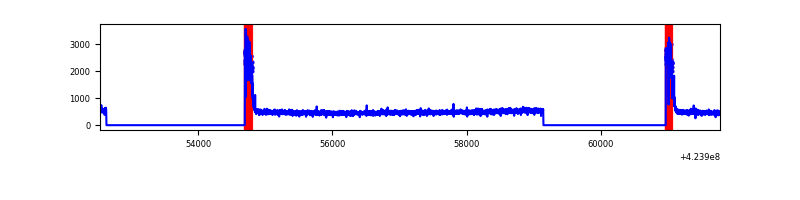 |
| D | 9233 | 5349 | 208 | 208 | 2.25% | 3.89% | 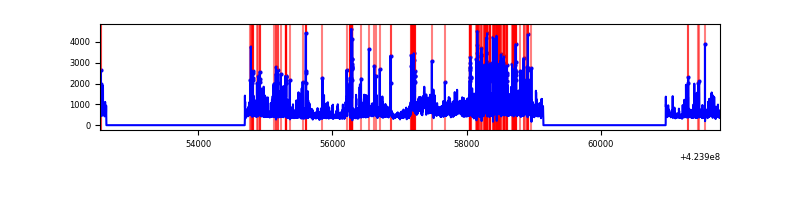 |
Top three noisy pixels from each quadrant. If the there are fewer than three noisy pixels in the level2.evt file, extra rows are filled as -1
| Pixel properties | Quadrant properties | ||||||
|---|---|---|---|---|---|---|---|
| Quadrant | DetID | PixID | Counts | Sigma | Mean | Median | Sigma |
| A | 10 | 83 | 521928 | 4315.31 | 589 | 578 | 120.8 |
| A | 2 | 79 | 18742 | 150.35 | 589 | 578 | 120.8 |
| A | 13 | 254 | 9169 | 71.11 | 589 | 578 | 120.8 |
| B | 0 | 186 | 182102 | 1594.36 | 585 | 569 | 113.9 |
| B | 0 | 245 | 35360 | 305.56 | 585 | 569 | 113.9 |
| B | 12 | 111 | 14282 | 120.44 | 585 | 569 | 113.9 |
| C | 0 | 10 | 527217 | 3959.37 | 568 | 572 | 133.0 |
| C | 15 | 214 | 233821 | 1753.59 | 568 | 572 | 133.0 |
| C | 0 | 15 | 10703 | 76.17 | 568 | 572 | 133.0 |
| D | 12 | 79 | 886402 | 6340.84 | 567 | 551 | 139.7 |
| D | 13 | 249 | 604767 | 4324.93 | 567 | 551 | 139.7 |
| D | 2 | 249 | 280060 | 2000.7 | 567 | 551 | 139.7 |
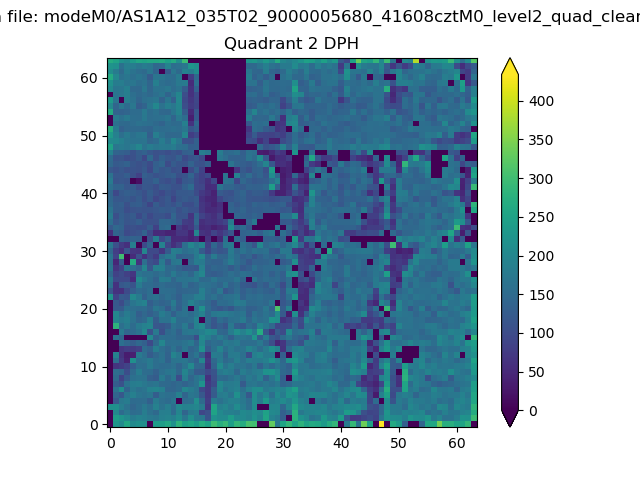
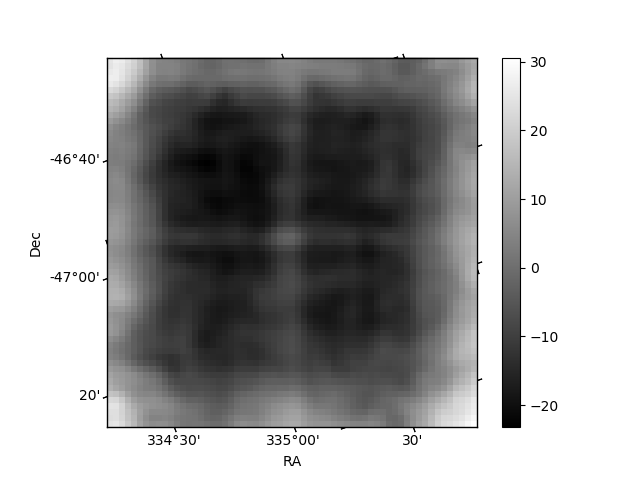
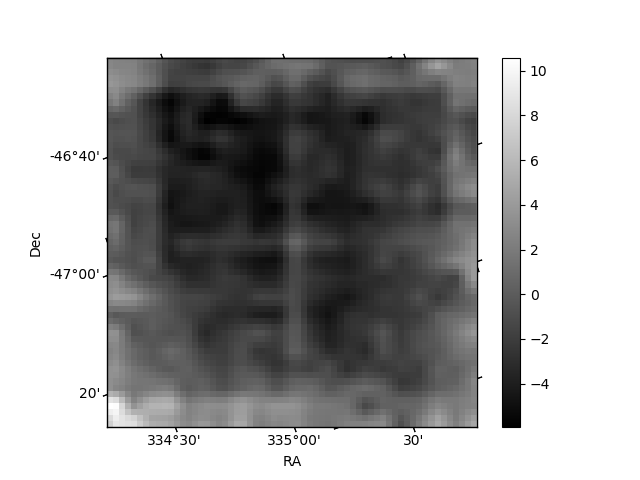
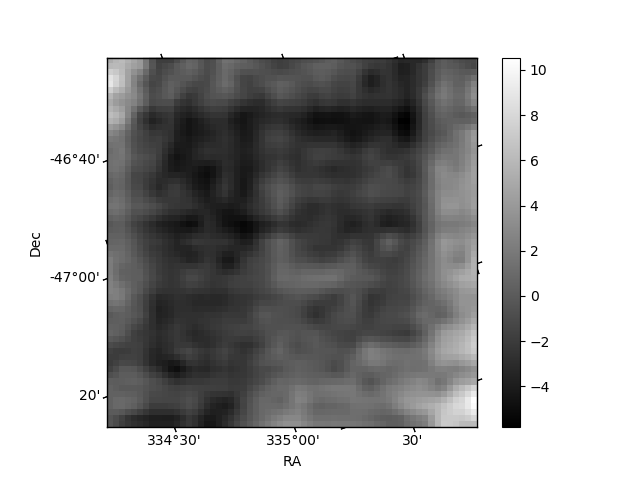
Histogram calculated using DETX and DETY for each event in the final _common_clean file
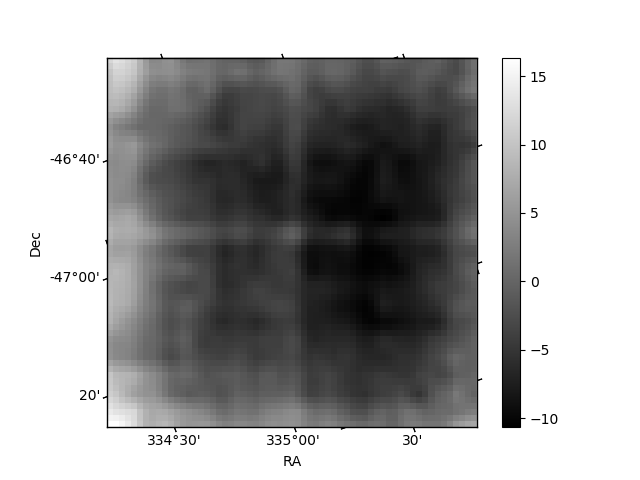
| Quadrant A | 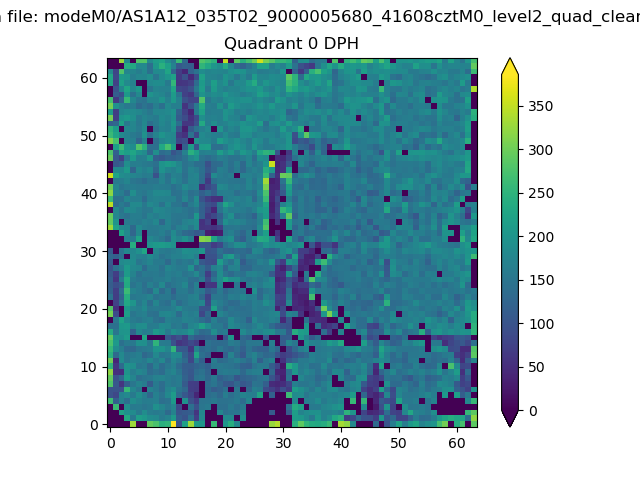 |
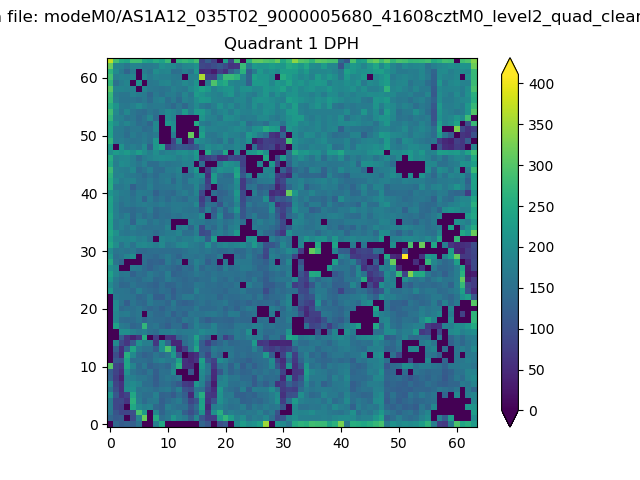 |
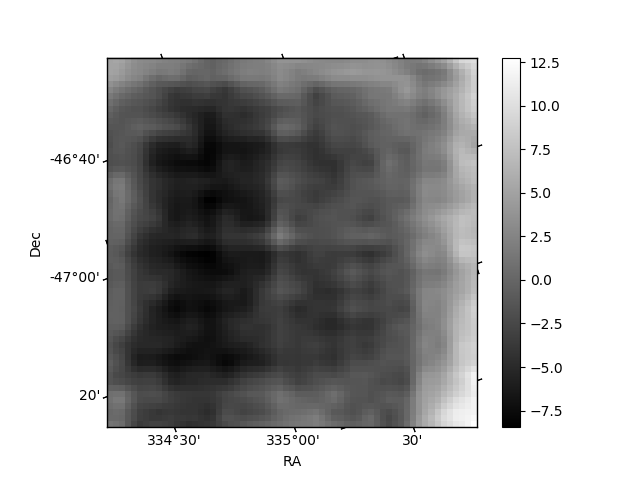
Quadrant B |
|---|---|---|---|
| Quadrant D | 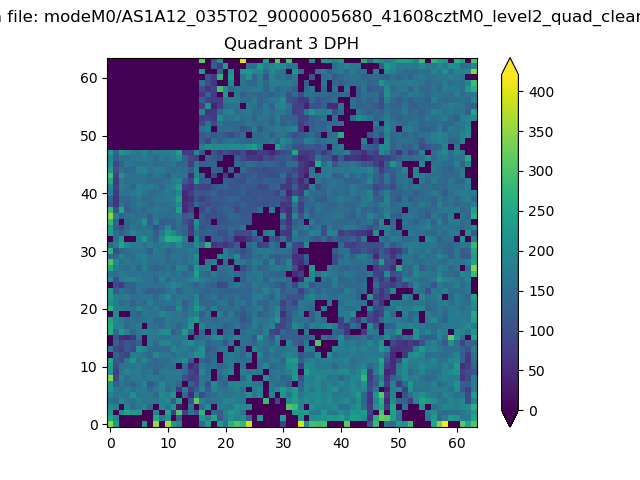 |
 |
Quadrant C |
| Plot type | Count rate plots | Images |
|---|---|---|
| Comparison with Poisson distribution Blue bars denote a histogram of data divided into 1 sec bins. Red curve is a Poisson curve with rate = median count rate of data. |
 |
 |
| Quadrant-wise count rates Data is divided into 100 sec bins |
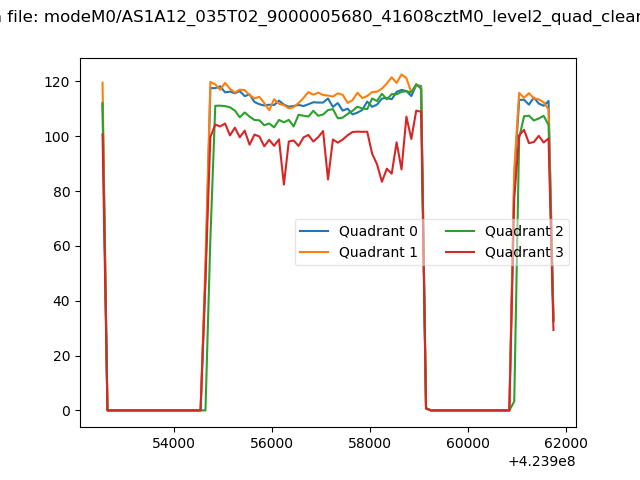 |
|
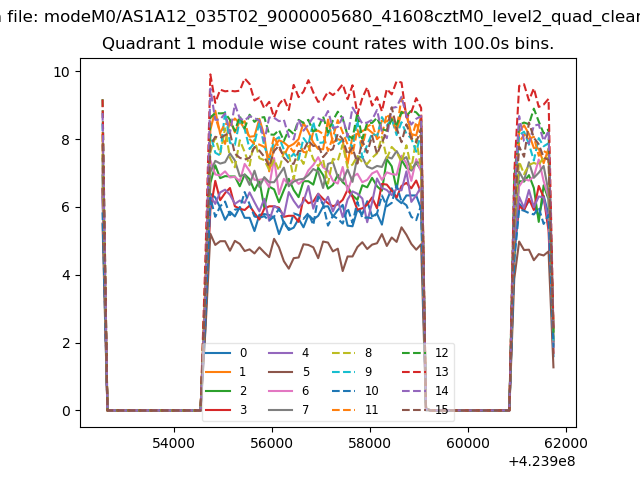
| Module-wise count rates for Quadrant A Data is divided into 100 sec bins |
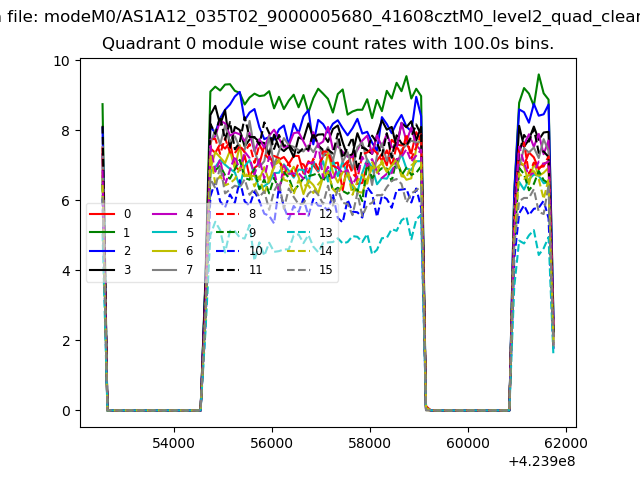 |
 |
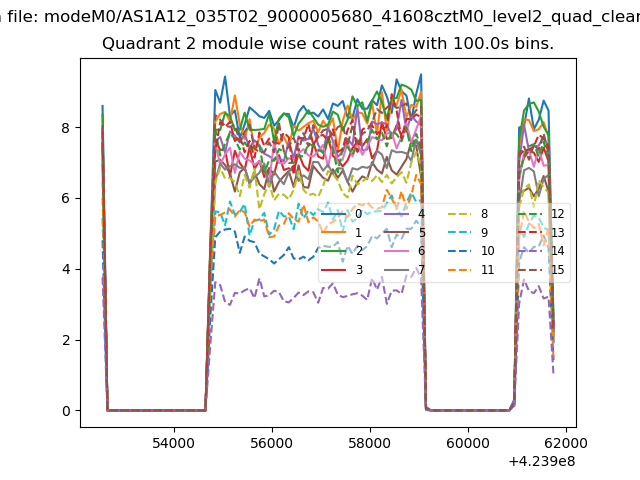
| Module-wise count rates for Quadrant B Data is divided into 100 sec bins |
 |
 |
| Module-wise count rates for Quadrant C Data is divided into 100 sec bins |
 |
 |
| Module-wise count rates for Quadrant D Data is divided into 100 sec bins |
 |
 |
| Parameter | Plot |
|---|---|
| CZT HV Monitor | 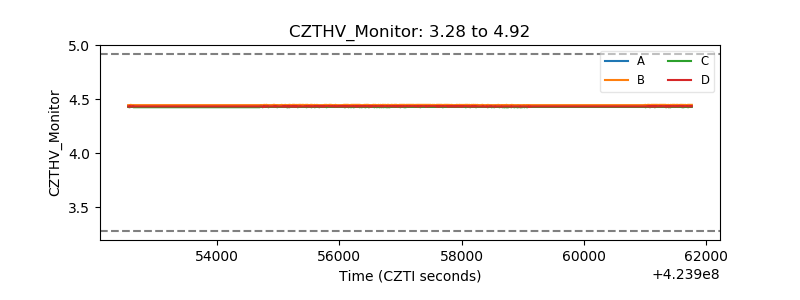 |
| D_VDD | 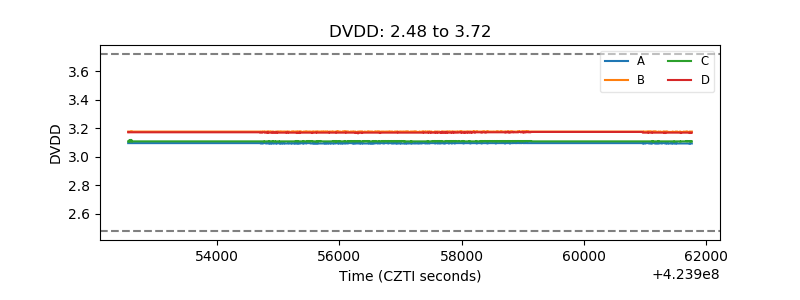 |
| Temperature 1 | 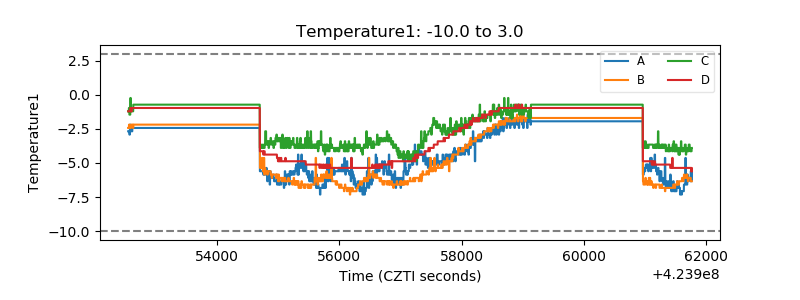 |
| Veto HV Monitor | 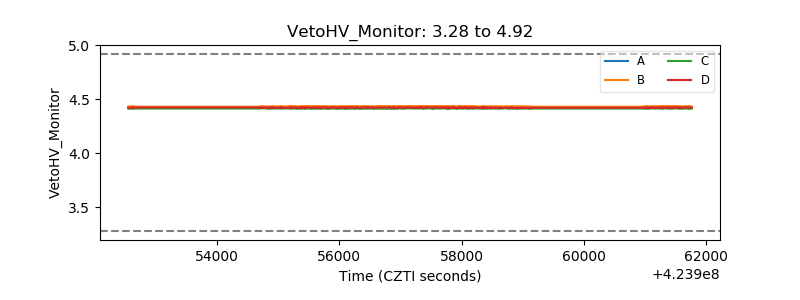 |
| Veto LLD | 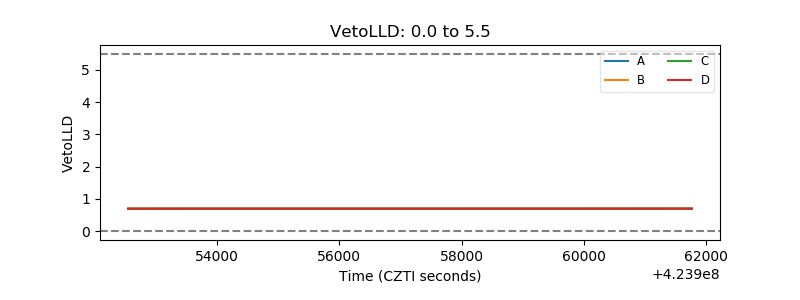 |
| Alpha Counter | 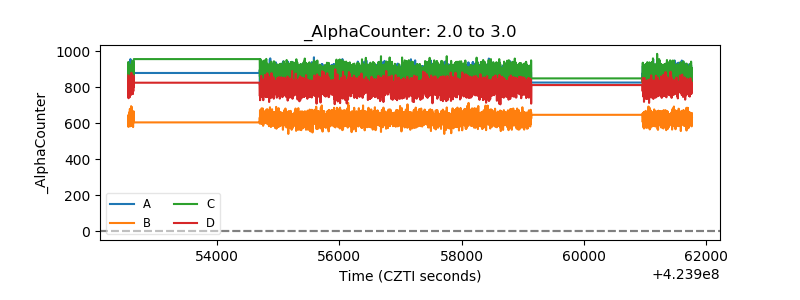 |
| _CPM_Rate | 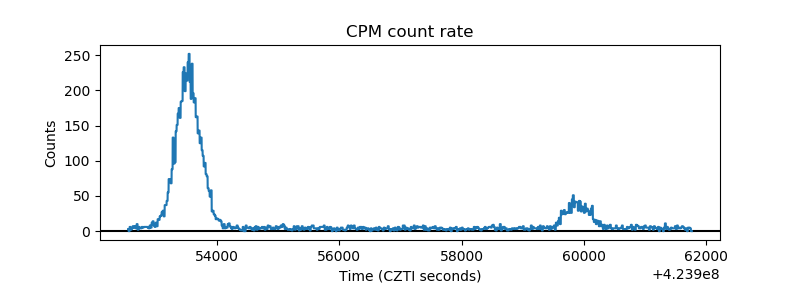 |
| CZT Counter | 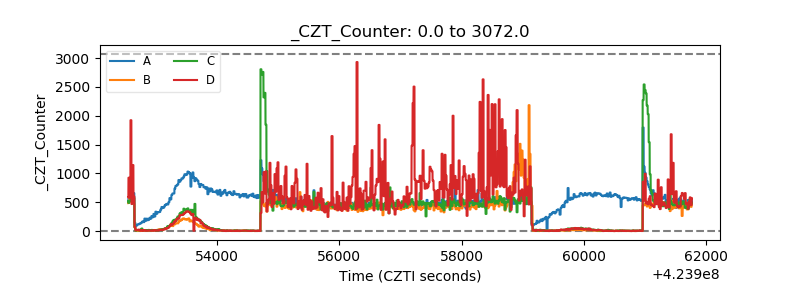 |
| +2.5 Volts monitor | 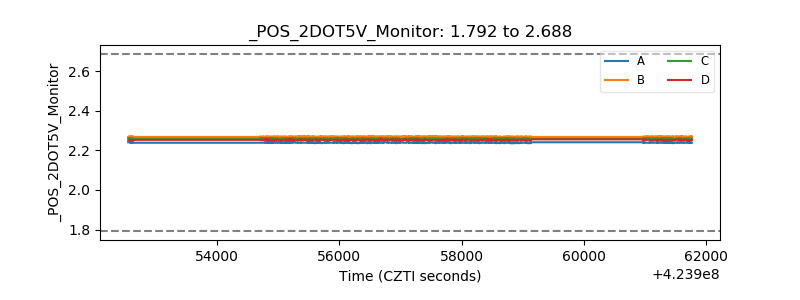 |
| +5 Volts monitor | 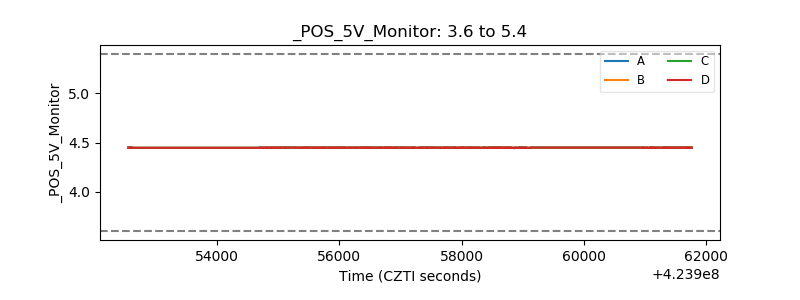 |
| _ROLL_ROT | 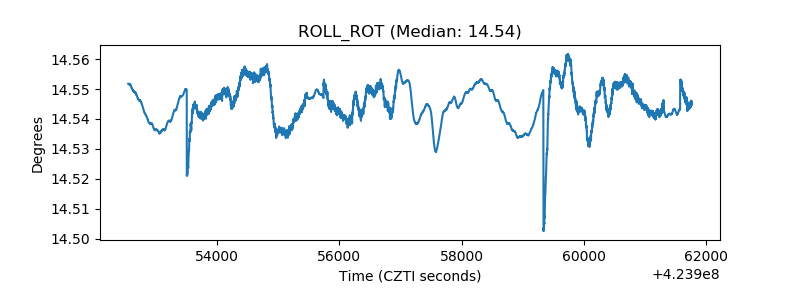 |
| _Roll_DEC | 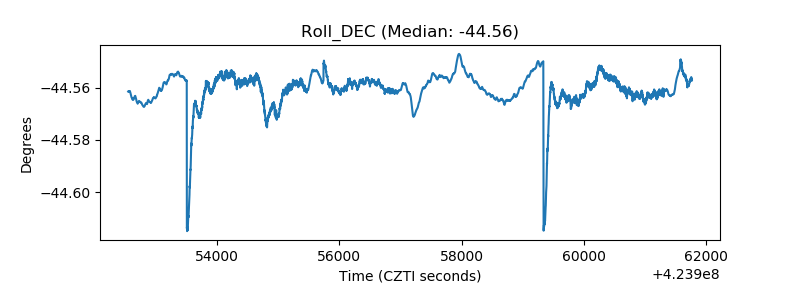 |
| _Roll_RA | 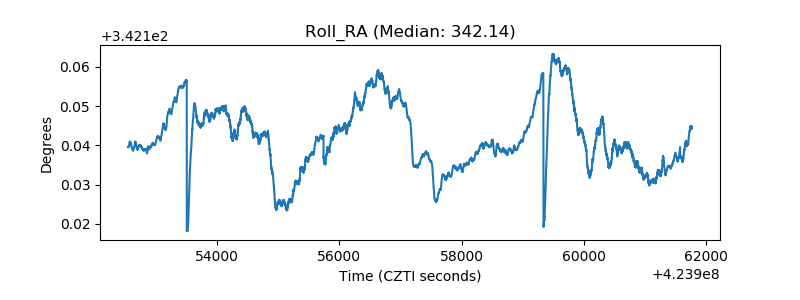 |
| Veto Counter | 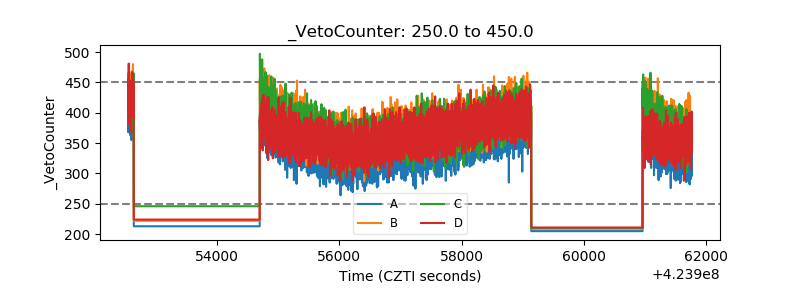 |