| Param | Original file | Final file |
|---|---|---|
| Filename | modeM0/AS1A12_035T02_9000005680_41609cztM0_level2.fits | modeM0/AS1A12_035T02_9000005680_41609cztM0_level2_quad_clean.evt |
| Size (bytes) | 438,526,080 | 98,965,440 |
| Size | 418.2 MB | 94.4 MB |
| Events in quadrant A | 3,212,439 | 676,459 |
| Events in quadrant B | 3,081,464 | 690,843 |
| Events in quadrant C | 3,393,327 | 643,822 |
| Events in quadrant D | 6,072,757 | 560,053 |
| Mode SS | |||
|---|---|---|---|
| Quadrant | BADHDUFLAG | Total packets | Discarded packets |
| A | 0 | 128 | 0 |
| B | 0 | 128 | 0 |
| C | 0 | 128 | 0 |
| D | 0 | 128 | 0 |
| Mode M0 | |||
|---|---|---|---|
| Quadrant | BADHDUFLAG | Total packets | Discarded packets |
| A | 0 | 13213 | 2 |
| B | 0 | 13455 | 2 |
| C | 0 | 13648 | 2 |
| D | 0 | 22195 | 2 |
| Mode M9 | |||
|---|---|---|---|
| Quadrant | BADHDUFLAG | Total packets | Discarded packets |
| A | 0 | 32 | 0 |
| B | 0 | 32 | 0 |
| C | 0 | 32 | 0 |
| D | 0 | 32 | 0 |
| Quadrant | Total seconds | Saturated seconds | Saturation percentage |
|---|---|---|---|
| A | 6081 | 10 | 0.164447% |
| B | 6082 | 29 | 0.476817% |
| C | 6082 | 165 | 2.712923% |
| D | 6082 | 717 | 11.788885% |
Noise dominated data is calculated using 1-second bins in cleaned event files. If a bin has >2000 counts, and if more than 50% of those come from <1% of pixels, then it is considered to be noise-dominated and hence unusable.
| Quadrant | # 1 sec bins | Bins with >0 counts | Bins with >2000 counts | High rate bins dominated by noise | Noise dominated (total time) | Noise dominated (detector-on time) | Marked lightcurve |
|---|---|---|---|---|---|---|---|
| A | 9366 | 6083 | 2 | 2 | 0.02% | 0.03% | 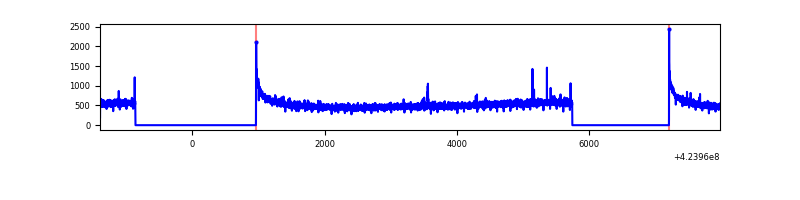 |
| B | 9367 | 6084 | 2 | 2 | 0.02% | 0.03% | 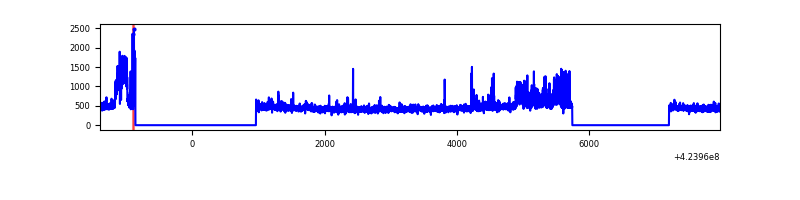 |
| C | 9367 | 6084 | 156 | 156 | 1.67% | 2.56% | 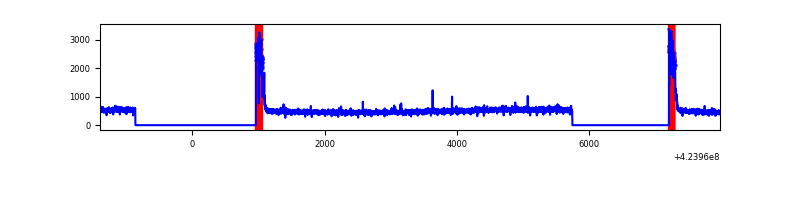 |
| D | 9367 | 6084 | 697 | 697 | 7.44% | 11.46% | 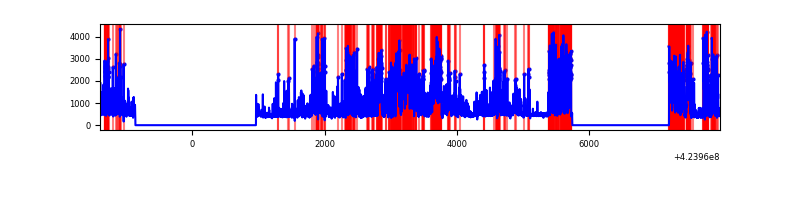 |
Top three noisy pixels from each quadrant. If the there are fewer than three noisy pixels in the level2.evt file, extra rows are filled as -1
| Pixel properties | Quadrant properties | ||||||
|---|---|---|---|---|---|---|---|
| Quadrant | DetID | PixID | Counts | Sigma | Mean | Median | Sigma |
| A | 10 | 83 | 569733 | 4052.96 | 677 | 662 | 140.4 |
| A | 2 | 79 | 12927 | 87.35 | 677 | 662 | 140.4 |
| A | 13 | 254 | 10400 | 69.35 | 677 | 662 | 140.4 |
| B | 0 | 186 | 328017 | 2518.75 | 670 | 651 | 130.0 |
| B | 0 | 245 | 44472 | 337.16 | 670 | 651 | 130.0 |
| B | 15 | 35 | 25945 | 194.61 | 670 | 651 | 130.0 |
| C | 0 | 10 | 485228 | 3172.17 | 653 | 657 | 152.8 |
| C | 15 | 214 | 264476 | 1727.05 | 653 | 657 | 152.8 |
| C | 0 | 15 | 82981 | 538.92 | 653 | 657 | 152.8 |
| D | 12 | 79 | 2135609 | 13768.9 | 636 | 620 | 155.1 |
| D | 13 | 249 | 994681 | 6410.86 | 636 | 620 | 155.1 |
| D | 2 | 249 | 341827 | 2200.5 | 636 | 620 | 155.1 |
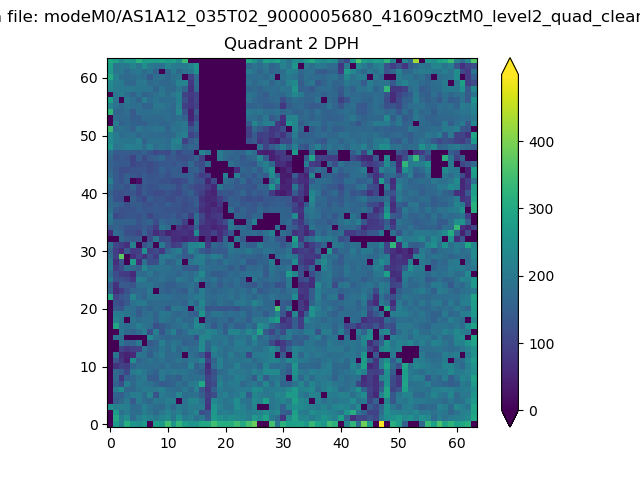
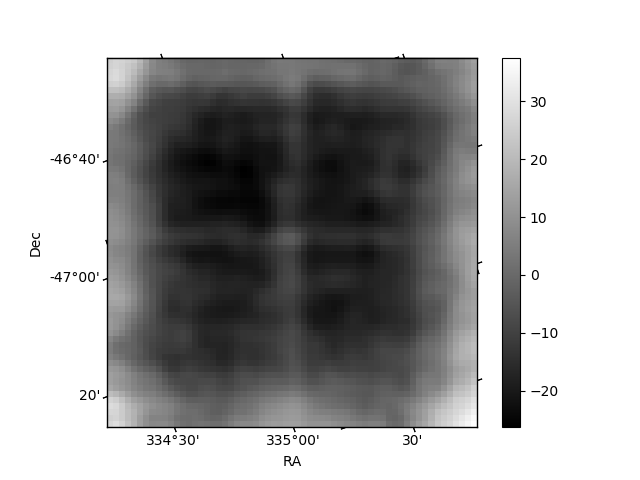
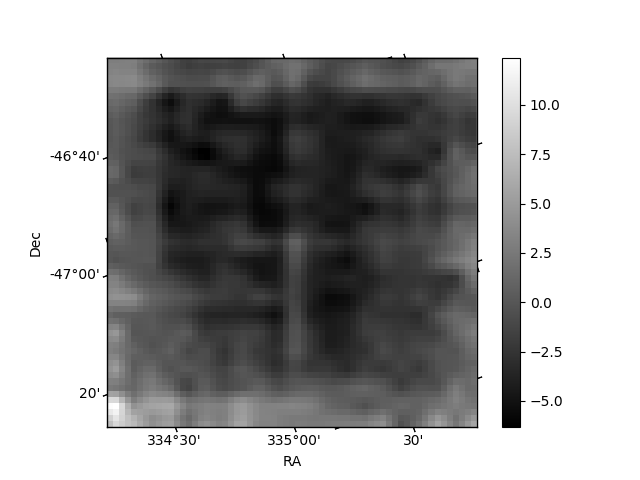
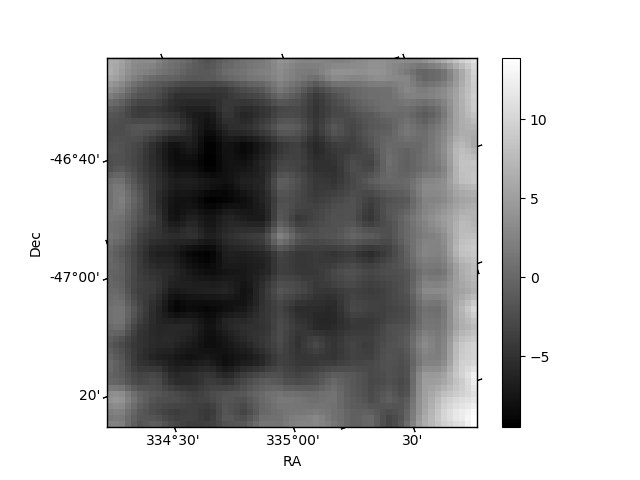
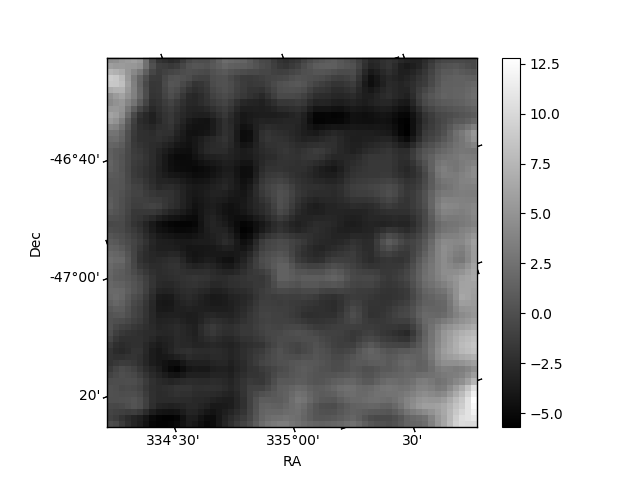
Histogram calculated using DETX and DETY for each event in the final _common_clean file
| Quadrant A | 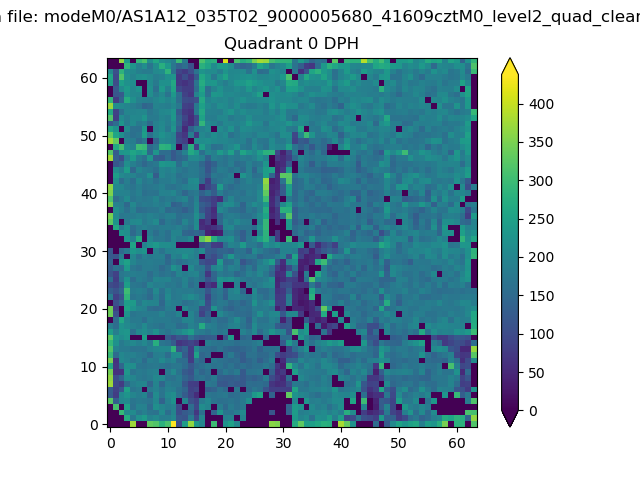 |
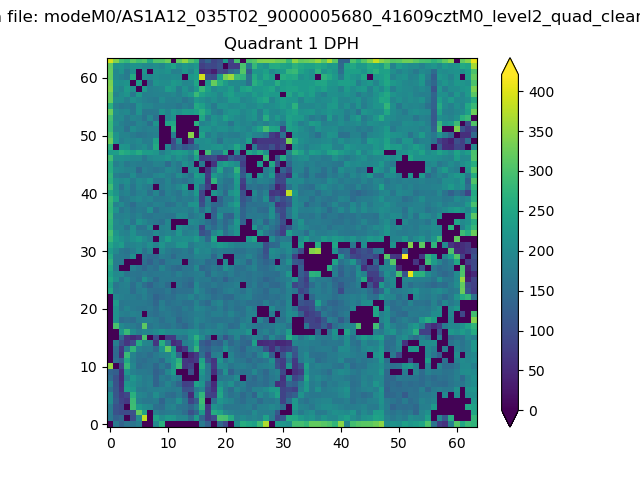 |
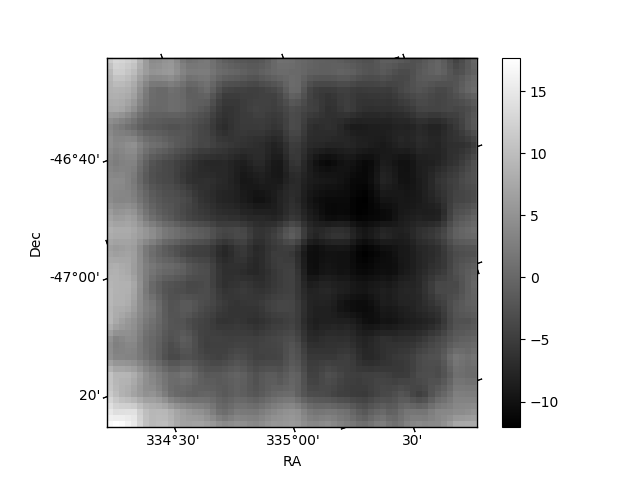
Quadrant B |
|---|---|---|---|
| Quadrant D | 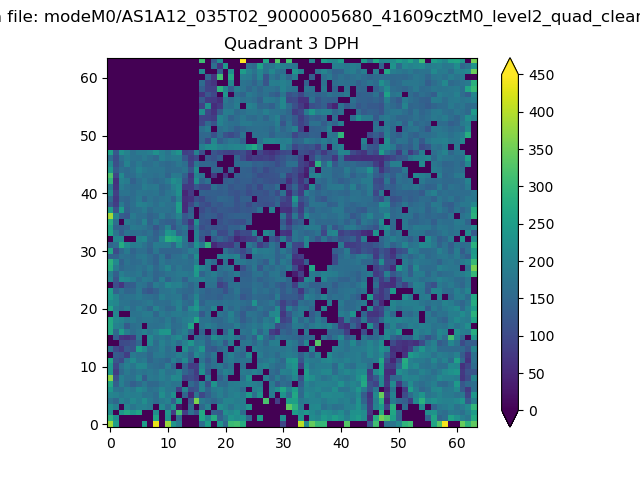 |
 |
Quadrant C |
| Plot type | Count rate plots | Images |
|---|---|---|
| Comparison with Poisson distribution Blue bars denote a histogram of data divided into 1 sec bins. Red curve is a Poisson curve with rate = median count rate of data. |
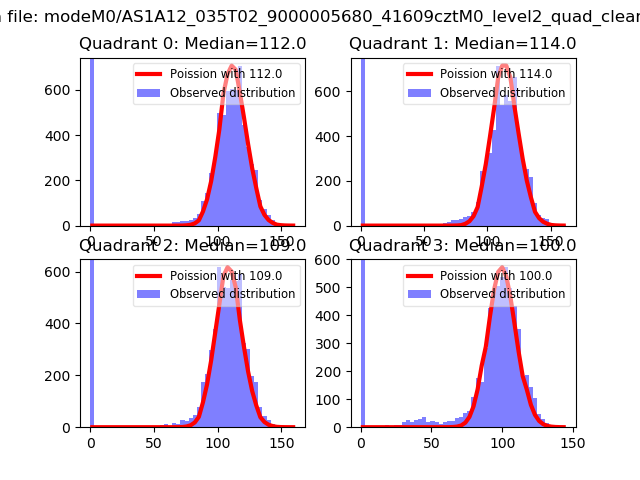 |
 |
| Quadrant-wise count rates Data is divided into 100 sec bins |
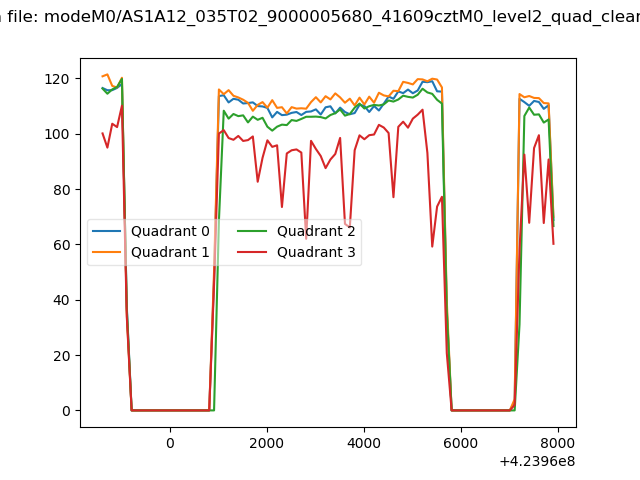 |
|
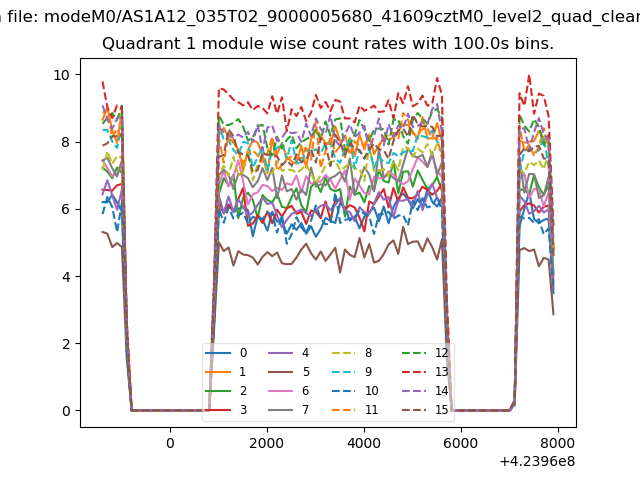
| Module-wise count rates for Quadrant A Data is divided into 100 sec bins |
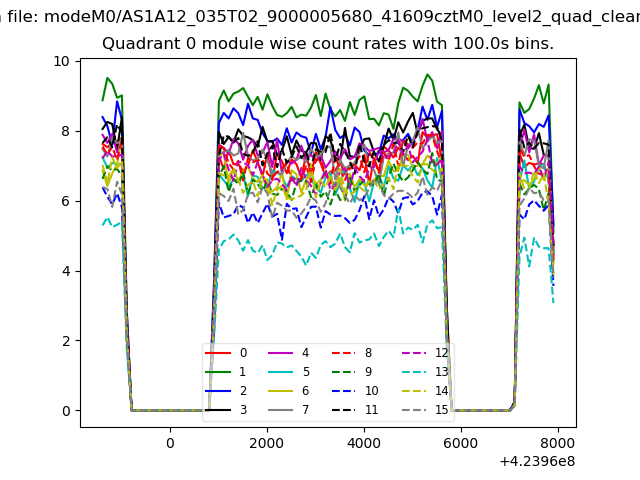 |
 |
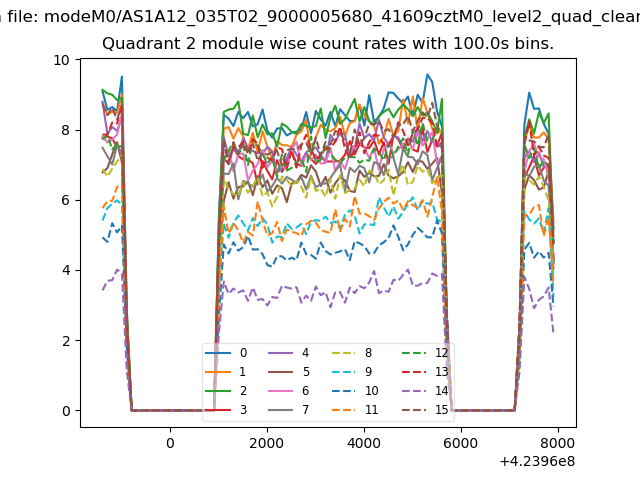
| Module-wise count rates for Quadrant B Data is divided into 100 sec bins |
 |
 |
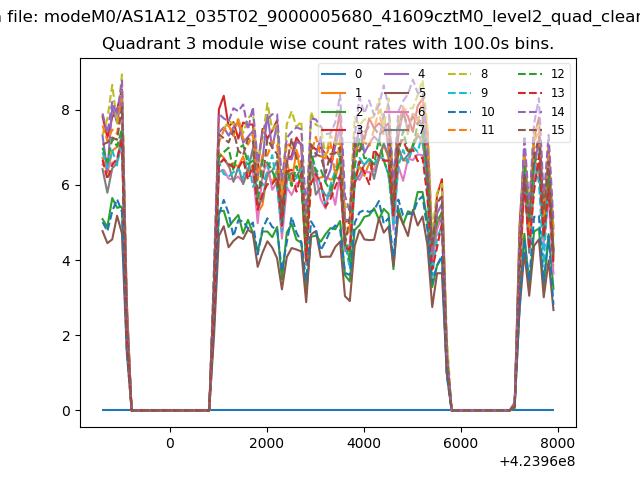
| Module-wise count rates for Quadrant C Data is divided into 100 sec bins |
 |
 |
| Module-wise count rates for Quadrant D Data is divided into 100 sec bins |
 |
 |
| Parameter | Plot |
|---|---|
| CZT HV Monitor | 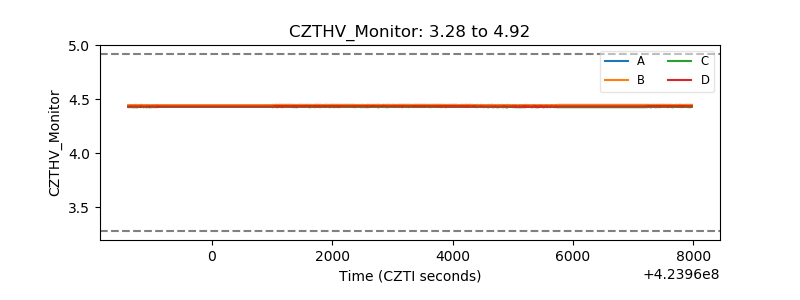 |
| D_VDD | 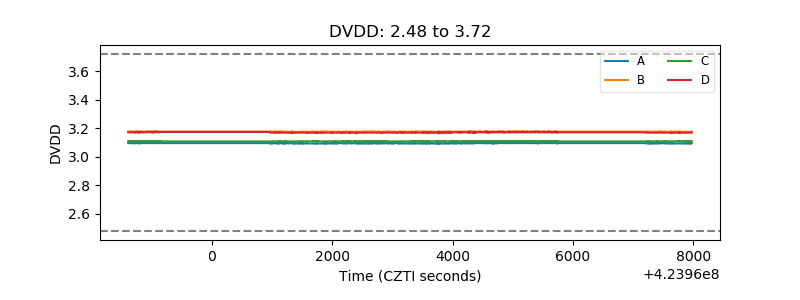 |
| Temperature 1 | 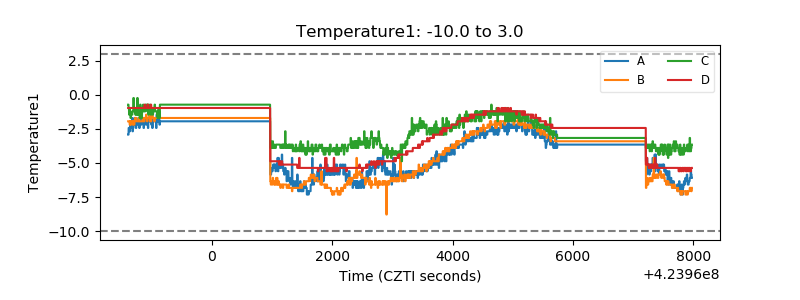 |
| Veto HV Monitor | 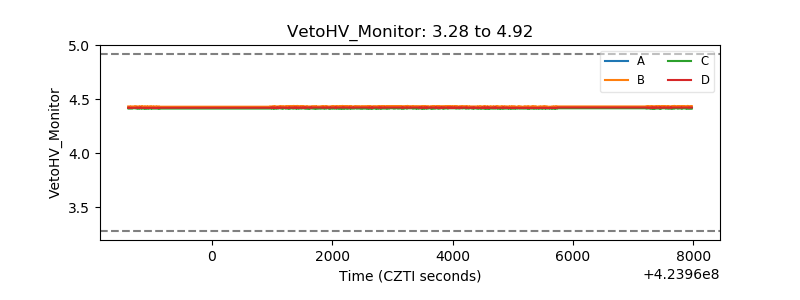 |
| Veto LLD | 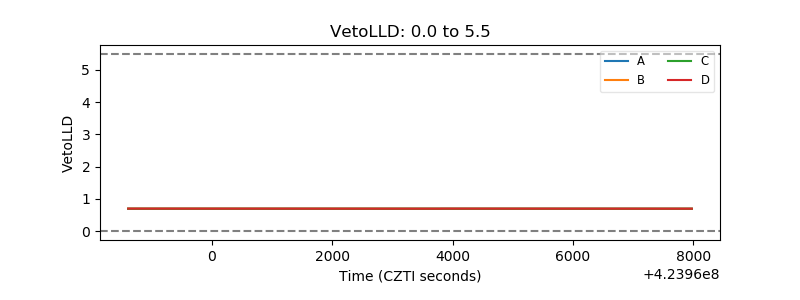 |
| Alpha Counter | 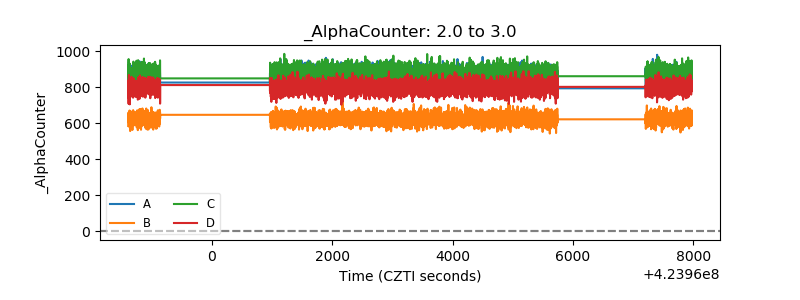 |
| _CPM_Rate | 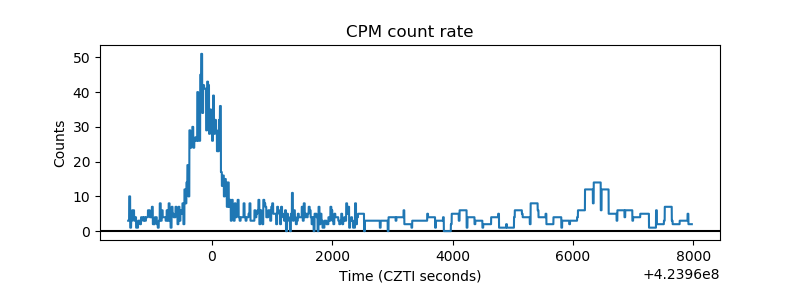 |
| CZT Counter | 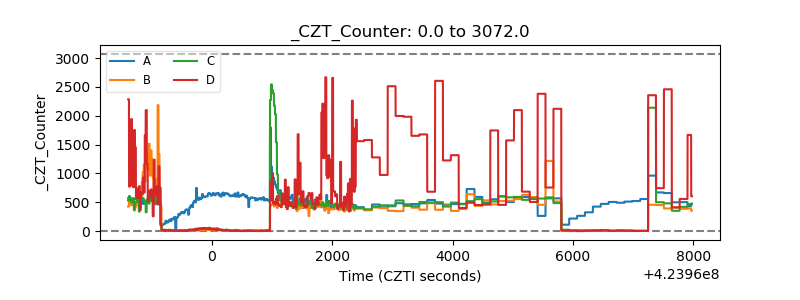 |
| +2.5 Volts monitor | 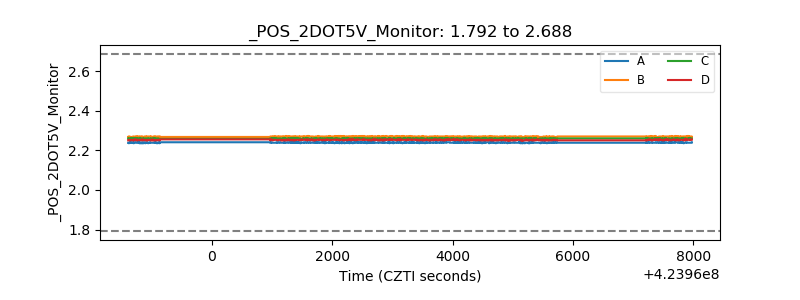 |
| +5 Volts monitor | 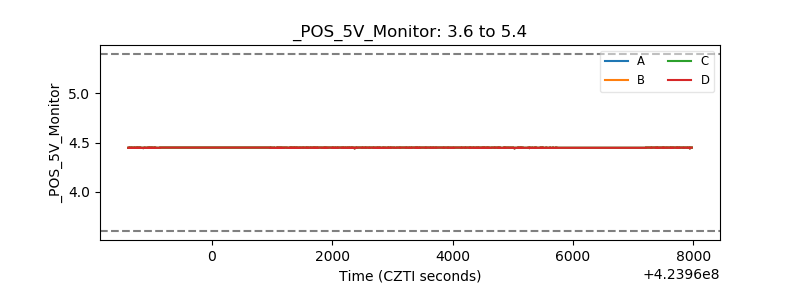 |
| _ROLL_ROT | 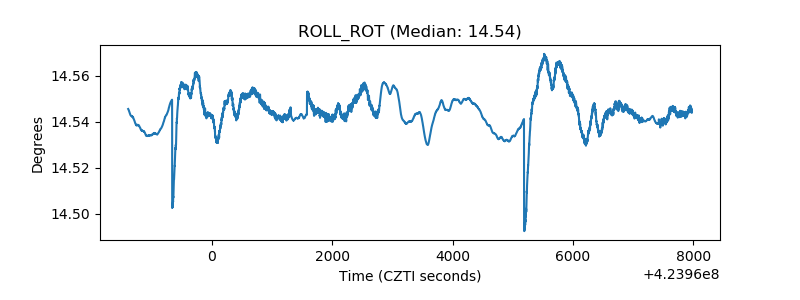 |
| _Roll_DEC | 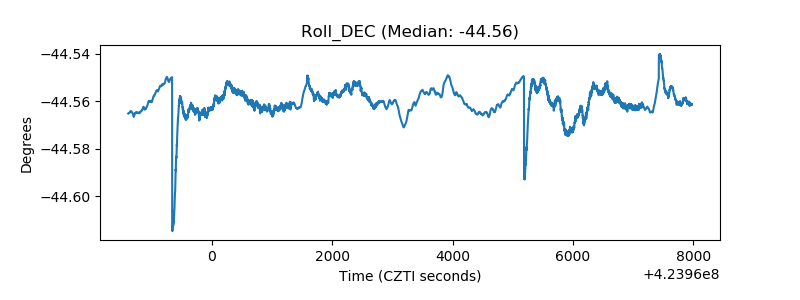 |
| _Roll_RA | 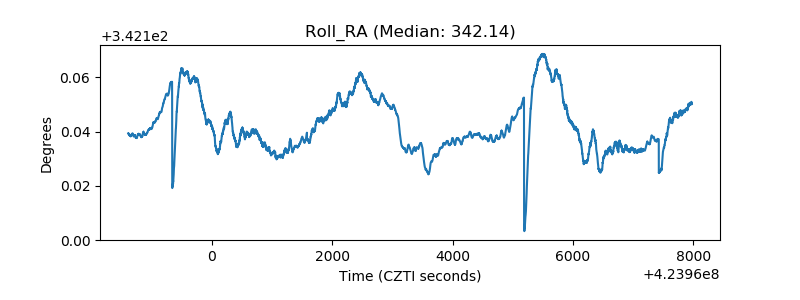 |
| Veto Counter | 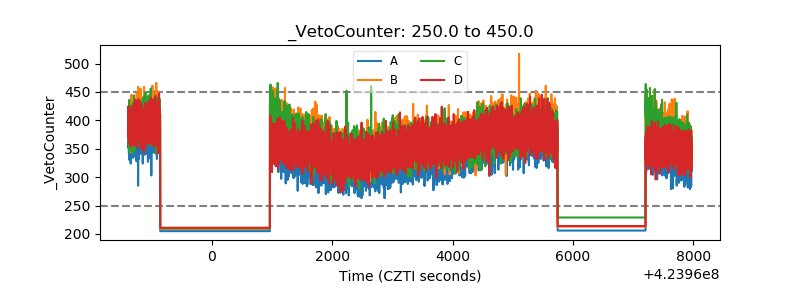 |