| Param | Original file | Final file |
|---|---|---|
| Filename | modeM0/AS1A12_035T02_9000005680_41610cztM0_level2.fits | modeM0/AS1A12_035T02_9000005680_41610cztM0_level2_quad_clean.evt |
| Size (bytes) | 420,131,520 | 94,674,240 |
| Size | 400.7 MB | 90.3 MB |
| Events in quadrant A | 3,140,156 | 652,014 |
| Events in quadrant B | 2,778,770 | 661,467 |
| Events in quadrant C | 3,290,951 | 621,706 |
| Events in quadrant D | 5,880,661 | 516,762 |
| Mode SS | |||
|---|---|---|---|
| Quadrant | BADHDUFLAG | Total packets | Discarded packets |
| A | 0 | 124 | 0 |
| B | 0 | 124 | 0 |
| C | 0 | 124 | 0 |
| D | 0 | 124 | 0 |
| Mode M0 | |||
|---|---|---|---|
| Quadrant | BADHDUFLAG | Total packets | Discarded packets |
| A | 0 | 12852 | 2 |
| B | 0 | 12495 | 2 |
| C | 0 | 13408 | 2 |
| D | 0 | 21550 | 2 |
| Mode M9 | |||
|---|---|---|---|
| Quadrant | BADHDUFLAG | Total packets | Discarded packets |
| A | 0 | 27 | 0 |
| B | 0 | 27 | 0 |
| C | 0 | 27 | 0 |
| D | 0 | 27 | 0 |
| Quadrant | Total seconds | Saturated seconds | Saturation percentage |
|---|---|---|---|
| A | 5930 | 12 | 0.202361% |
| B | 5930 | 8 | 0.134907% |
| C | 5930 | 156 | 2.630691% |
| D | 5930 | 962 | 16.222597% |
Noise dominated data is calculated using 1-second bins in cleaned event files. If a bin has >2000 counts, and if more than 50% of those come from <1% of pixels, then it is considered to be noise-dominated and hence unusable.
| Quadrant | # 1 sec bins | Bins with >0 counts | Bins with >2000 counts | High rate bins dominated by noise | Noise dominated (total time) | Noise dominated (detector-on time) | Marked lightcurve |
|---|---|---|---|---|---|---|---|
| A | 8704 | 5932 | 4 | 4 | 0.05% | 0.07% | 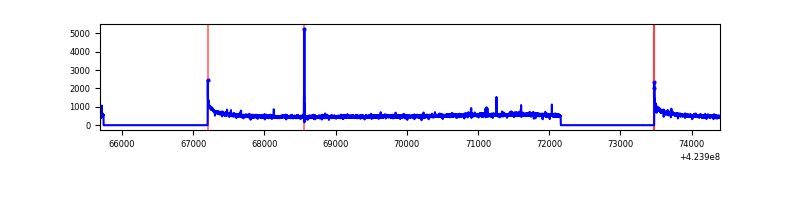 |
| B | 8704 | 5932 | 0 | 0 | 0.00% | 0.00% | 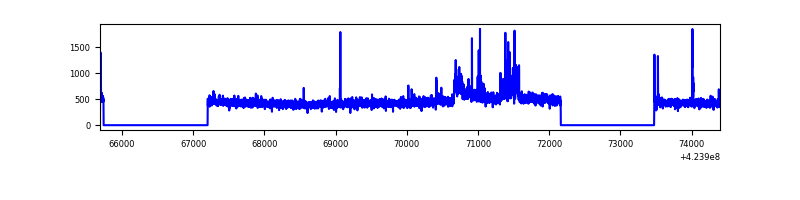 |
| C | 8704 | 5932 | 150 | 150 | 1.72% | 2.53% | 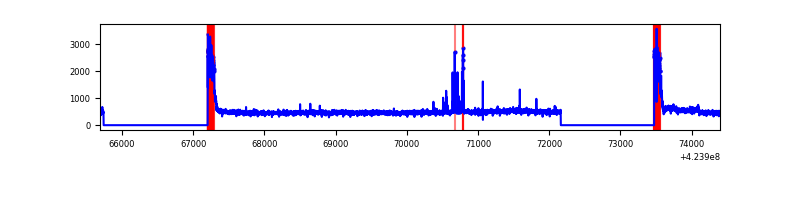 |
| D | 8704 | 5932 | 796 | 796 | 9.15% | 13.42% | 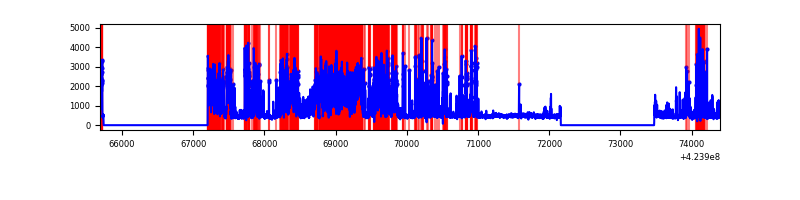 |
Top three noisy pixels from each quadrant. If the there are fewer than three noisy pixels in the level2.evt file, extra rows are filled as -1
| Pixel properties | Quadrant properties | ||||||
|---|---|---|---|---|---|---|---|
| Quadrant | DetID | PixID | Counts | Sigma | Mean | Median | Sigma |
| A | 10 | 83 | 578913 | 4221.78 | 654 | 639 | 137.0 |
| A | 2 | 79 | 14502 | 101.21 | 654 | 639 | 137.0 |
| A | 10 | 255 | 10538 | 72.27 | 654 | 639 | 137.0 |
| B | 0 | 186 | 151717 | 1199.39 | 648 | 630 | 126.0 |
| B | 0 | 189 | 34112 | 265.79 | 648 | 630 | 126.0 |
| B | 12 | 111 | 16176 | 123.41 | 648 | 630 | 126.0 |
| C | 0 | 10 | 445089 | 2987.94 | 633 | 635 | 148.7 |
| C | 15 | 214 | 259782 | 1742.17 | 633 | 635 | 148.7 |
| C | 14 | 254 | 99486 | 664.55 | 633 | 635 | 148.7 |
| D | 13 | 249 | 2314559 | 15458.21 | 608 | 591 | 149.7 |
| D | 12 | 79 | 622392 | 4153.87 | 608 | 591 | 149.7 |
| D | 2 | 249 | 484508 | 3232.76 | 608 | 591 | 149.7 |
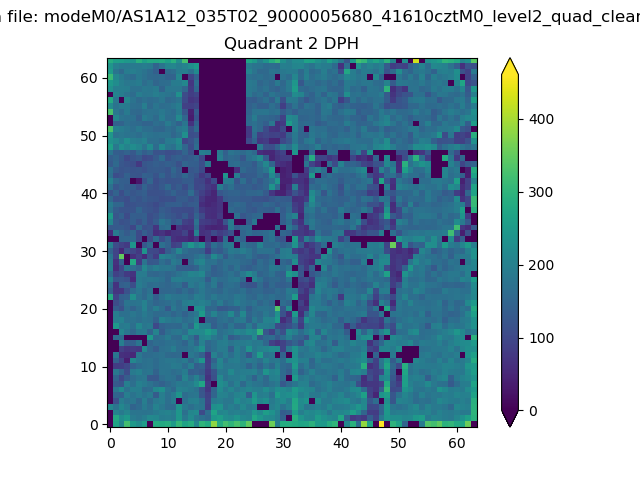
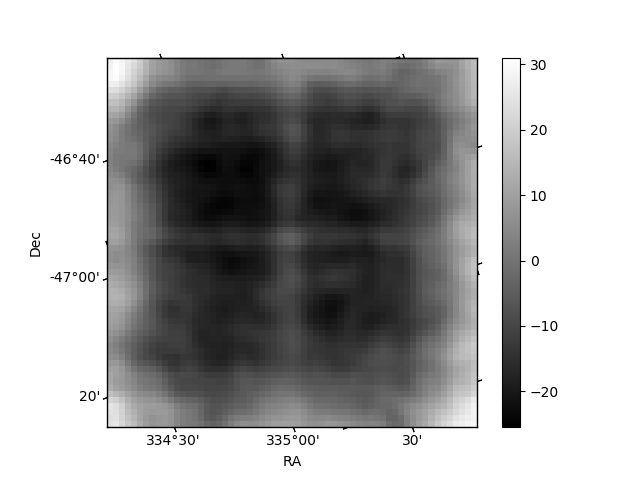
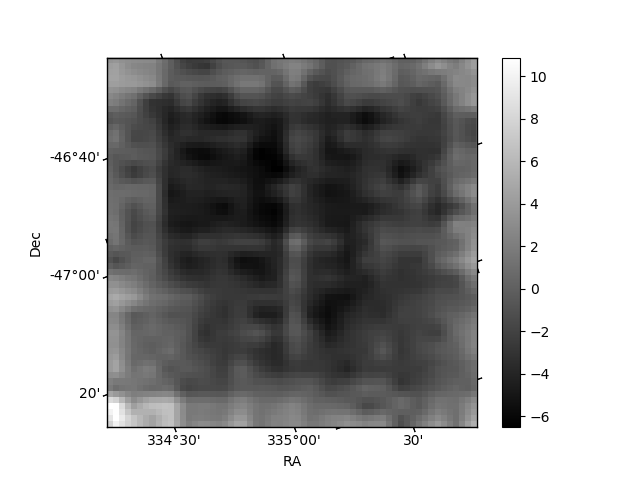
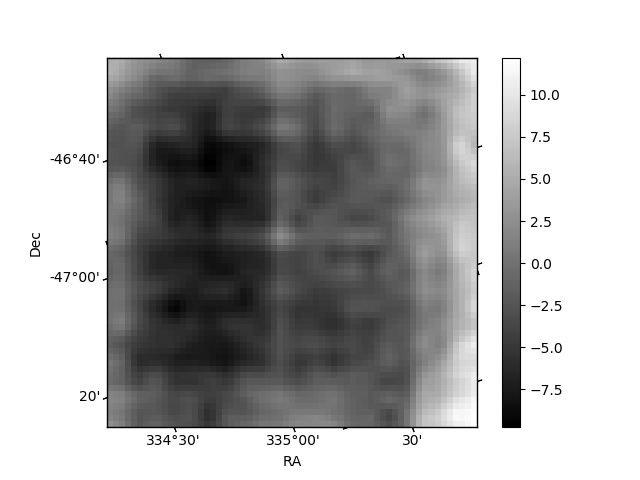
Histogram calculated using DETX and DETY for each event in the final _common_clean file
| Quadrant A | 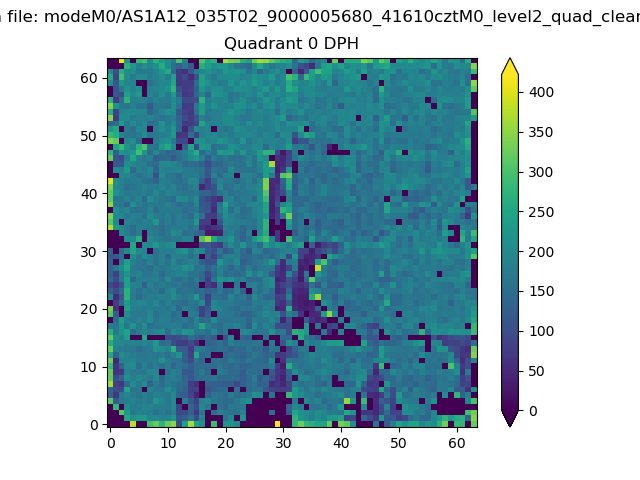 |
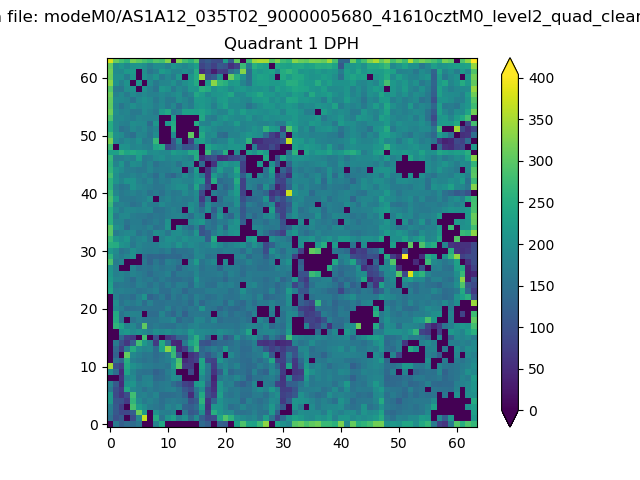 |
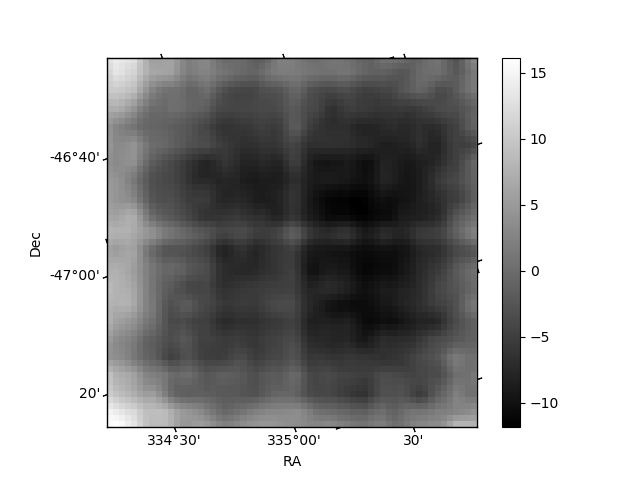
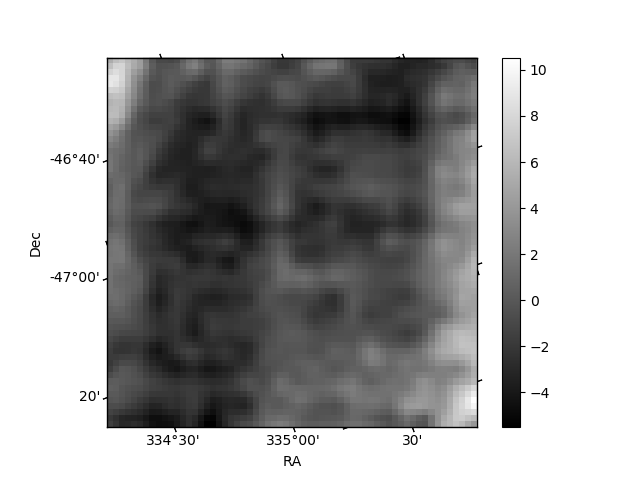
Quadrant B |
|---|---|---|---|
| Quadrant D | 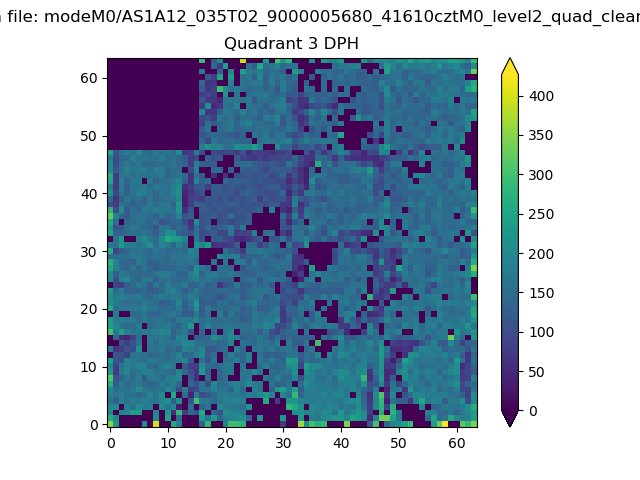 |
 |
Quadrant C |
| Plot type | Count rate plots | Images |
|---|---|---|
| Comparison with Poisson distribution Blue bars denote a histogram of data divided into 1 sec bins. Red curve is a Poisson curve with rate = median count rate of data. |
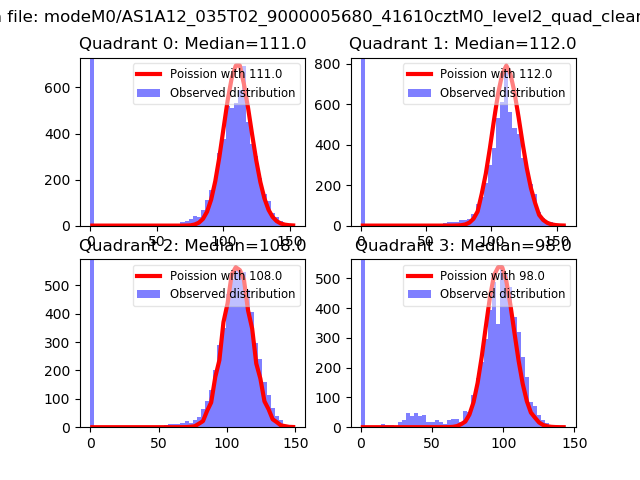 |
 |
| Quadrant-wise count rates Data is divided into 100 sec bins |
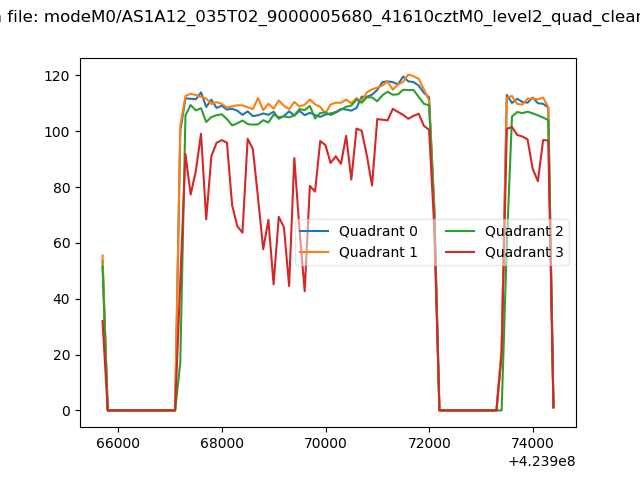 |
|
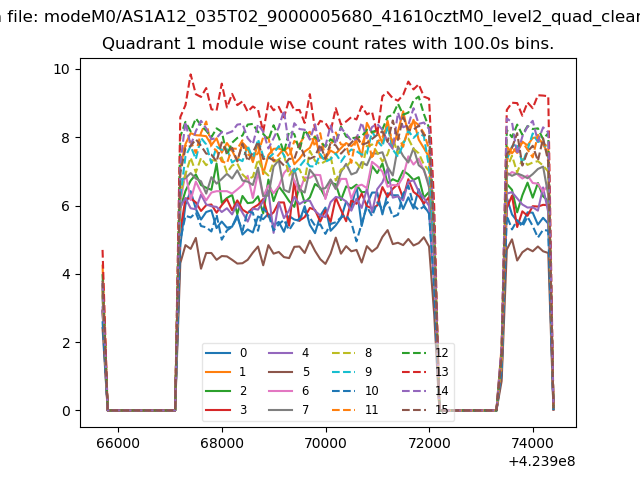
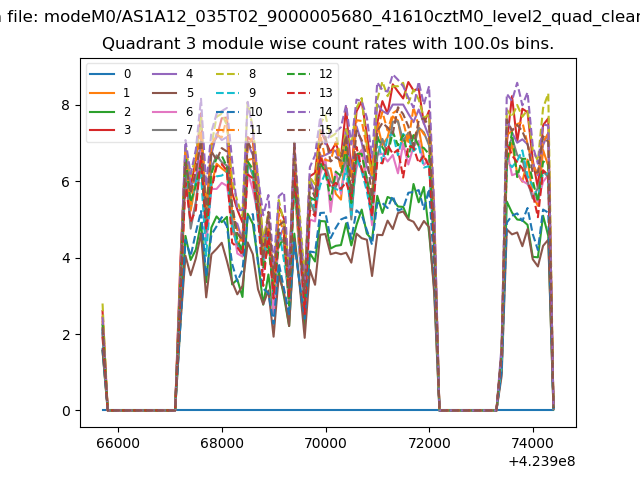
| Module-wise count rates for Quadrant A Data is divided into 100 sec bins |
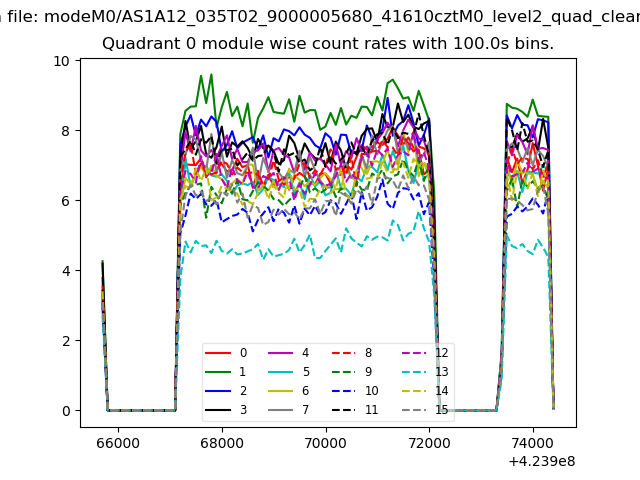 |
 |
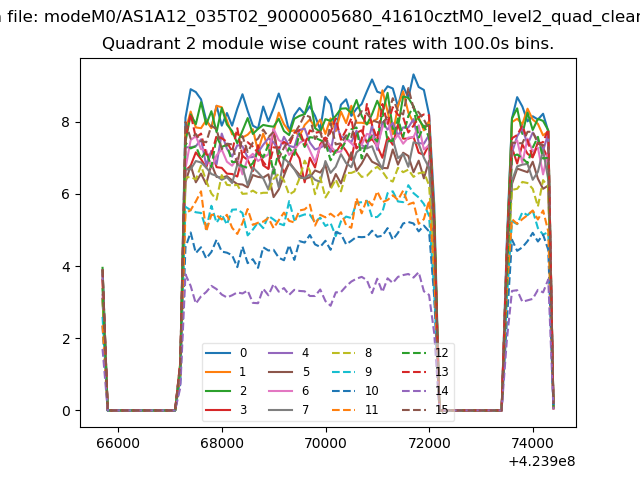
| Module-wise count rates for Quadrant B Data is divided into 100 sec bins |
 |
 |
| Module-wise count rates for Quadrant C Data is divided into 100 sec bins |
 |
 |
| Module-wise count rates for Quadrant D Data is divided into 100 sec bins |
 |
 |
| Parameter | Plot |
|---|---|
| CZT HV Monitor |  |
| D_VDD | 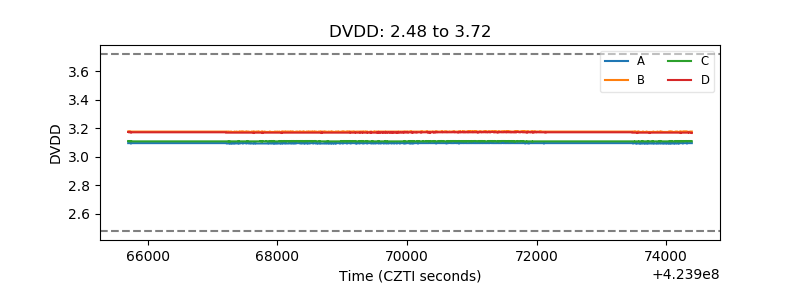 |
| Temperature 1 | 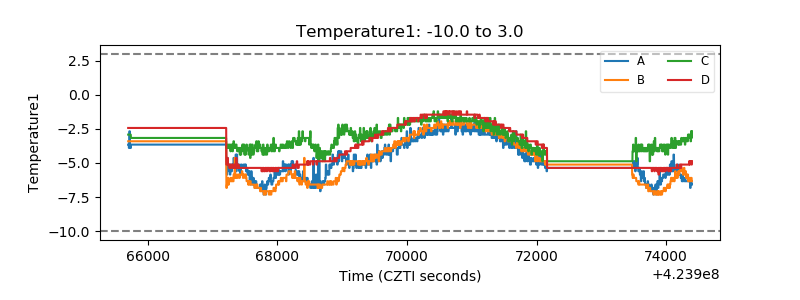 |
| Veto HV Monitor | 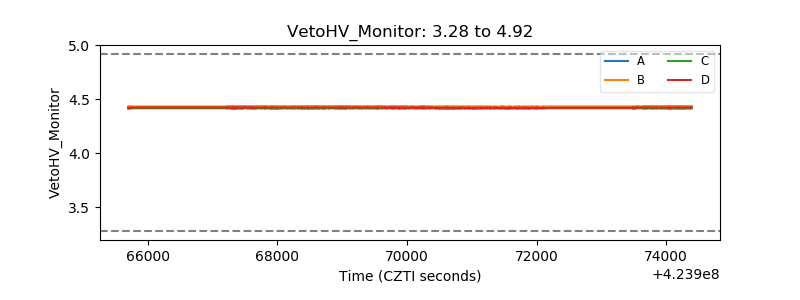 |
| Veto LLD | 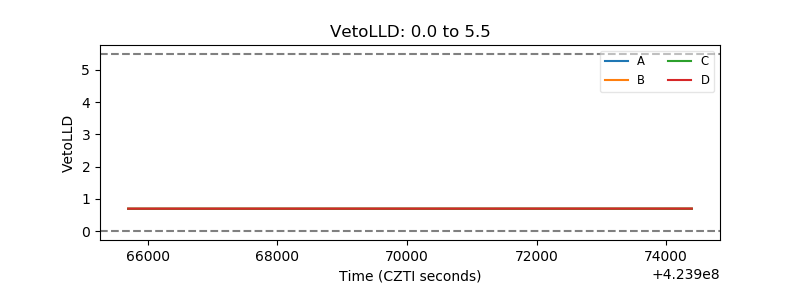 |
| Alpha Counter | 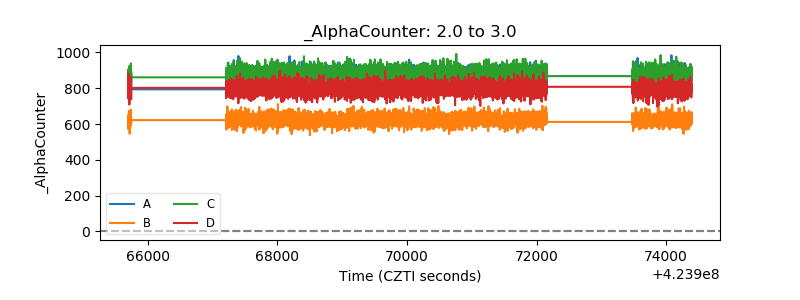 |
| _CPM_Rate | 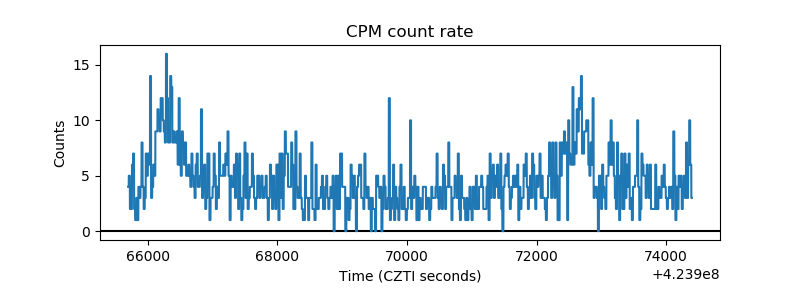 |
| CZT Counter | 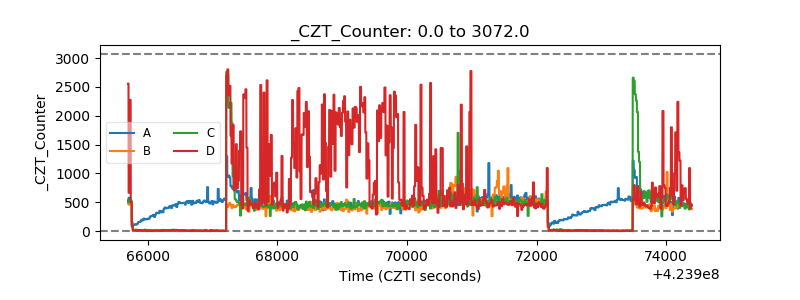 |
| +2.5 Volts monitor | 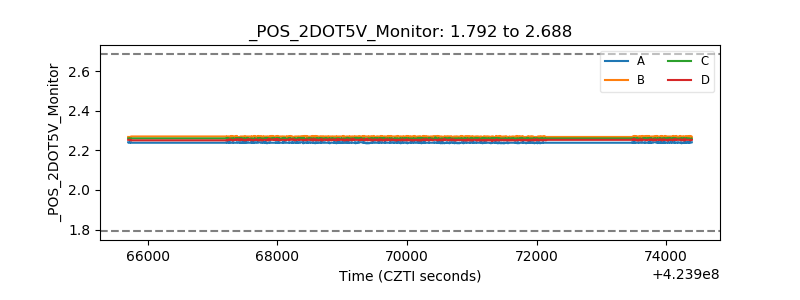 |
| +5 Volts monitor | 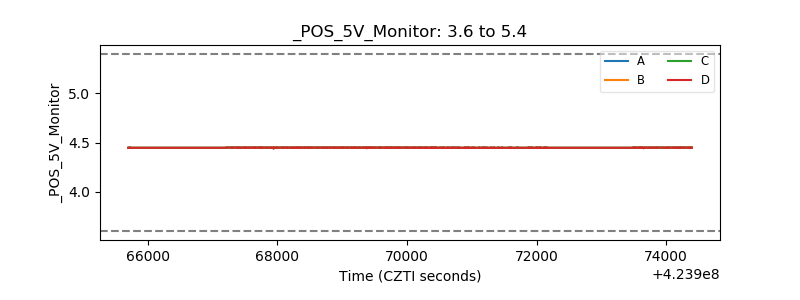 |
| _ROLL_ROT | 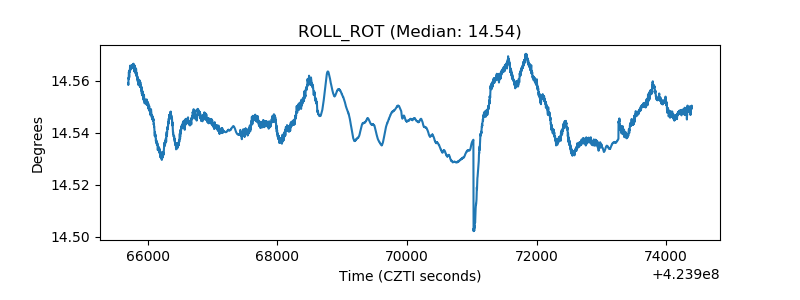 |
| _Roll_DEC |  |
| _Roll_RA | 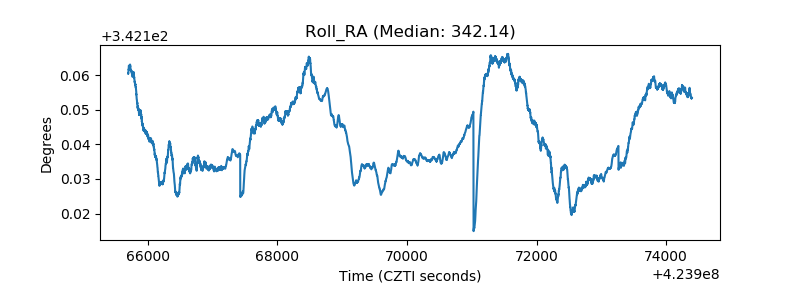 |
| Veto Counter | 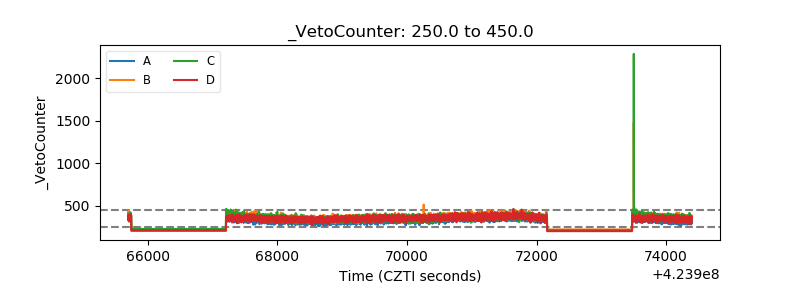 |