| Param | Original file | Final file |
|---|---|---|
| Filename | modeM0/AS1A12_035T02_9000005680_41614cztM0_level2.fits | modeM0/AS1A12_035T02_9000005680_41614cztM0_level2_quad_clean.evt |
| Size (bytes) | 1,475,614,080 | 331,090,560 |
| Size | 1.4 GB | 315.8 MB |
| Events in quadrant A | 11,332,800 | 2,298,332 |
| Events in quadrant B | 9,969,894 | 2,344,083 |
| Events in quadrant C | 11,109,438 | 2,229,854 |
| Events in quadrant D | 20,575,071 | 1,696,857 |
| Mode SS | |||
|---|---|---|---|
| Quadrant | BADHDUFLAG | Total packets | Discarded packets |
| A | 0 | 432 | 0 |
| B | 0 | 432 | 0 |
| C | 0 | 432 | 0 |
| D | 0 | 432 | 0 |
| Mode M0 | |||
|---|---|---|---|
| Quadrant | BADHDUFLAG | Total packets | Discarded packets |
| A | 0 | 45719 | 5 |
| B | 0 | 44279 | 6 |
| C | 0 | 45643 | 5 |
| D | 0 | 75549 | 5 |
| Mode M9 | |||
|---|---|---|---|
| Quadrant | BADHDUFLAG | Total packets | Discarded packets |
| A | 0 | 70 | 0 |
| B | 0 | 70 | 0 |
| C | 0 | 70 | 0 |
| D | 0 | 70 | 0 |
| Quadrant | Total seconds | Saturated seconds | Saturation percentage |
|---|---|---|---|
| A | 21135 | 77 | 0.364325% |
| B | 21134 | 150 | 0.709757% |
| C | 21134 | 340 | 1.608782% |
| D | 21134 | 3425 | 16.206113% |
Noise dominated data is calculated using 1-second bins in cleaned event files. If a bin has >2000 counts, and if more than 50% of those come from <1% of pixels, then it is considered to be noise-dominated and hence unusable.
| Quadrant | # 1 sec bins | Bins with >0 counts | Bins with >2000 counts | High rate bins dominated by noise | Noise dominated (total time) | Noise dominated (detector-on time) | Marked lightcurve |
|---|---|---|---|---|---|---|---|
| A | 28146 | 21140 | 55 | 55 | 0.20% | 0.26% | 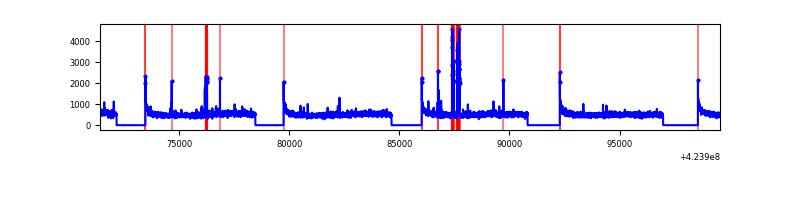 |
| B | 28145 | 21139 | 93 | 93 | 0.33% | 0.44% | 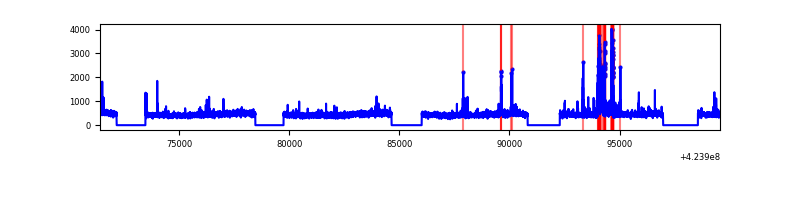 |
| C | 28145 | 21139 | 325 | 325 | 1.15% | 1.54% | 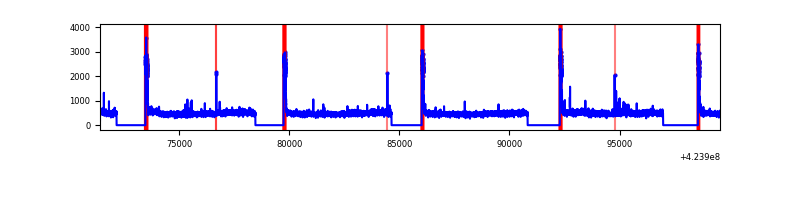 |
| D | 28145 | 21139 | 3009 | 3009 | 10.69% | 14.23% | 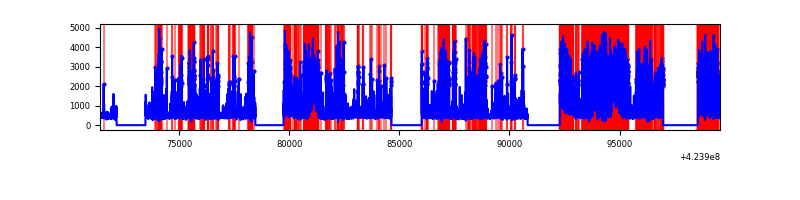 |
Top three noisy pixels from each quadrant. If the there are fewer than three noisy pixels in the level2.evt file, extra rows are filled as -1
| Pixel properties | Quadrant properties | ||||||
|---|---|---|---|---|---|---|---|
| Quadrant | DetID | PixID | Counts | Sigma | Mean | Median | Sigma |
| A | 10 | 83 | 1837450 | 3828.29 | 2354 | 2302 | 479.4 |
| A | 7 | 16 | 150196 | 308.52 | 2354 | 2302 | 479.4 |
| A | 2 | 79 | 118823 | 243.07 | 2354 | 2302 | 479.4 |
| B | 0 | 186 | 480128 | 1072.57 | 2325 | 2255 | 445.5 |
| B | 5 | 255 | 89083 | 194.88 | 2325 | 2255 | 445.5 |
| B | 0 | 189 | 68496 | 148.68 | 2325 | 2255 | 445.5 |
| C | 0 | 10 | 994017 | 1876.61 | 2273 | 2284 | 528.5 |
| C | 15 | 214 | 911738 | 1720.92 | 2273 | 2284 | 528.5 |
| C | 0 | 15 | 235899 | 442.06 | 2273 | 2284 | 528.5 |
| D | 12 | 79 | 6345715 | 12076.6 | 2148 | 2085 | 525.3 |
| D | 13 | 249 | 3318704 | 6313.97 | 2148 | 2085 | 525.3 |
| D | 2 | 249 | 1883089 | 3580.94 | 2148 | 2085 | 525.3 |
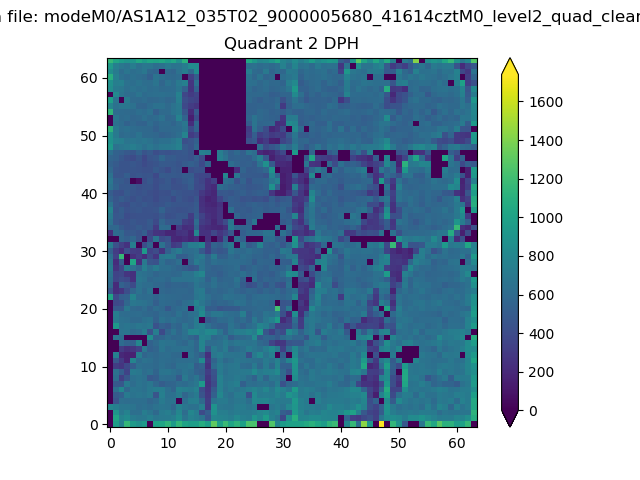
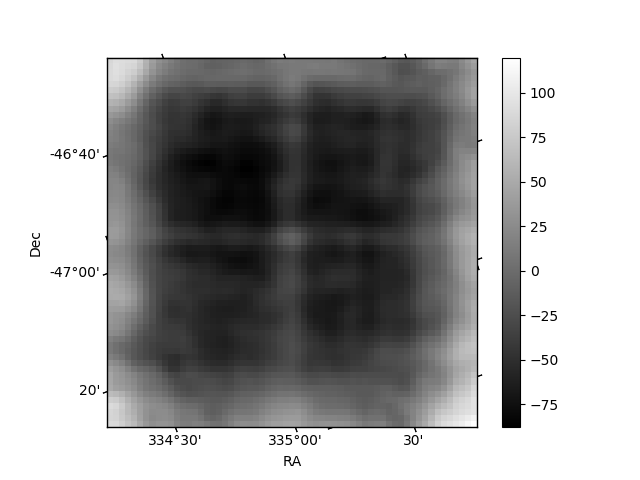
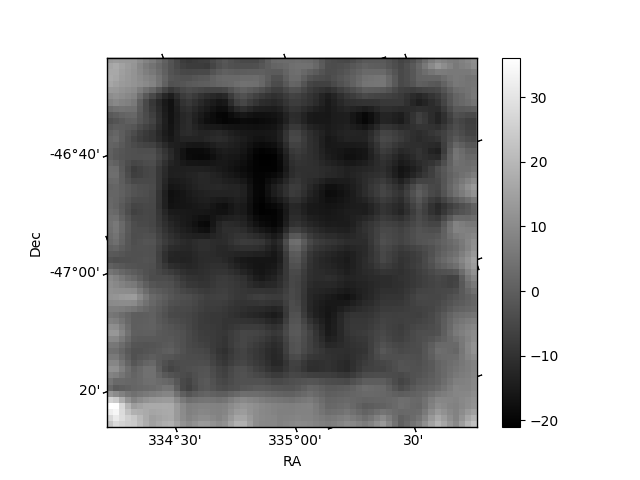
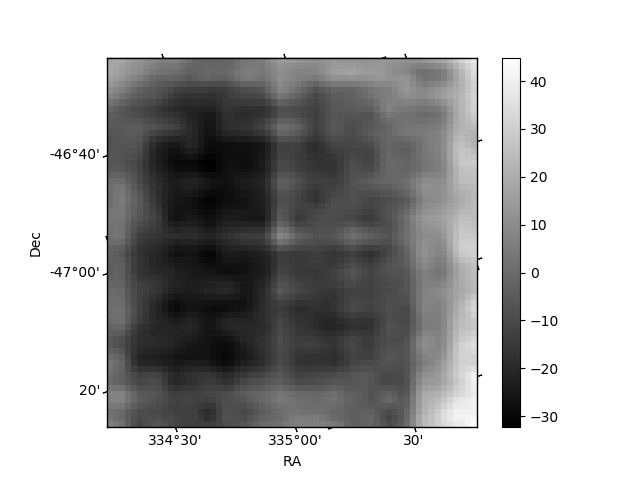
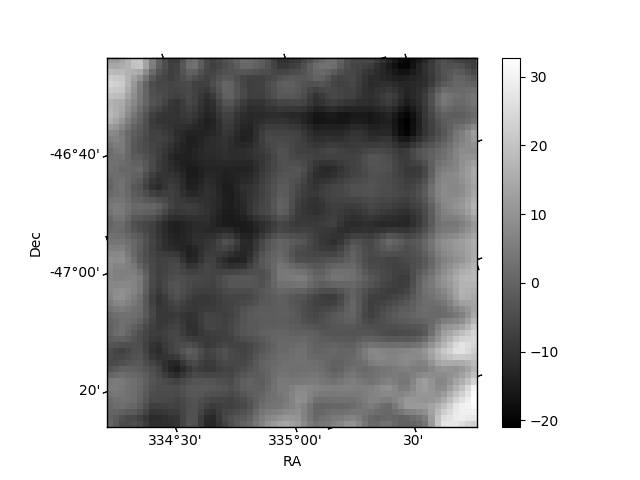
Histogram calculated using DETX and DETY for each event in the final _common_clean file
| Quadrant A | 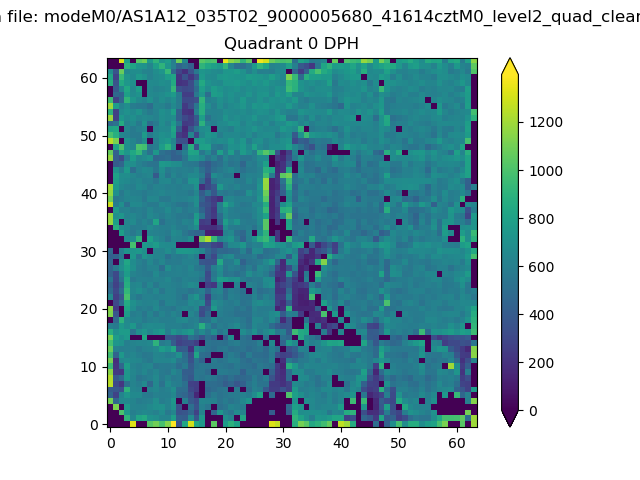 |
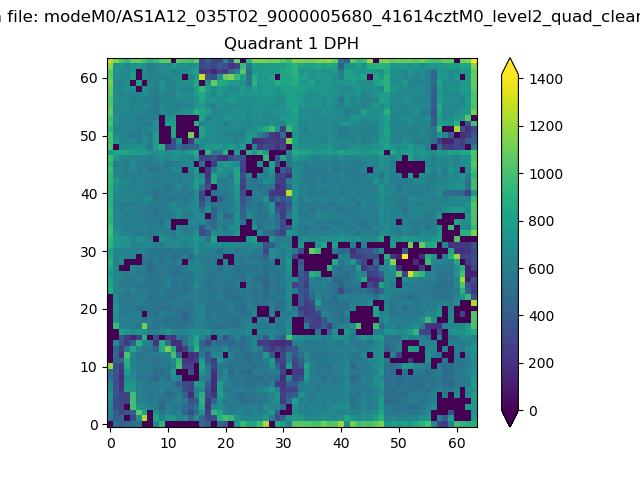 |
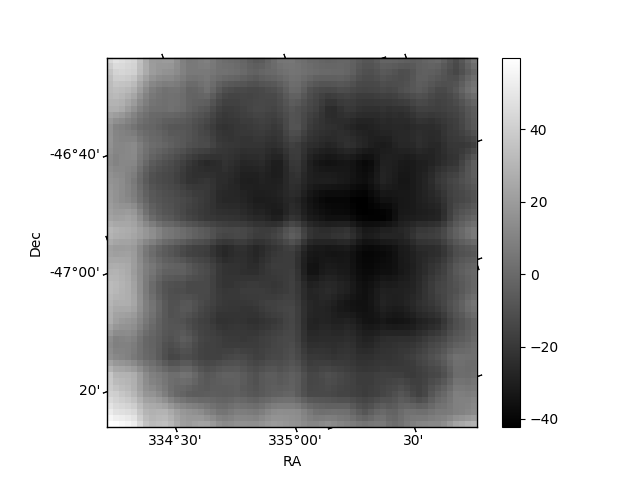
Quadrant B |
|---|---|---|---|
| Quadrant D | 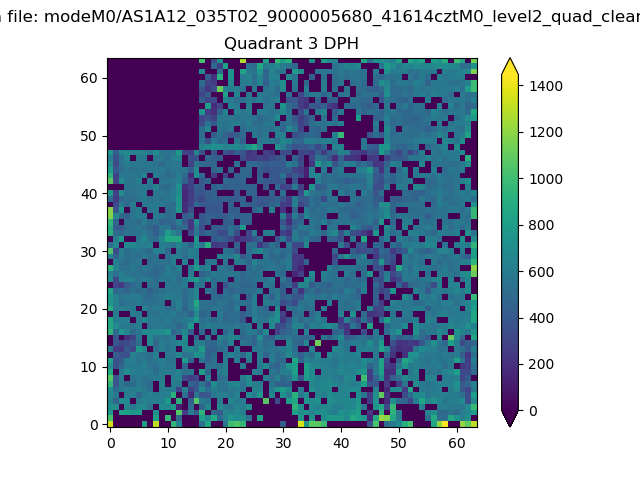 |
 |
Quadrant C |
| Plot type | Count rate plots | Images |
|---|---|---|
| Comparison with Poisson distribution Blue bars denote a histogram of data divided into 1 sec bins. Red curve is a Poisson curve with rate = median count rate of data. |
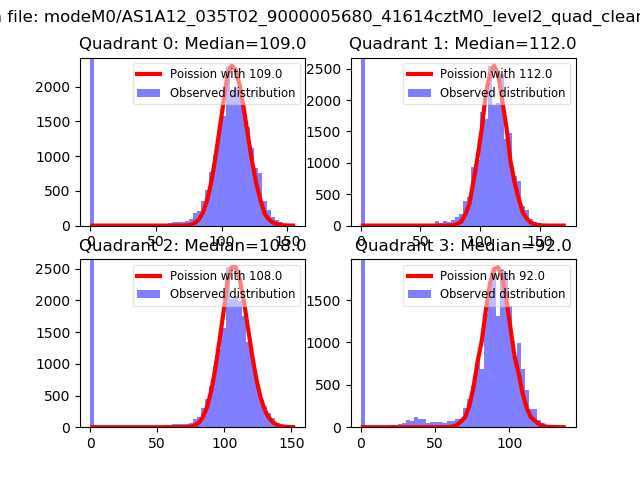 |
 |
| Quadrant-wise count rates Data is divided into 100 sec bins |
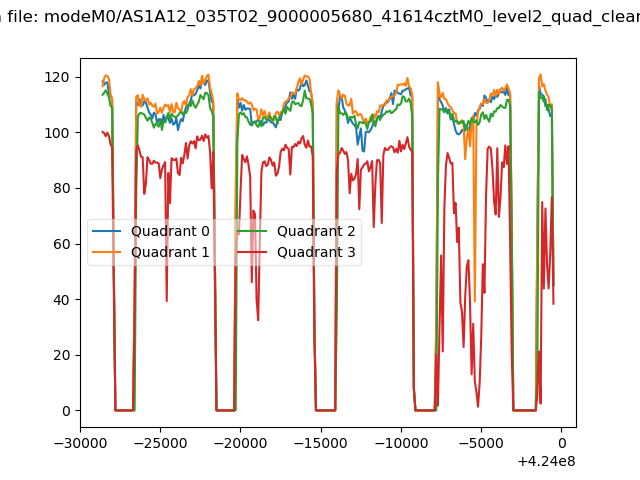 |
|
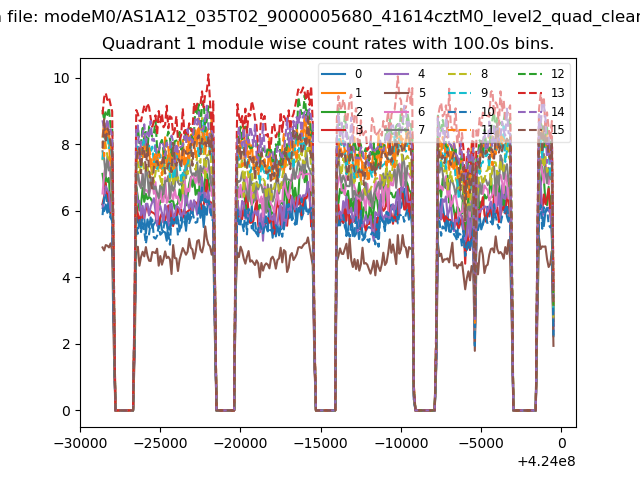
| Module-wise count rates for Quadrant A Data is divided into 100 sec bins |
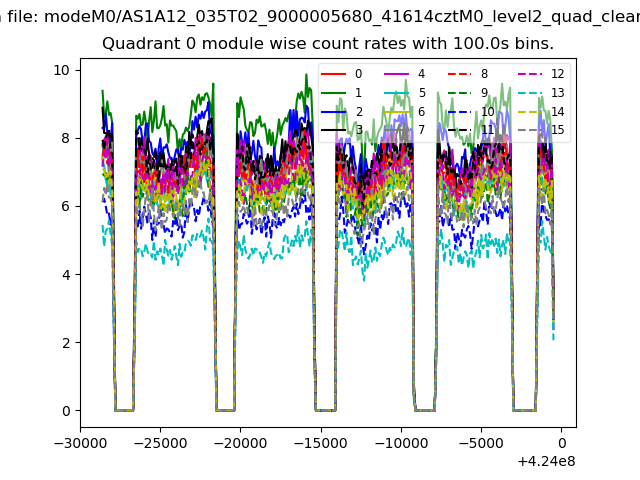 |
 |
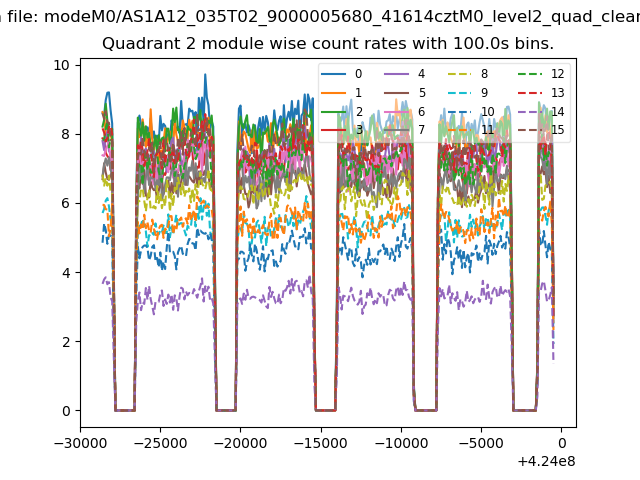
| Module-wise count rates for Quadrant B Data is divided into 100 sec bins |
 |
 |
| Module-wise count rates for Quadrant C Data is divided into 100 sec bins |
 |
 |
| Module-wise count rates for Quadrant D Data is divided into 100 sec bins |
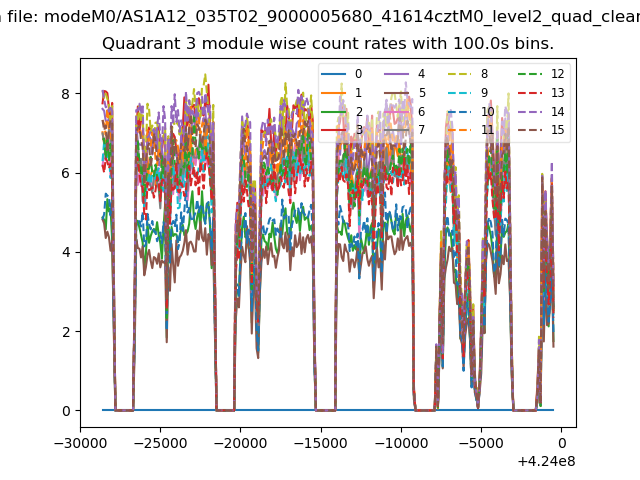 |
 |
| Parameter | Plot |
|---|---|
| CZT HV Monitor | 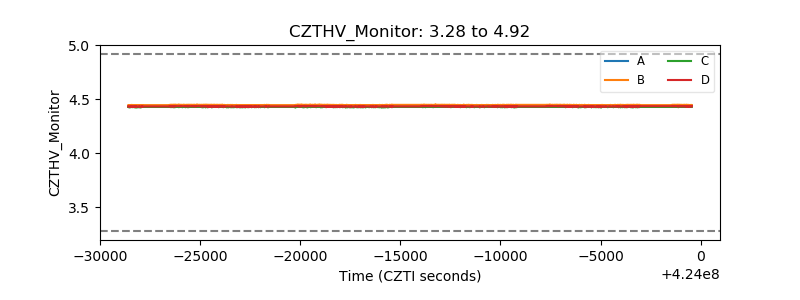 |
| D_VDD | 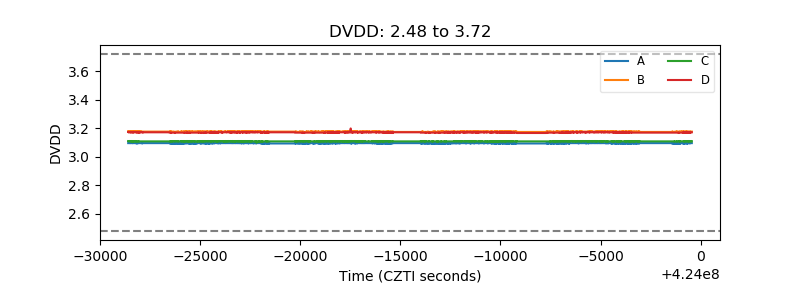 |
| Temperature 1 | 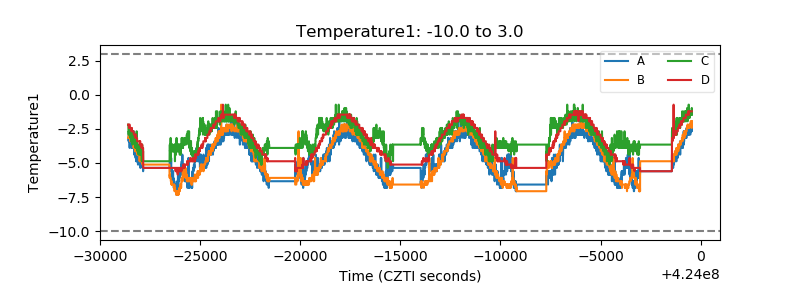 |
| Veto HV Monitor | 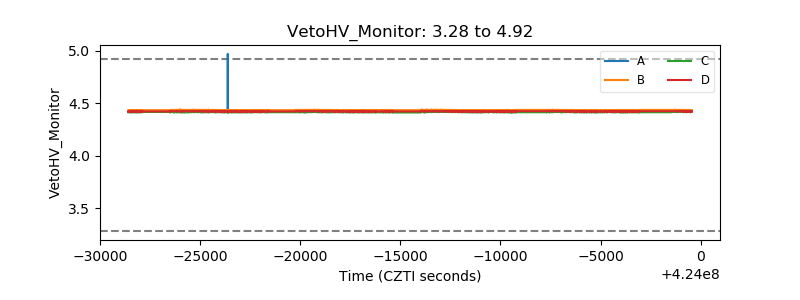 |
| Veto LLD | 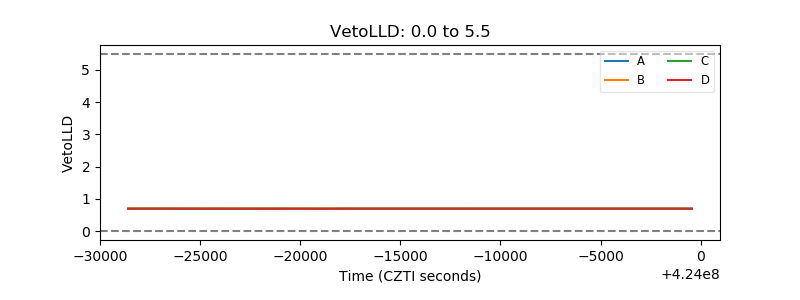 |
| Alpha Counter | 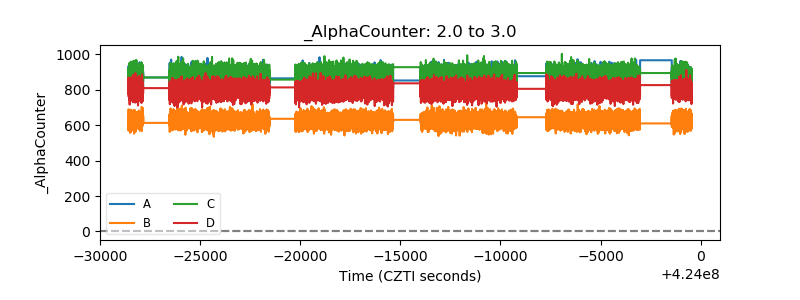 |
| _CPM_Rate | 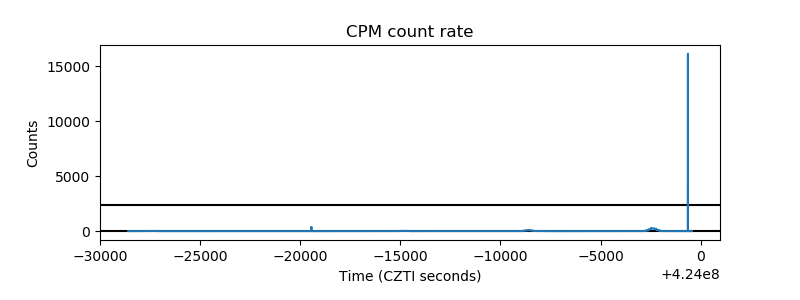 |
| CZT Counter | 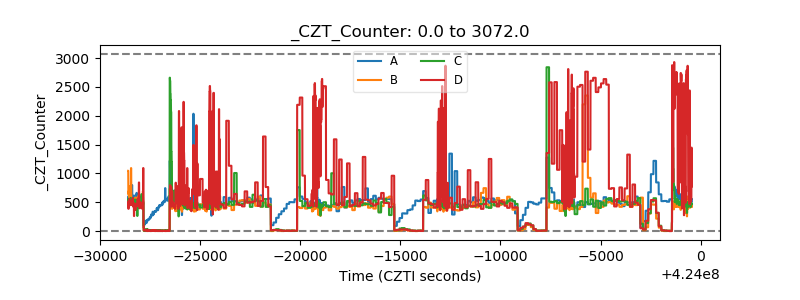 |
| +2.5 Volts monitor | 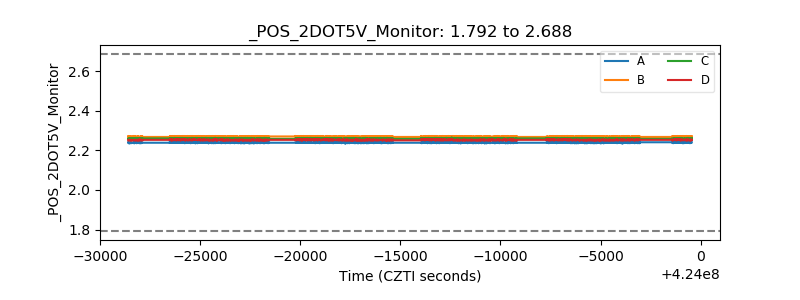 |
| +5 Volts monitor | 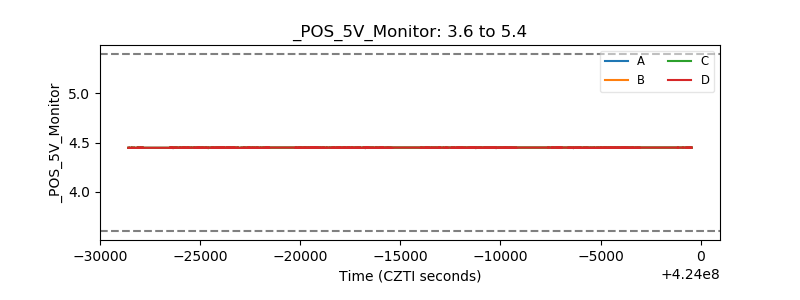 |
| _ROLL_ROT | 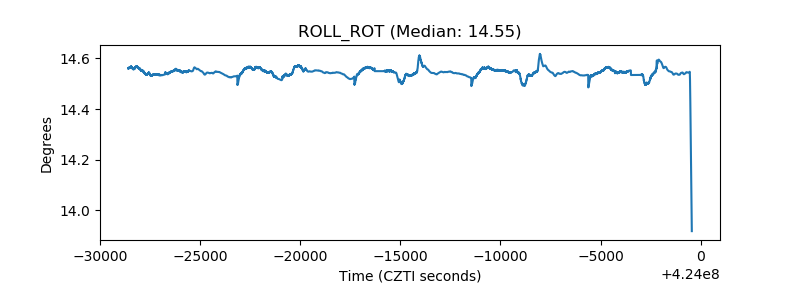 |
| _Roll_DEC |  |
| _Roll_RA | 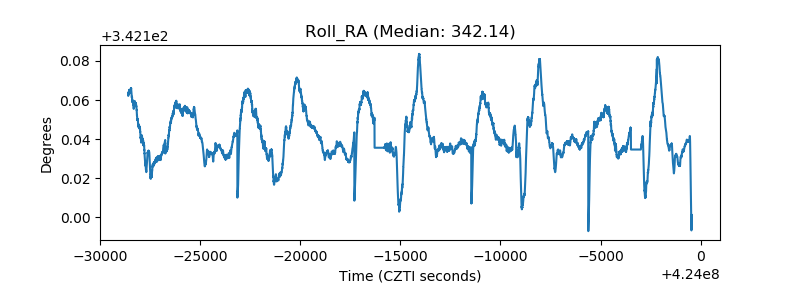 |
| Veto Counter | 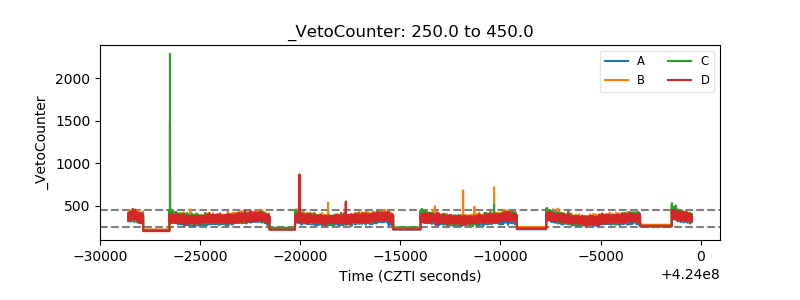 |