| Param | Original file | Final file |
|---|---|---|
| Filename | modeM0/AS1A12_035T02_9000005680_41615cztM0_level2.fits | modeM0/AS1A12_035T02_9000005680_41615cztM0_level2_quad_clean.evt |
| Size (bytes) | 558,478,080 | 79,459,200 |
| Size | 532.6 MB | 75.8 MB |
| Events in quadrant A | 2,979,828 | 615,402 |
| Events in quadrant B | 2,748,157 | 628,177 |
| Events in quadrant C | 2,917,236 | 593,841 |
| Events in quadrant D | 11,595,743 | 179,922 |
| Mode SS | |||
|---|---|---|---|
| Quadrant | BADHDUFLAG | Total packets | Discarded packets |
| A | 0 | 114 | 0 |
| B | 0 | 114 | 0 |
| C | 0 | 114 | 0 |
| D | 0 | 114 | 0 |
| Mode M0 | |||
|---|---|---|---|
| Quadrant | BADHDUFLAG | Total packets | Discarded packets |
| A | 0 | 12092 | 2 |
| B | 0 | 11940 | 3 |
| C | 0 | 12140 | 2 |
| D | 0 | 38219 | 2 |
| Mode M9 | |||
|---|---|---|---|
| Quadrant | BADHDUFLAG | Total packets | Discarded packets |
| A | 0 | 17 | 0 |
| B | 0 | 17 | 0 |
| C | 0 | 17 | 0 |
| D | 0 | 17 | 0 |
| Quadrant | Total seconds | Saturated seconds | Saturation percentage |
|---|---|---|---|
| A | 5548 | 8 | 0.144196% |
| B | 5548 | 23 | 0.414564% |
| C | 5548 | 111 | 2.000721% |
| D | 5548 | 3908 | 70.439798% |
Noise dominated data is calculated using 1-second bins in cleaned event files. If a bin has >2000 counts, and if more than 50% of those come from <1% of pixels, then it is considered to be noise-dominated and hence unusable.
| Quadrant | # 1 sec bins | Bins with >0 counts | Bins with >2000 counts | High rate bins dominated by noise | Noise dominated (total time) | Noise dominated (detector-on time) | Marked lightcurve |
|---|---|---|---|---|---|---|---|
| A | 7251 | 5549 | 1 | 1 | 0.01% | 0.02% | 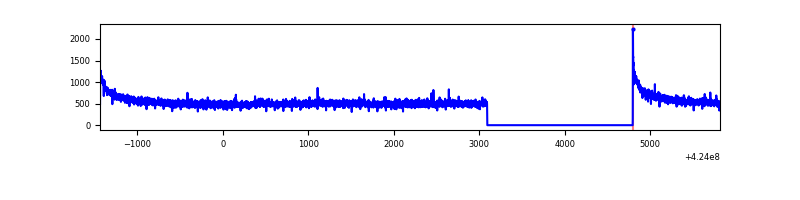 |
| B | 7251 | 5549 | 11 | 11 | 0.15% | 0.20% | 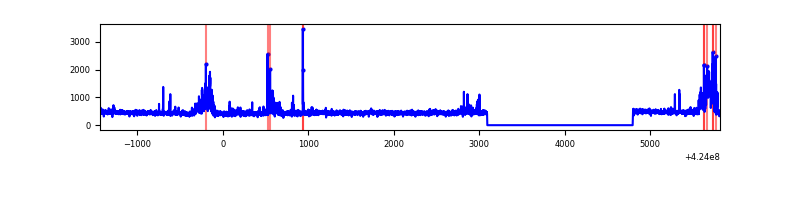 |
| C | 7251 | 5549 | 97 | 97 | 1.34% | 1.75% | 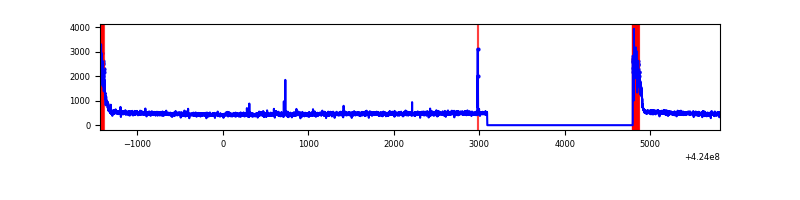 |
| D | 7251 | 5549 | 3605 | 3605 | 49.72% | 64.97% | 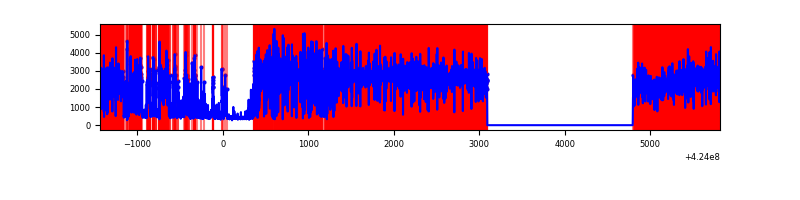 |
Top three noisy pixels from each quadrant. If the there are fewer than three noisy pixels in the level2.evt file, extra rows are filled as -1
| Pixel properties | Quadrant properties | ||||||
|---|---|---|---|---|---|---|---|
| Quadrant | DetID | PixID | Counts | Sigma | Mean | Median | Sigma |
| A | 10 | 83 | 547806 | 4239.02 | 621 | 608 | 129.1 |
| A | 2 | 79 | 20800 | 156.42 | 621 | 608 | 129.1 |
| A | 13 | 254 | 9495 | 68.85 | 621 | 608 | 129.1 |
| B | 0 | 186 | 271620 | 2277.65 | 613 | 594 | 119.0 |
| B | 5 | 255 | 27212 | 223.69 | 613 | 594 | 119.0 |
| B | 0 | 189 | 20855 | 170.27 | 613 | 594 | 119.0 |
| C | 0 | 10 | 327790 | 2353.9 | 595 | 598 | 139.0 |
| C | 15 | 214 | 243037 | 1744.16 | 595 | 598 | 139.0 |
| C | 1 | 23 | 10702 | 72.69 | 595 | 598 | 139.0 |
| D | 12 | 79 | 9103382 | 92190.97 | 399 | 387 | 98.7 |
| D | 13 | 249 | 595157 | 6023.56 | 399 | 387 | 98.7 |
| D | 2 | 249 | 223804 | 2262.67 | 399 | 387 | 98.7 |
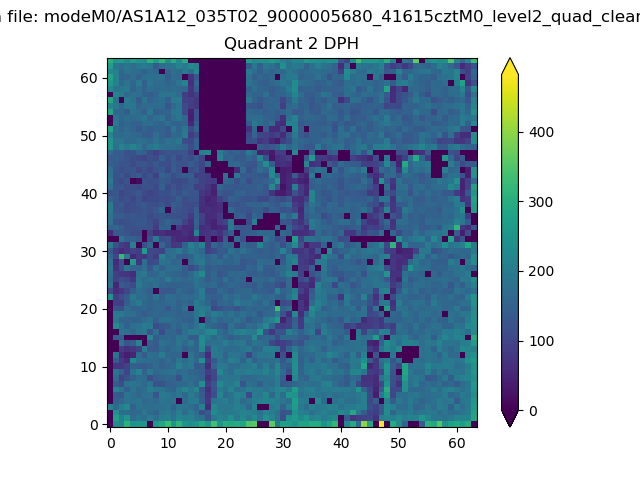
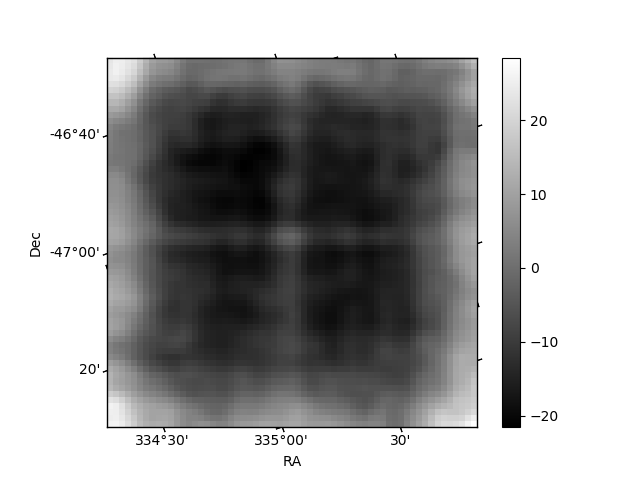
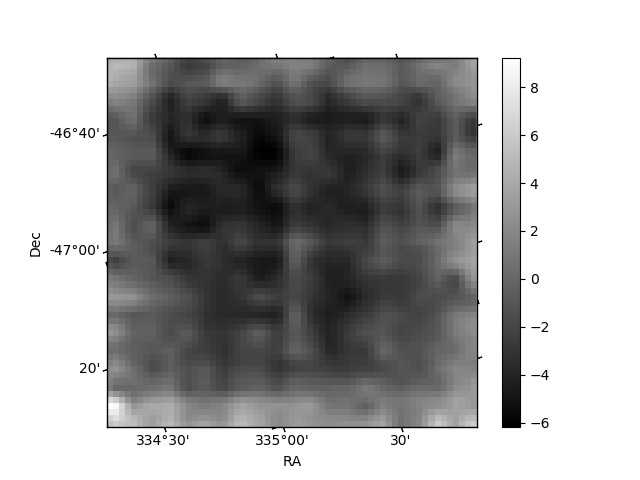
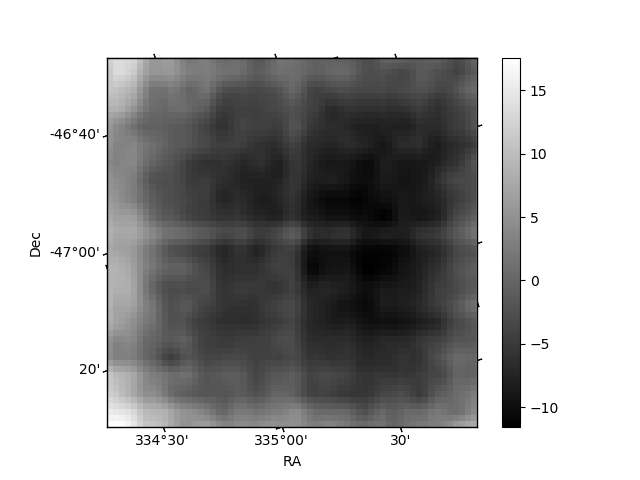
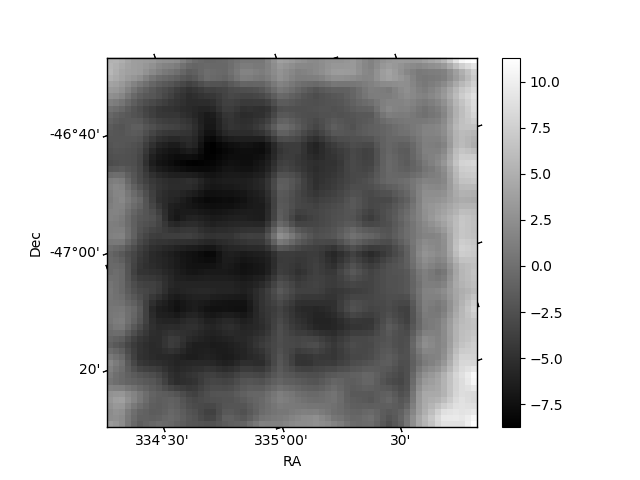
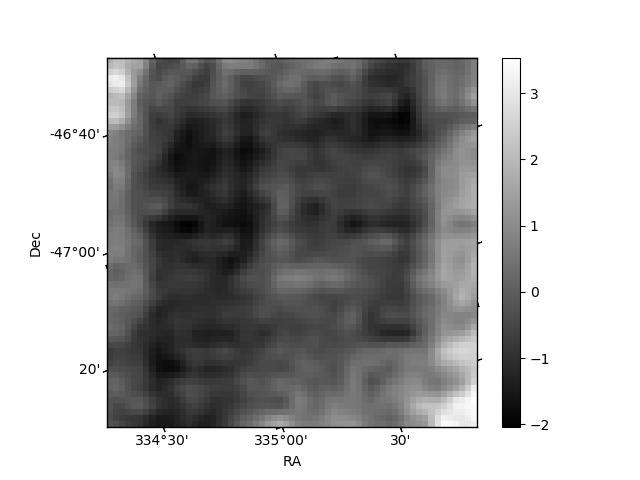
Histogram calculated using DETX and DETY for each event in the final _common_clean file
| Quadrant A | 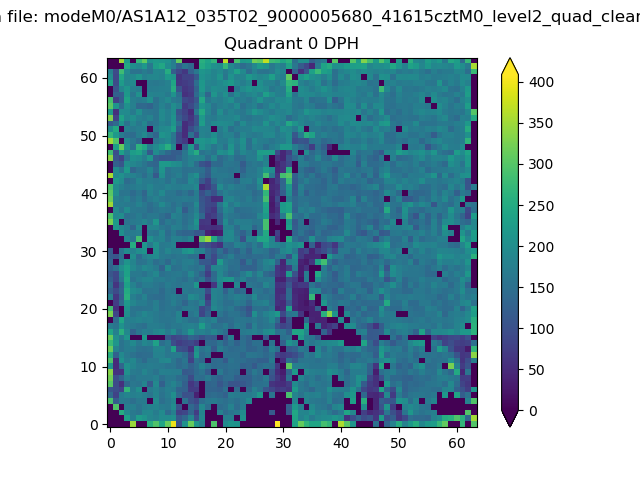 |
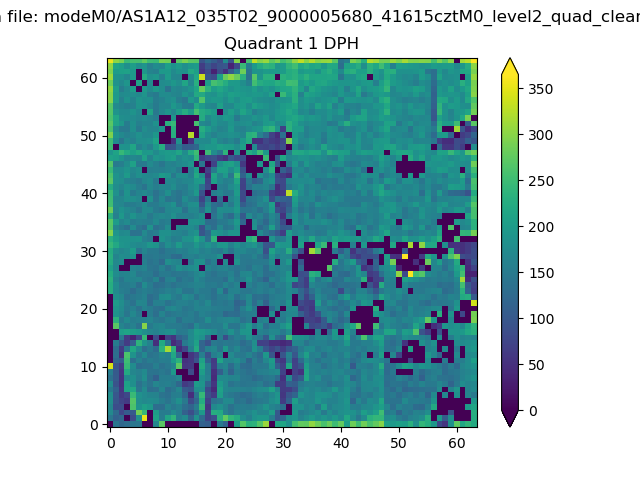 |
Quadrant B |
|---|---|---|---|
| Quadrant D | 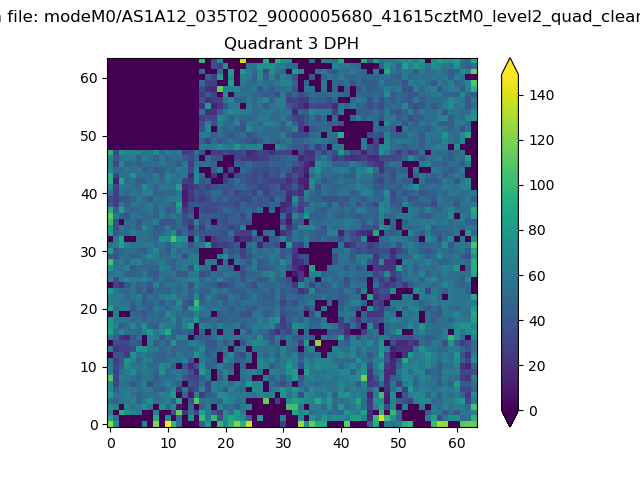 |
 |
Quadrant C |
| Plot type | Count rate plots | Images |
|---|---|---|
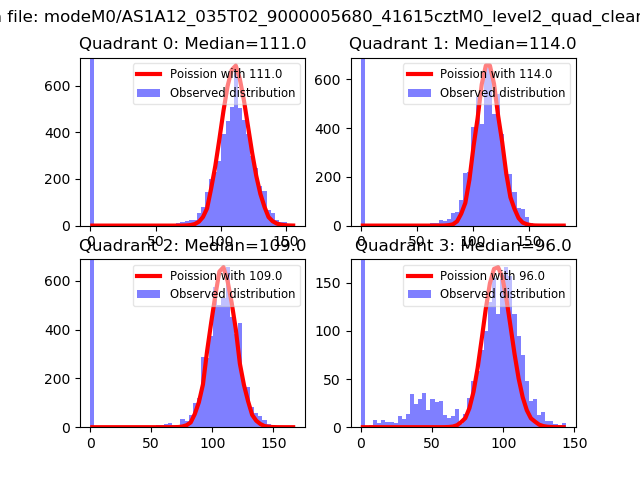
| Comparison with Poisson distribution Blue bars denote a histogram of data divided into 1 sec bins. Red curve is a Poisson curve with rate = median count rate of data. |
 |
 |
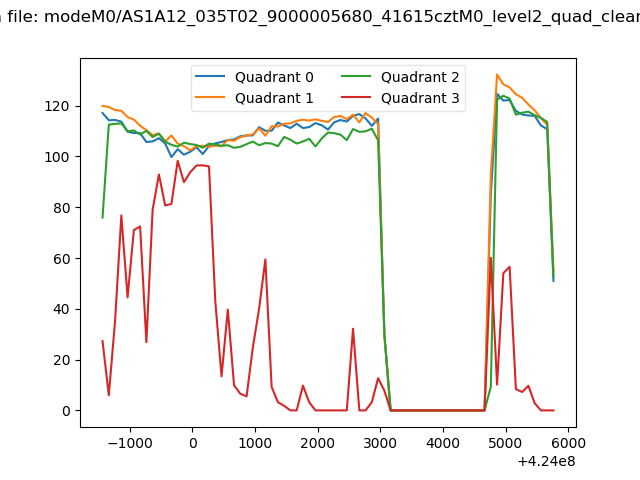
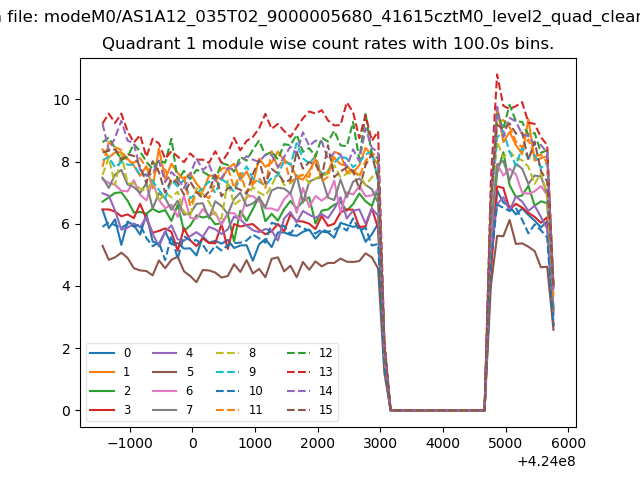
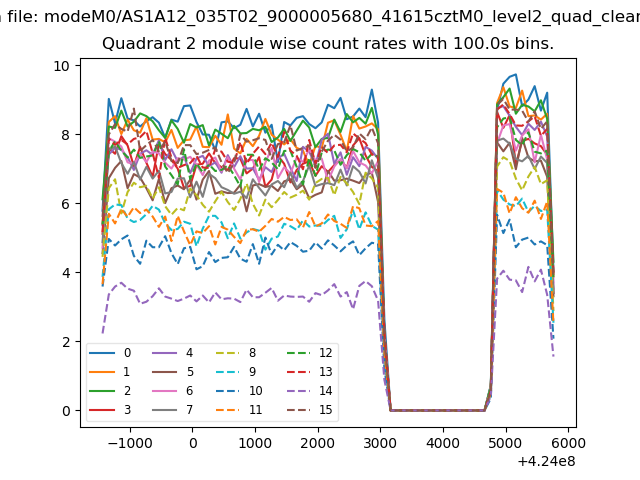
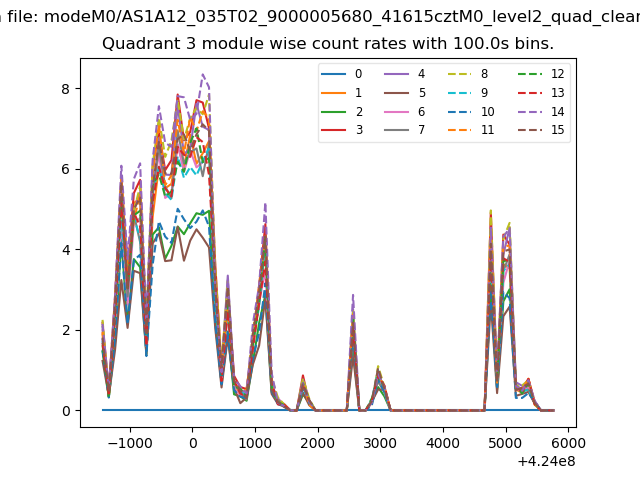
| Quadrant-wise count rates Data is divided into 100 sec bins |
 |
|
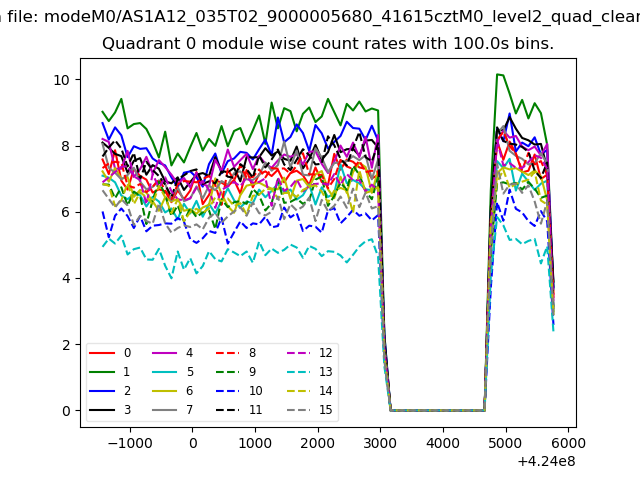
| Module-wise count rates for Quadrant A Data is divided into 100 sec bins |
 |
 |
| Module-wise count rates for Quadrant B Data is divided into 100 sec bins |
 |
 |
| Module-wise count rates for Quadrant C Data is divided into 100 sec bins |
 |
 |
| Module-wise count rates for Quadrant D Data is divided into 100 sec bins |
 |
 |
| Parameter | Plot |
|---|---|
| CZT HV Monitor | 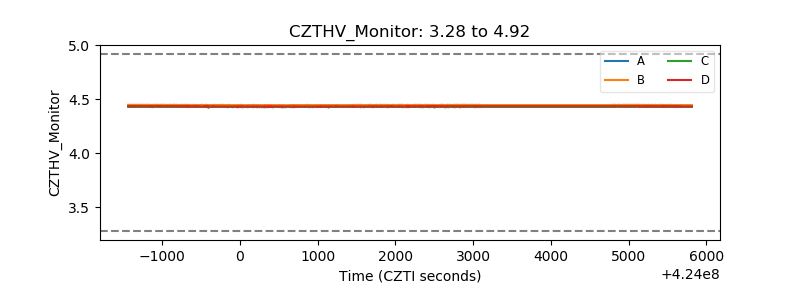 |
| D_VDD | 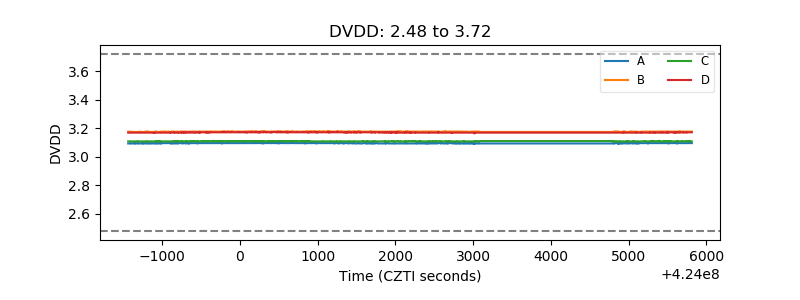 |
| Temperature 1 | 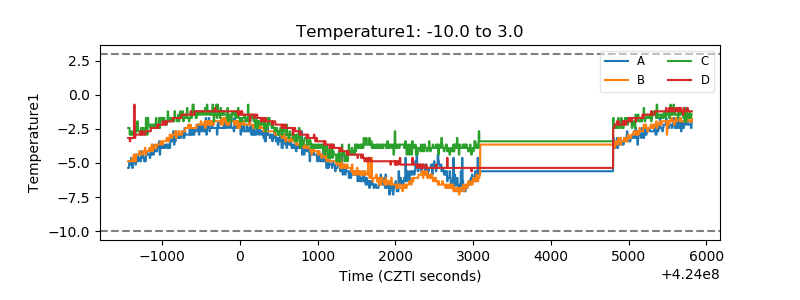 |
| Veto HV Monitor | 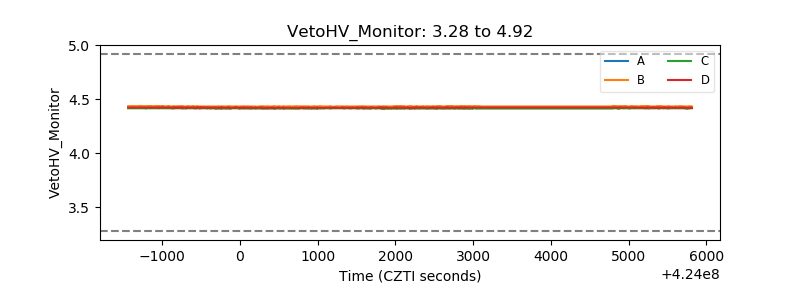 |
| Veto LLD | 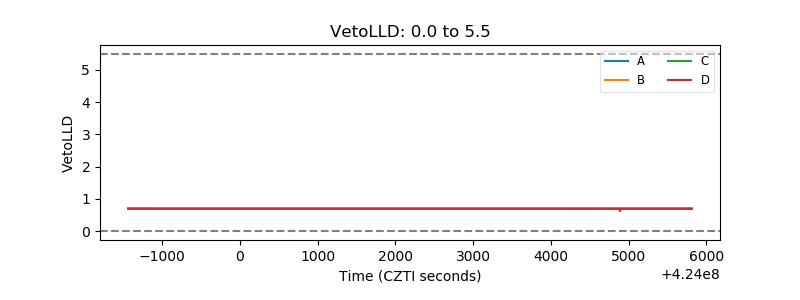 |
| Alpha Counter | 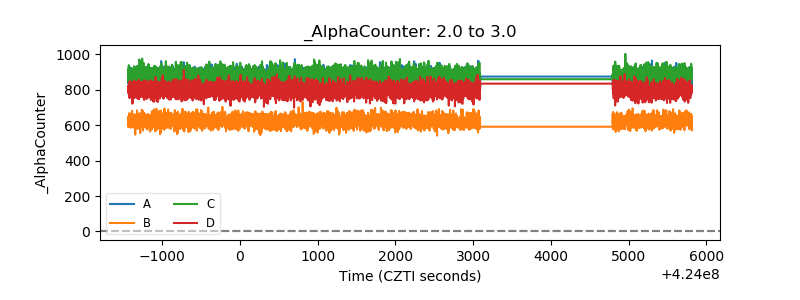 |
| _CPM_Rate | 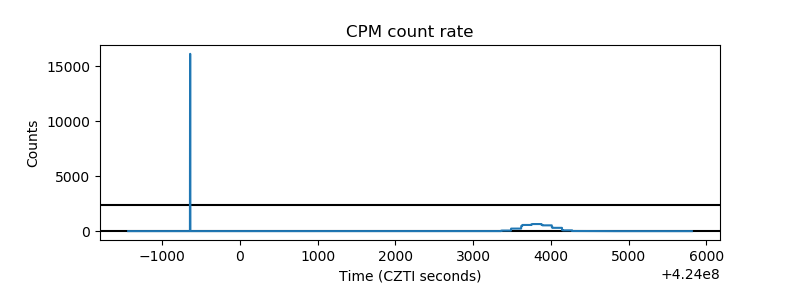 |
| CZT Counter | 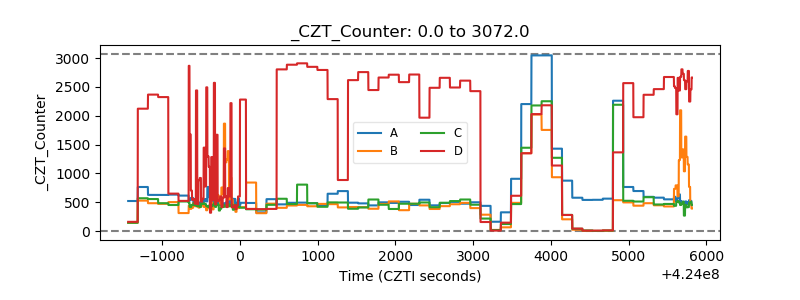 |
| +2.5 Volts monitor |  |
| +5 Volts monitor |  |
| _ROLL_ROT | 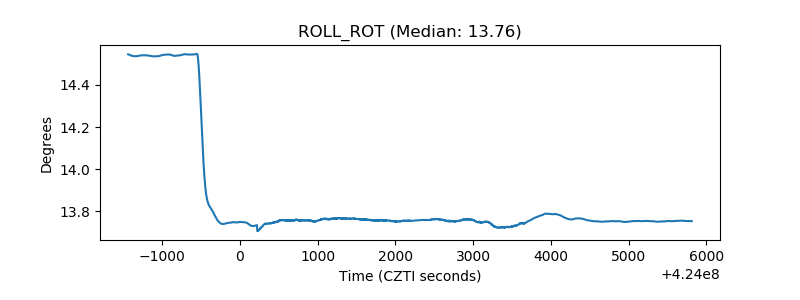 |
| _Roll_DEC | 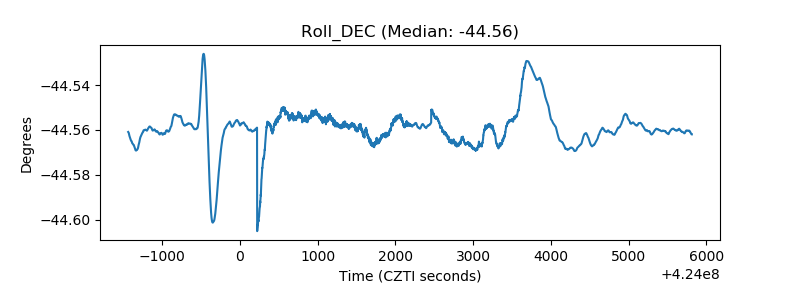 |
| _Roll_RA | 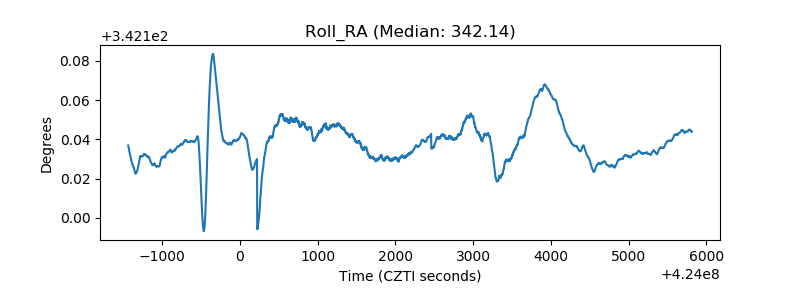 |
| Veto Counter | 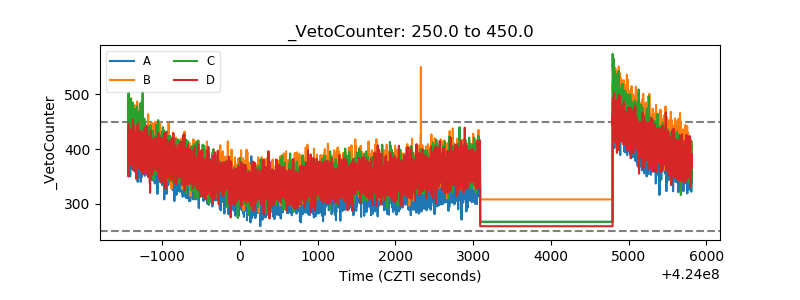 |