| Param | Original file | Final file |
|---|---|---|
| Filename | modeM0/AS1A12_035T02_9000005680_41617cztM0_level2.fits | modeM0/AS1A12_035T02_9000005680_41617cztM0_level2_quad_clean.evt |
| Size (bytes) | 601,669,440 | 78,816,960 |
| Size | 573.8 MB | 75.2 MB |
| Events in quadrant A | 3,010,090 | 638,489 |
| Events in quadrant B | 3,004,041 | 636,929 |
| Events in quadrant C | 3,004,957 | 606,667 |
| Events in quadrant D | 12,829,572 | 123,481 |
| Mode SS | |||
|---|---|---|---|
| Quadrant | BADHDUFLAG | Total packets | Discarded packets |
| A | 0 | 112 | 0 |
| B | 0 | 112 | 0 |
| C | 0 | 112 | 0 |
| D | 0 | 112 | 0 |
| Mode M0 | |||
|---|---|---|---|
| Quadrant | BADHDUFLAG | Total packets | Discarded packets |
| A | 0 | 12168 | 1 |
| B | 0 | 12479 | 1 |
| C | 0 | 12213 | 4 |
| D | 0 | 41813 | 1 |
| Mode M9 | |||
|---|---|---|---|
| Quadrant | BADHDUFLAG | Total packets | Discarded packets |
| A | 0 | 18 | 0 |
| B | 0 | 18 | 0 |
| C | 0 | 18 | 0 |
| D | 0 | 18 | 0 |
| Quadrant | Total seconds | Saturated seconds | Saturation percentage |
|---|---|---|---|
| A | 5436 | 17 | 0.312730% |
| B | 5436 | 172 | 3.164091% |
| C | 5436 | 124 | 2.281089% |
| D | 5436 | 4561 | 83.903606% |
Noise dominated data is calculated using 1-second bins in cleaned event files. If a bin has >2000 counts, and if more than 50% of those come from <1% of pixels, then it is considered to be noise-dominated and hence unusable.
| Quadrant | # 1 sec bins | Bins with >0 counts | Bins with >2000 counts | High rate bins dominated by noise | Noise dominated (total time) | Noise dominated (detector-on time) | Marked lightcurve |
|---|---|---|---|---|---|---|---|
| A | 7289 | 5437 | 4 | 4 | 0.05% | 0.07% | 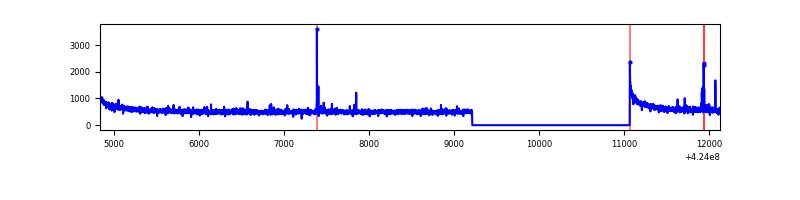 |
| B | 7289 | 5437 | 113 | 113 | 1.55% | 2.08% | 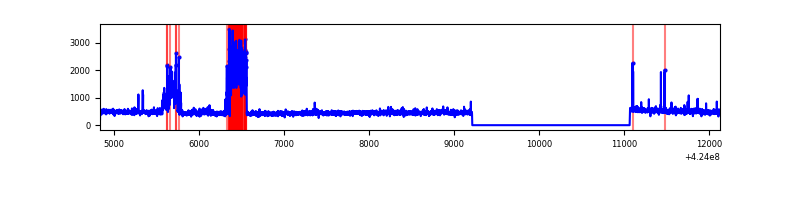 |
| C | 7289 | 5437 | 112 | 112 | 1.54% | 2.06% | 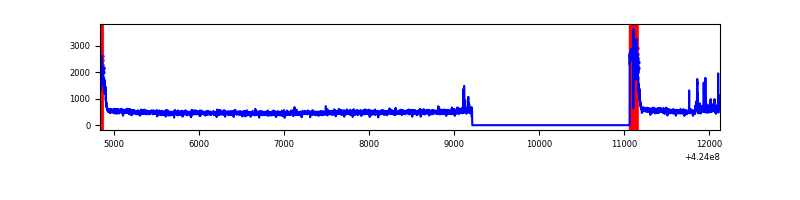 |
| D | 7289 | 5436 | 4264 | 4264 | 58.50% | 78.44% | 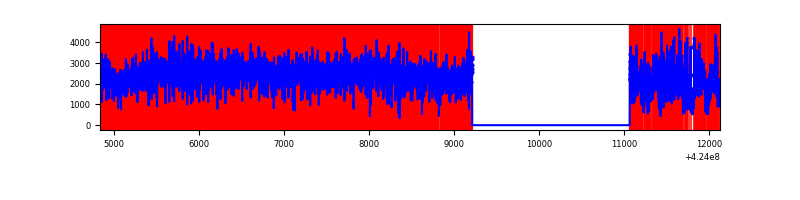 |
Top three noisy pixels from each quadrant. If the there are fewer than three noisy pixels in the level2.evt file, extra rows are filled as -1
| Pixel properties | Quadrant properties | ||||||
|---|---|---|---|---|---|---|---|
| Quadrant | DetID | PixID | Counts | Sigma | Mean | Median | Sigma |
| A | 10 | 83 | 530752 | 4123.41 | 625 | 611 | 128.6 |
| A | 2 | 79 | 21188 | 160.05 | 625 | 611 | 128.6 |
| A | 13 | 248 | 18501 | 139.15 | 625 | 611 | 128.6 |
| B | 0 | 186 | 518294 | 4435.04 | 613 | 598 | 116.7 |
| B | 0 | 189 | 27453 | 230.06 | 613 | 598 | 116.7 |
| B | 5 | 255 | 22683 | 189.2 | 613 | 598 | 116.7 |
| C | 0 | 10 | 354464 | 2541.46 | 595 | 598 | 139.2 |
| C | 15 | 214 | 238355 | 1707.57 | 595 | 598 | 139.2 |
| C | 14 | 254 | 63711 | 453.28 | 595 | 598 | 139.2 |
| D | 12 | 79 | 10423201 | 101886.13 | 421 | 409 | 102.3 |
| D | 13 | 249 | 369873 | 3611.63 | 421 | 409 | 102.3 |
| D | 2 | 249 | 278188 | 2715.38 | 421 | 409 | 102.3 |
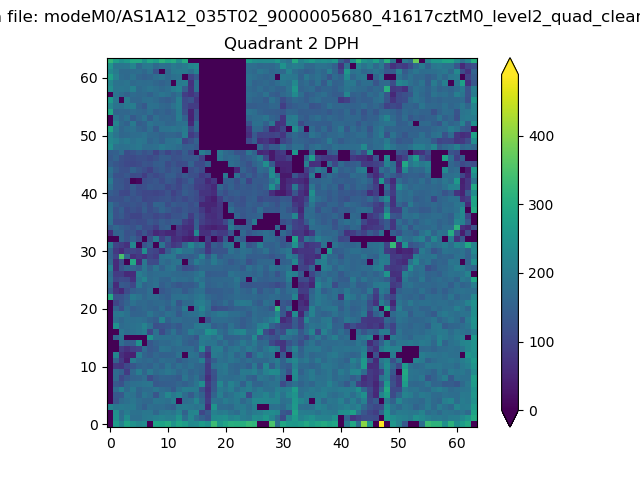
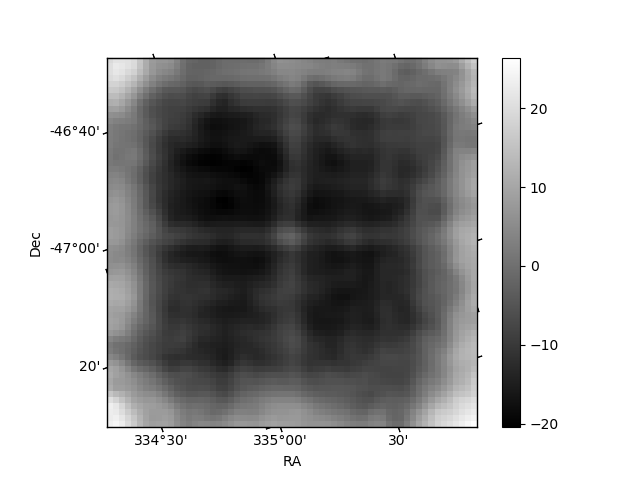
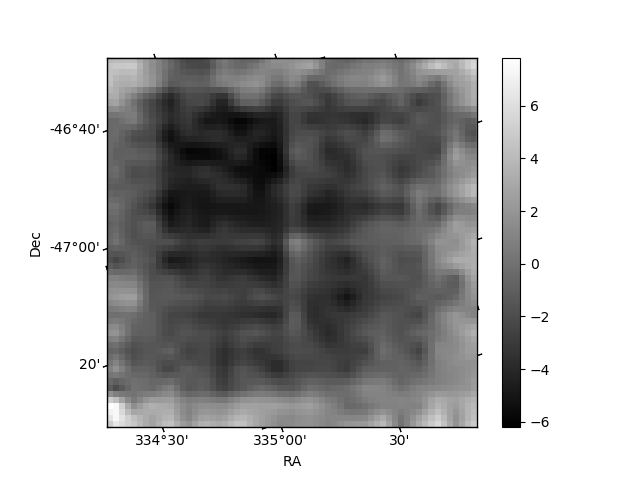
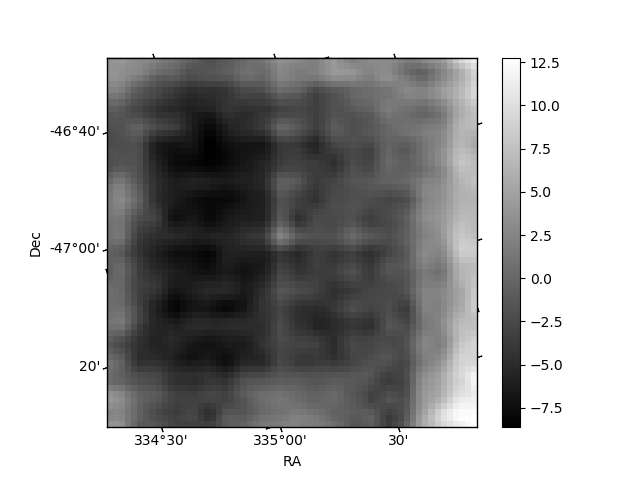
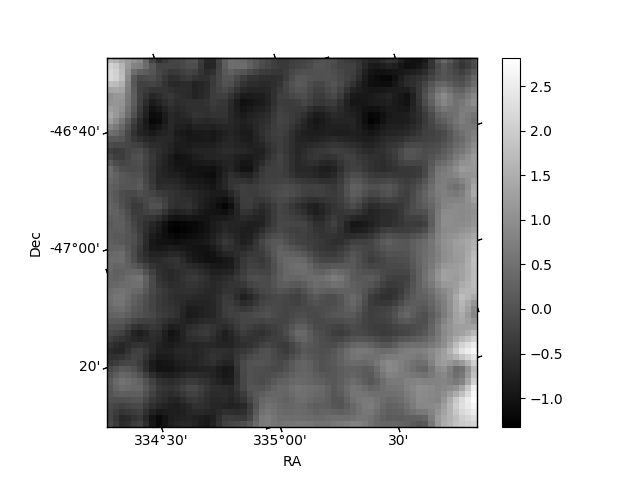
Histogram calculated using DETX and DETY for each event in the final _common_clean file
| Quadrant A | 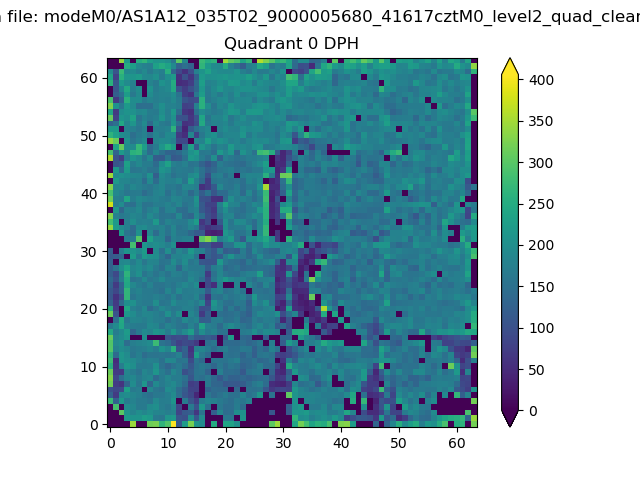 |
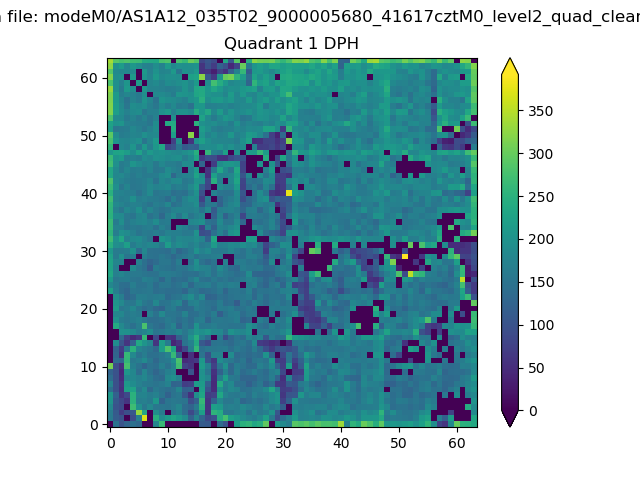 |
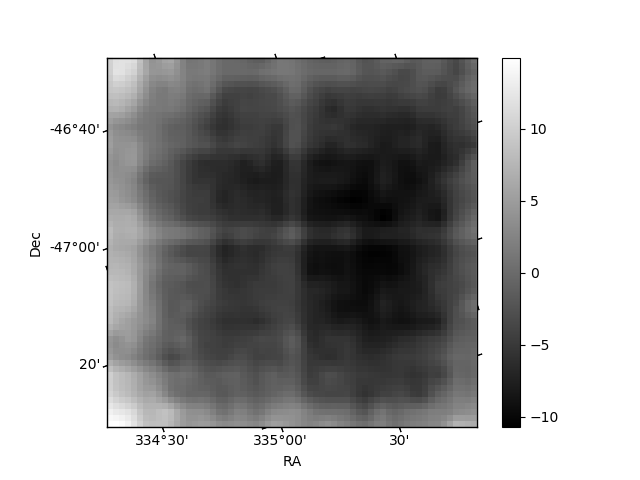
Quadrant B |
|---|---|---|---|
| Quadrant D | 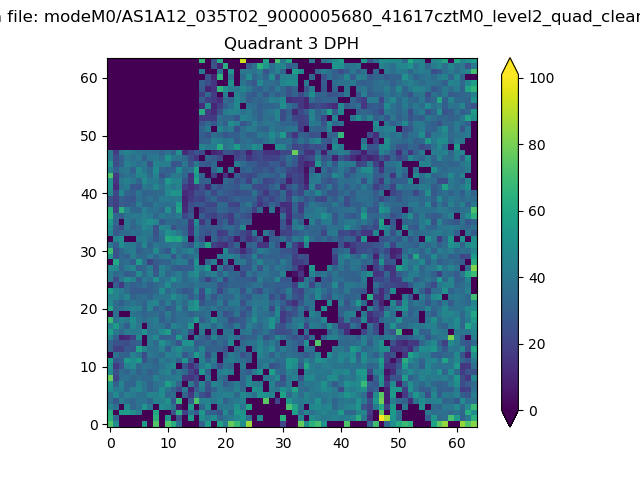 |
 |
Quadrant C |
| Plot type | Count rate plots | Images |
|---|---|---|
| Comparison with Poisson distribution Blue bars denote a histogram of data divided into 1 sec bins. Red curve is a Poisson curve with rate = median count rate of data. |
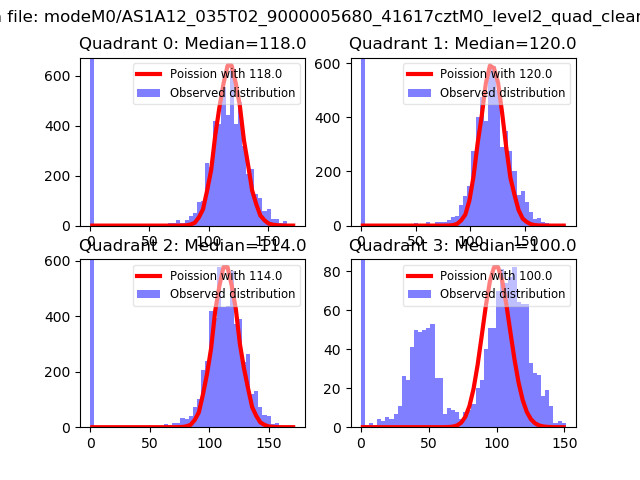 |
 |
| Quadrant-wise count rates Data is divided into 100 sec bins |
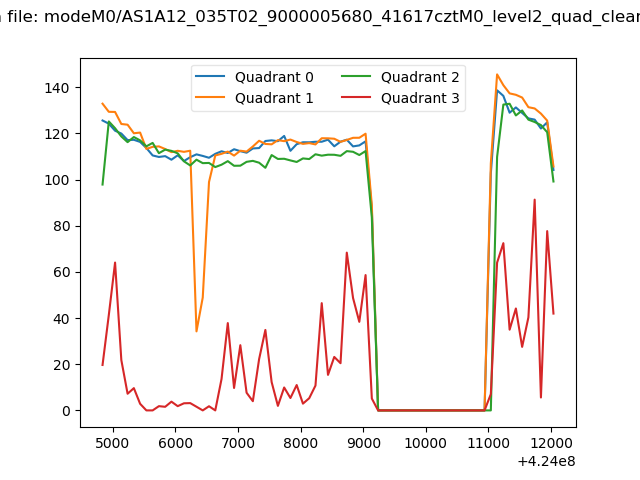 |
|
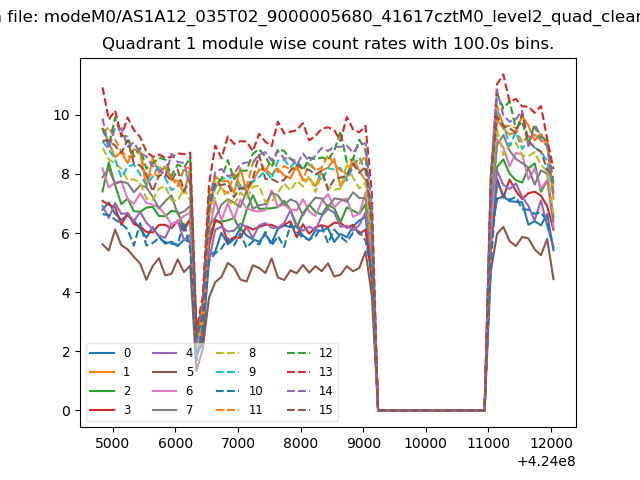
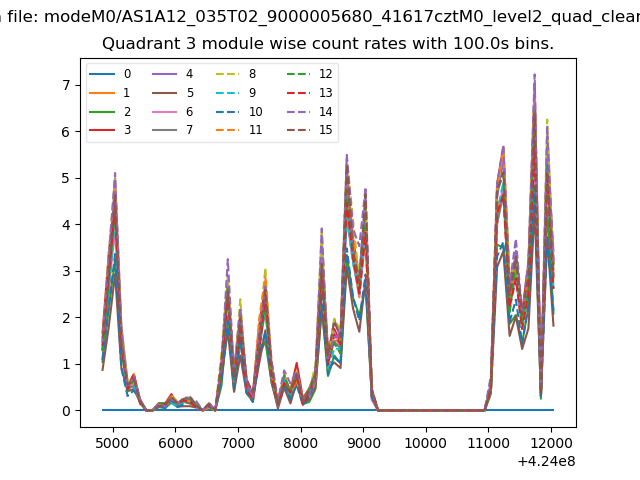
| Module-wise count rates for Quadrant A Data is divided into 100 sec bins |
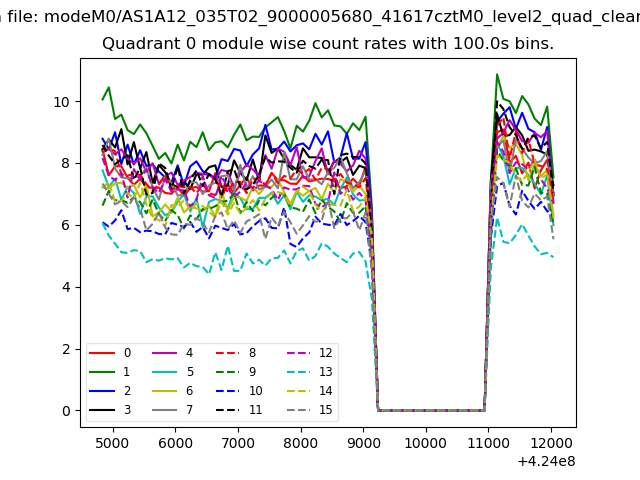 |
 |
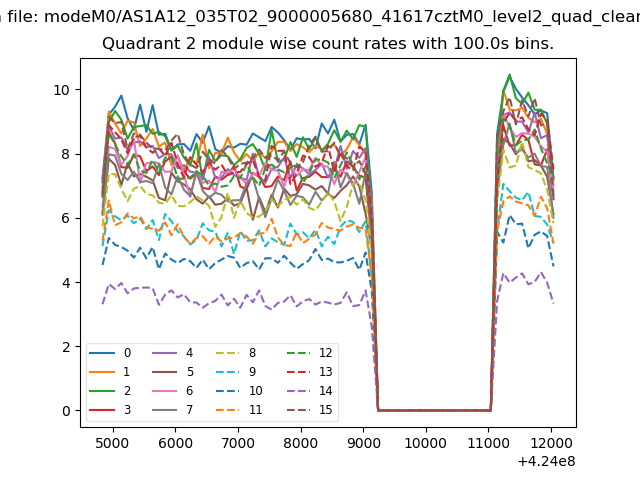
| Module-wise count rates for Quadrant B Data is divided into 100 sec bins |
 |
 |
| Module-wise count rates for Quadrant C Data is divided into 100 sec bins |
 |
 |
| Module-wise count rates for Quadrant D Data is divided into 100 sec bins |
 |
 |
| Parameter | Plot |
|---|---|
| CZT HV Monitor | 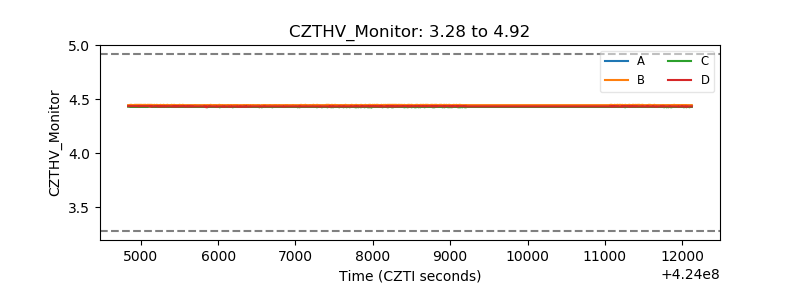 |
| D_VDD | 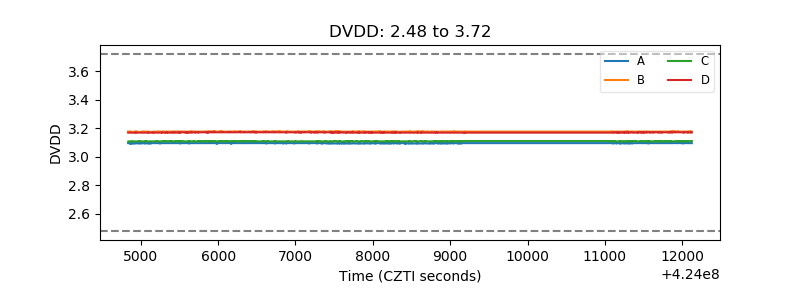 |
| Temperature 1 | 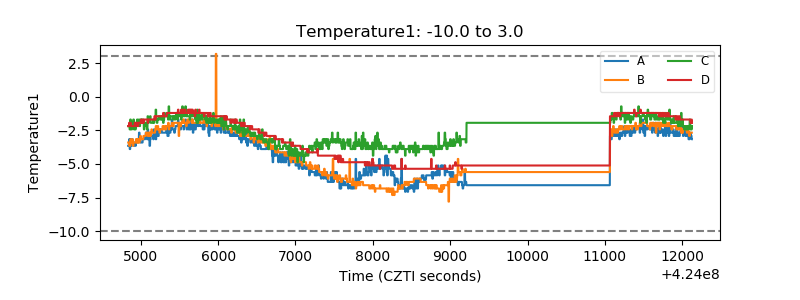 |
| Veto HV Monitor | 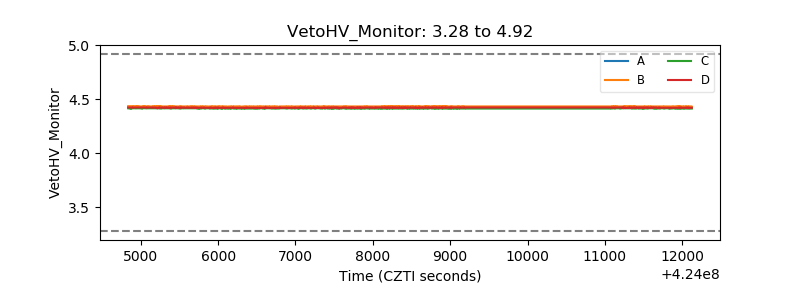 |
| Veto LLD | 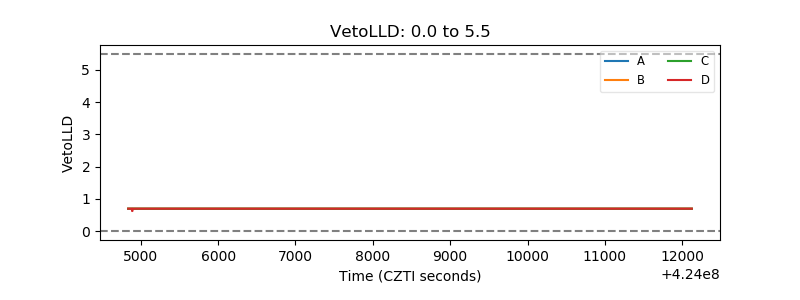 |
| Alpha Counter | 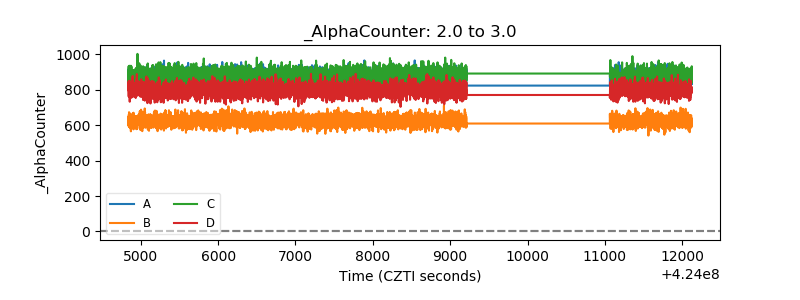 |
| _CPM_Rate | 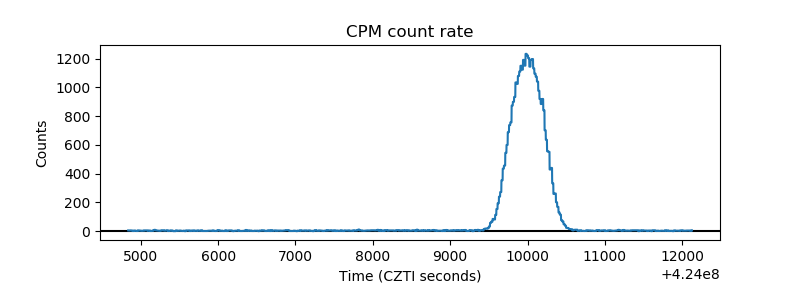 |
| CZT Counter | 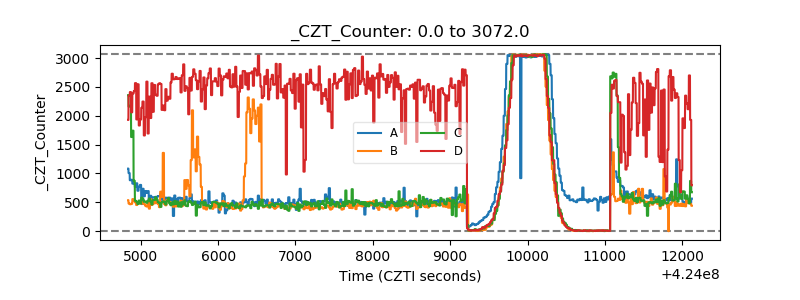 |
| +2.5 Volts monitor | 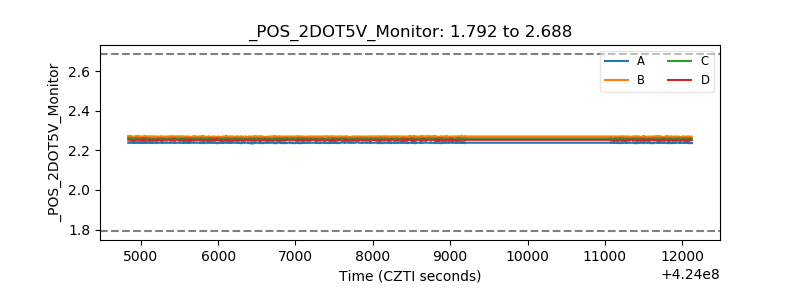 |
| +5 Volts monitor | 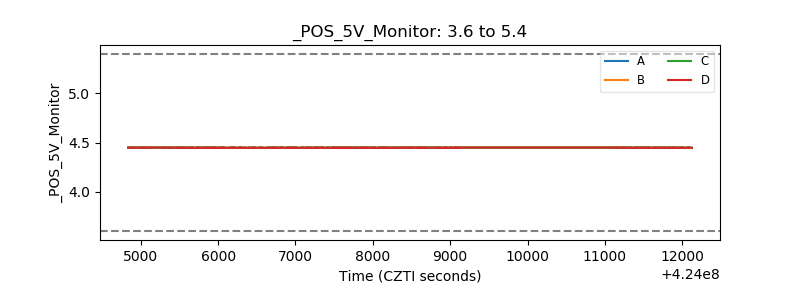 |
| _ROLL_ROT | 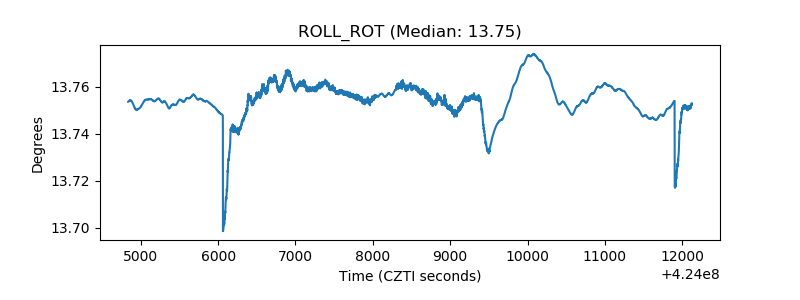 |
| _Roll_DEC |  |
| _Roll_RA | 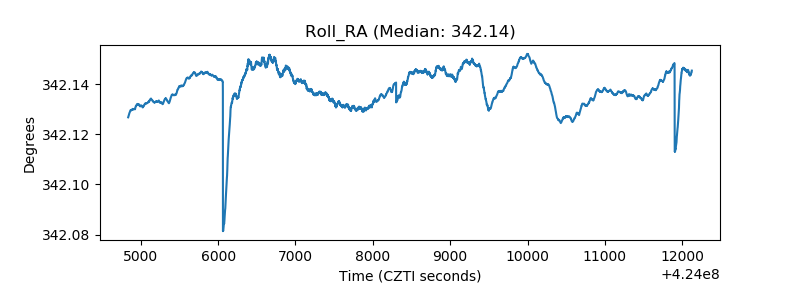 |
| Veto Counter | 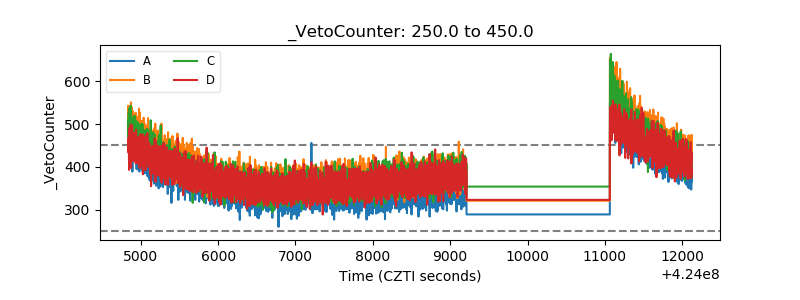 |