| Param | Original file | Final file |
|---|---|---|
| Filename | modeM0/AS1A12_035T02_9000005680_41618cztM0_level2.fits | modeM0/AS1A12_035T02_9000005680_41618cztM0_level2_quad_clean.evt |
| Size (bytes) | 563,734,080 | 82,350,720 |
| Size | 537.6 MB | 78.5 MB |
| Events in quadrant A | 2,993,099 | 655,291 |
| Events in quadrant B | 2,807,037 | 665,434 |
| Events in quadrant C | 3,163,921 | 599,355 |
| Events in quadrant D | 11,497,787 | 208,249 |
| Mode SS | |||
|---|---|---|---|
| Quadrant | BADHDUFLAG | Total packets | Discarded packets |
| A | 0 | 106 | 0 |
| B | 0 | 106 | 0 |
| C | 0 | 106 | 0 |
| D | 0 | 106 | 0 |
| Mode M0 | |||
|---|---|---|---|
| Quadrant | BADHDUFLAG | Total packets | Discarded packets |
| A | 0 | 12054 | 2 |
| B | 0 | 11665 | 2 |
| C | 0 | 12489 | 2 |
| D | 0 | 37726 | 2 |
| Mode M9 | |||
|---|---|---|---|
| Quadrant | BADHDUFLAG | Total packets | Discarded packets |
| A | 0 | 20 | 0 |
| B | 0 | 20 | 0 |
| C | 0 | 20 | 0 |
| D | 0 | 20 | 0 |
| Quadrant | Total seconds | Saturated seconds | Saturation percentage |
|---|---|---|---|
| A | 5215 | 18 | 0.345158% |
| B | 5216 | 83 | 1.591258% |
| C | 5216 | 210 | 4.026074% |
| D | 5216 | 3671 | 70.379601% |
Noise dominated data is calculated using 1-second bins in cleaned event files. If a bin has >2000 counts, and if more than 50% of those come from <1% of pixels, then it is considered to be noise-dominated and hence unusable.
| Quadrant | # 1 sec bins | Bins with >0 counts | Bins with >2000 counts | High rate bins dominated by noise | Noise dominated (total time) | Noise dominated (detector-on time) | Marked lightcurve |
|---|---|---|---|---|---|---|---|
| A | 7189 | 5216 | 5 | 5 | 0.07% | 0.10% | 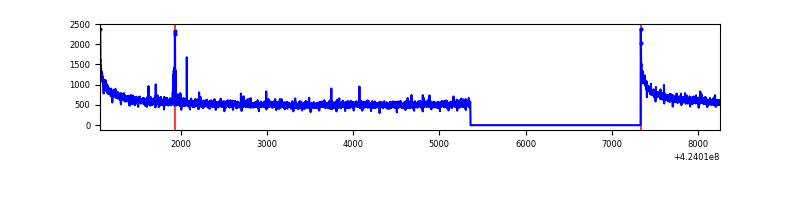 |
| B | 7190 | 5217 | 45 | 45 | 0.63% | 0.86% | 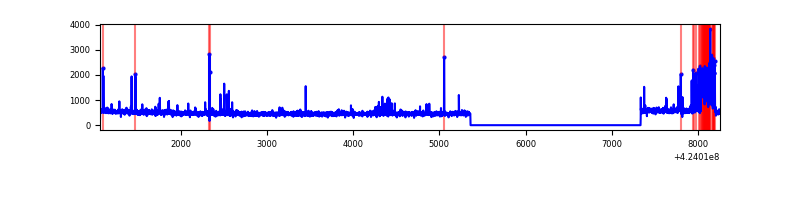 |
| C | 7190 | 5217 | 189 | 189 | 2.63% | 3.62% | 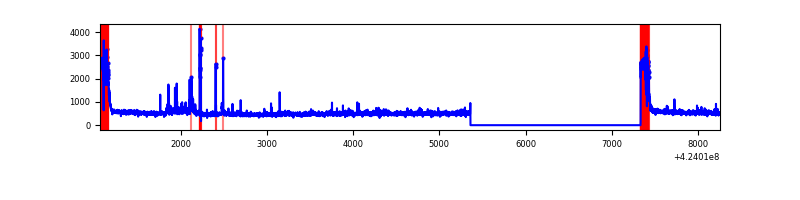 |
| D | 7190 | 5217 | 3484 | 3484 | 48.46% | 66.78% | 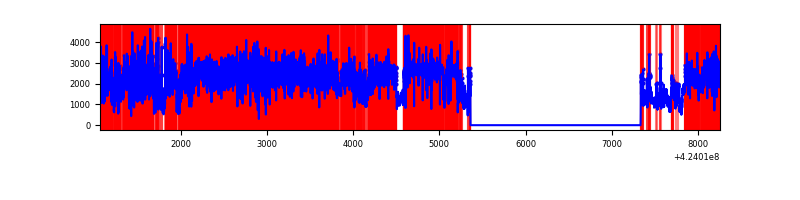 |
Top three noisy pixels from each quadrant. If the there are fewer than three noisy pixels in the level2.evt file, extra rows are filled as -1
| Pixel properties | Quadrant properties | ||||||
|---|---|---|---|---|---|---|---|
| Quadrant | DetID | PixID | Counts | Sigma | Mean | Median | Sigma |
| A | 10 | 83 | 541757 | 4296.54 | 623 | 611 | 125.9 |
| A | 13 | 248 | 19421 | 149.35 | 623 | 611 | 125.9 |
| A | 2 | 79 | 14947 | 113.82 | 623 | 611 | 125.9 |
| B | 0 | 186 | 176404 | 1499.9 | 615 | 600 | 117.2 |
| B | 5 | 255 | 149278 | 1268.47 | 615 | 600 | 117.2 |
| B | 0 | 189 | 33132 | 277.55 | 615 | 600 | 117.2 |
| C | 0 | 10 | 481328 | 3582.27 | 580 | 582 | 134.2 |
| C | 15 | 214 | 226605 | 1684.2 | 580 | 582 | 134.2 |
| C | 14 | 254 | 126384 | 937.41 | 580 | 582 | 134.2 |
| D | 12 | 79 | 8475917 | 78533.87 | 444 | 432 | 107.9 |
| D | 13 | 249 | 946100 | 8762.56 | 444 | 432 | 107.9 |
| D | 2 | 249 | 178011 | 1645.45 | 444 | 432 | 107.9 |
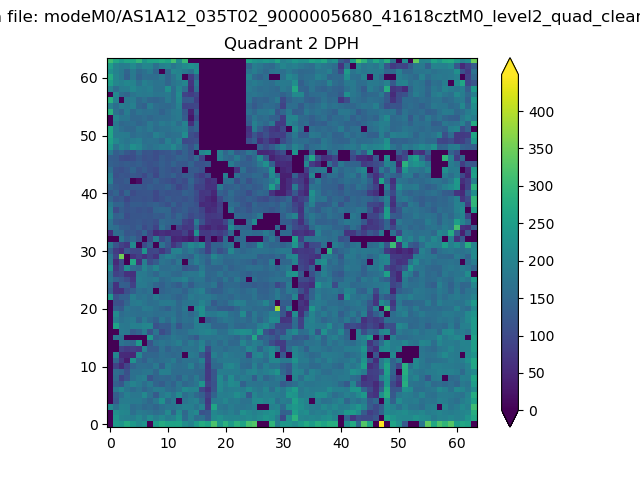
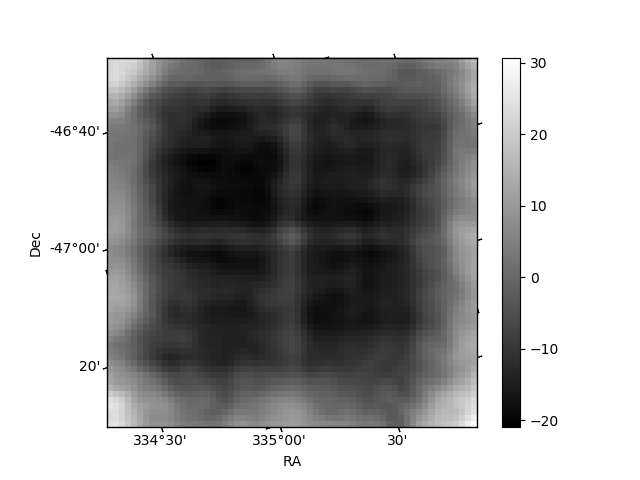
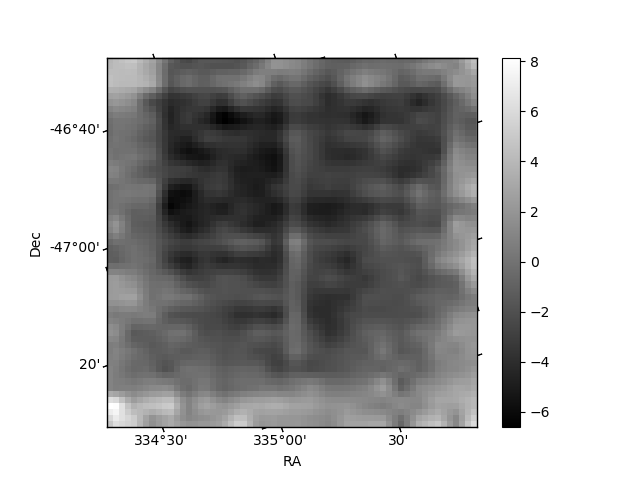
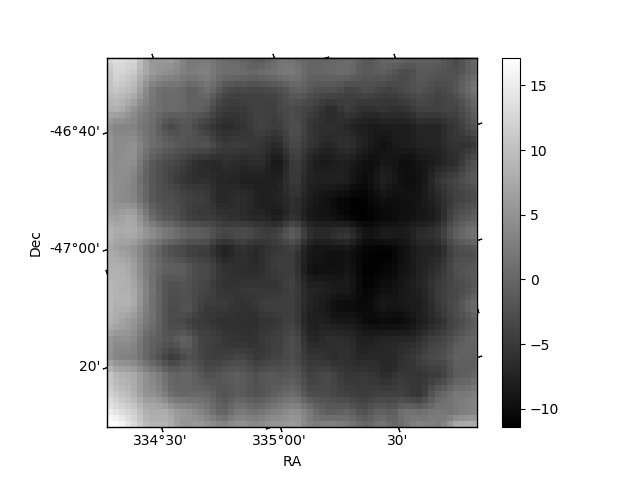
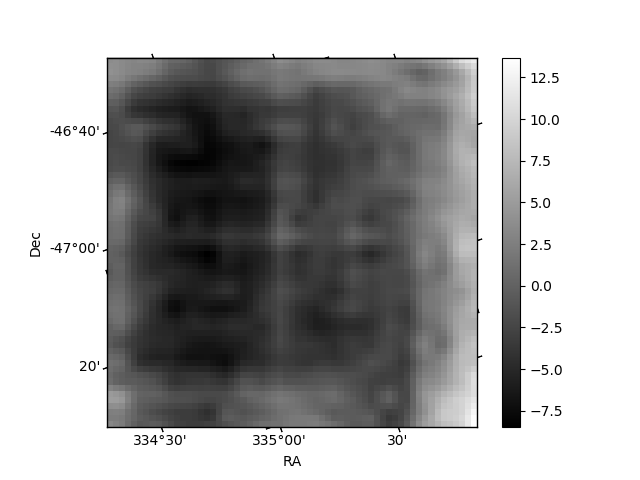
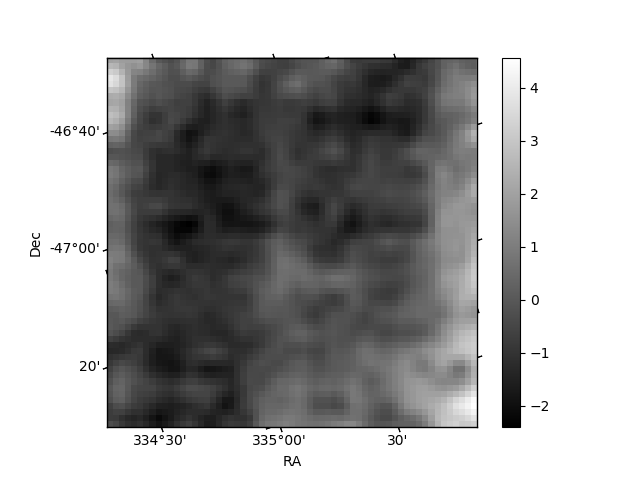
Histogram calculated using DETX and DETY for each event in the final _common_clean file
| Quadrant A | 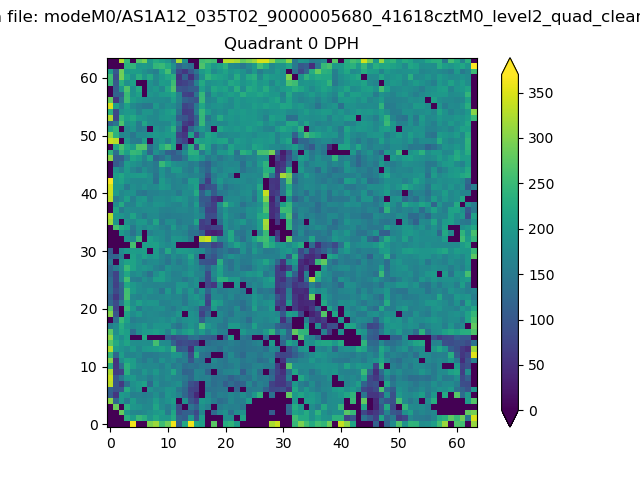 |
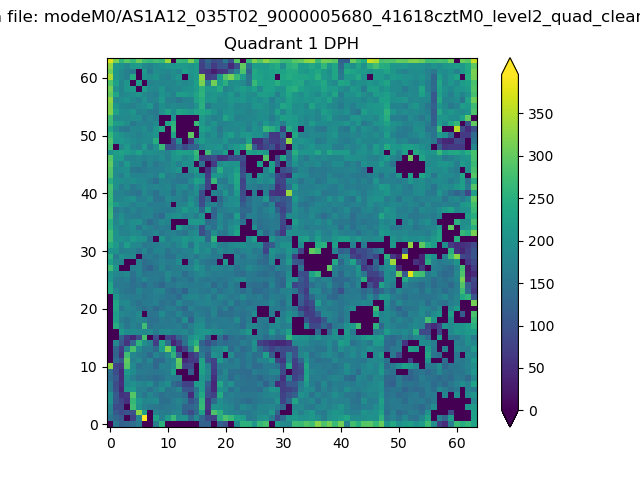 |
Quadrant B |
|---|---|---|---|
| Quadrant D | 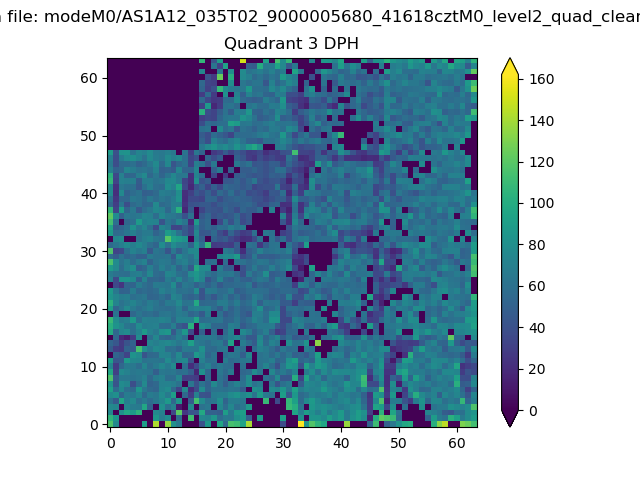 |
 |
Quadrant C |
| Plot type | Count rate plots | Images |
|---|---|---|
| Comparison with Poisson distribution Blue bars denote a histogram of data divided into 1 sec bins. Red curve is a Poisson curve with rate = median count rate of data. |
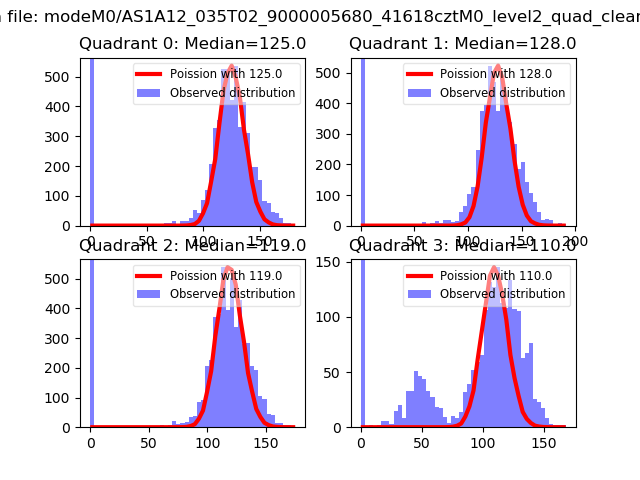 |
 |
| Quadrant-wise count rates Data is divided into 100 sec bins |
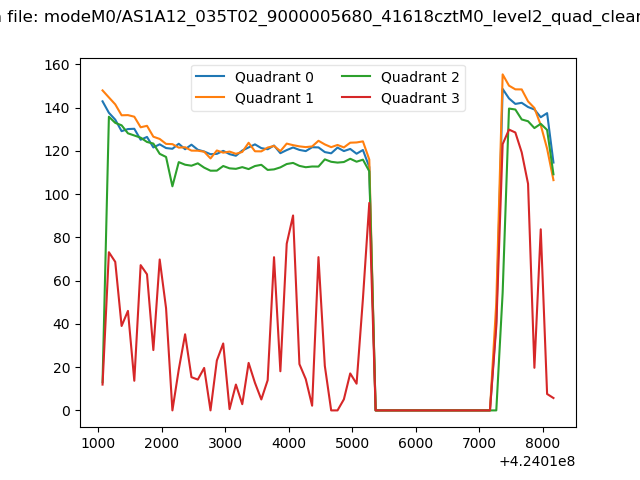 |
|
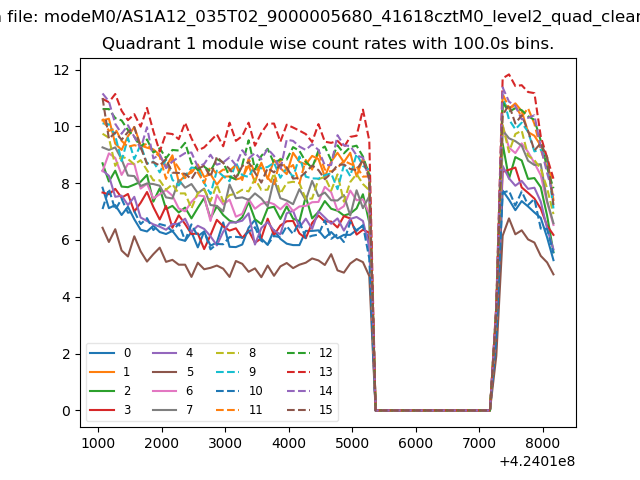
| Module-wise count rates for Quadrant A Data is divided into 100 sec bins |
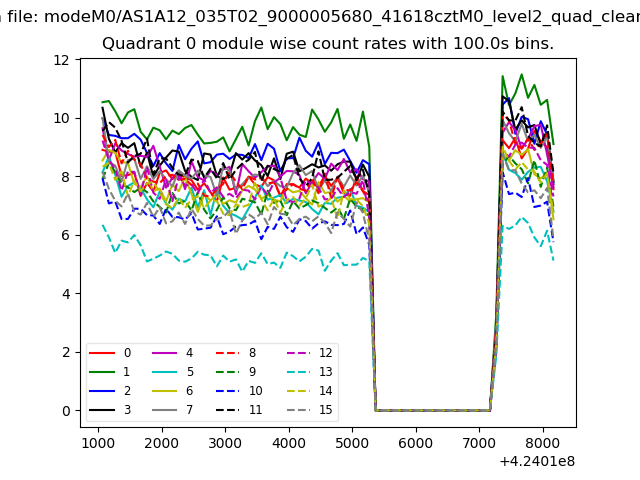 |
 |
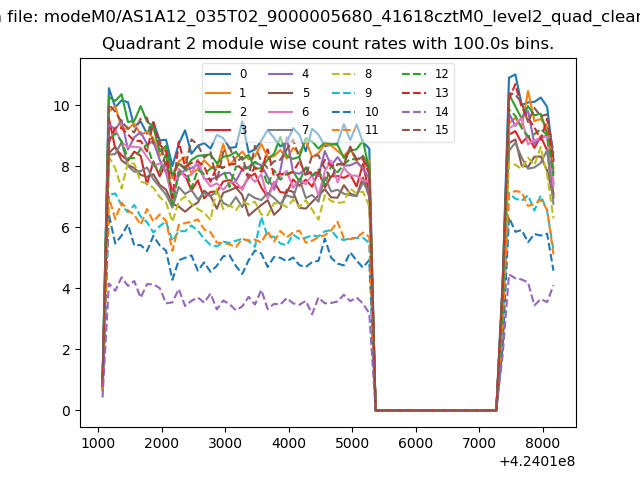
| Module-wise count rates for Quadrant B Data is divided into 100 sec bins |
 |
 |
| Module-wise count rates for Quadrant C Data is divided into 100 sec bins |
 |
 |
| Module-wise count rates for Quadrant D Data is divided into 100 sec bins |
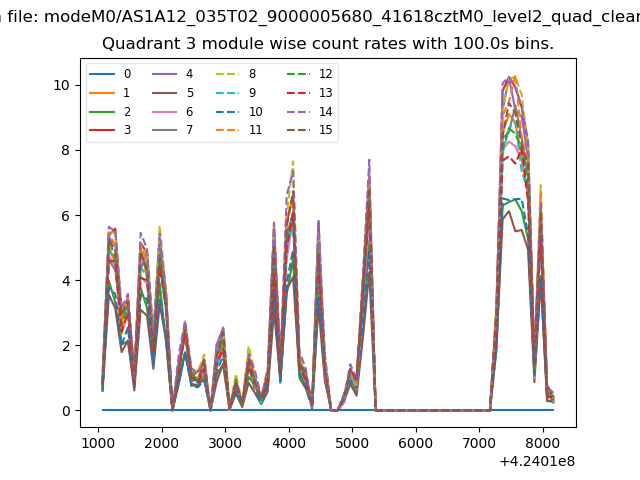 |
 |
| Parameter | Plot |
|---|---|
| CZT HV Monitor | 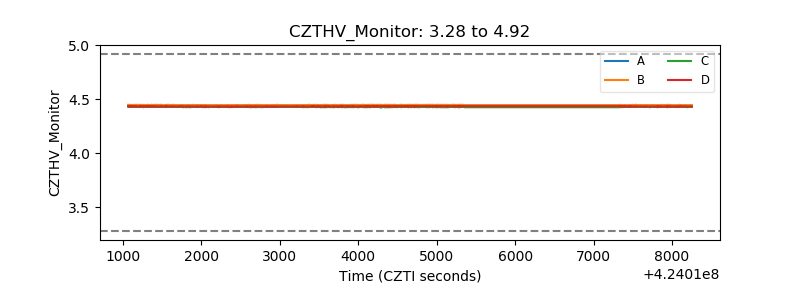 |
| D_VDD | 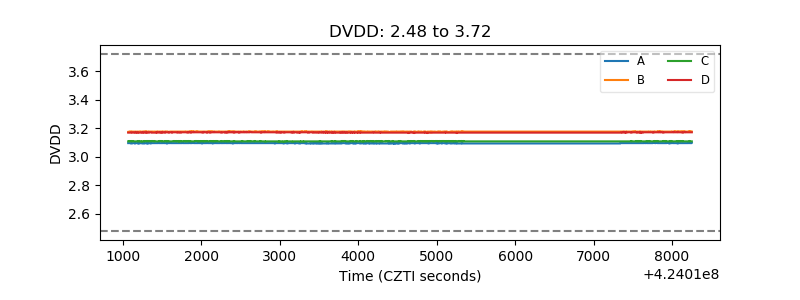 |
| Temperature 1 | 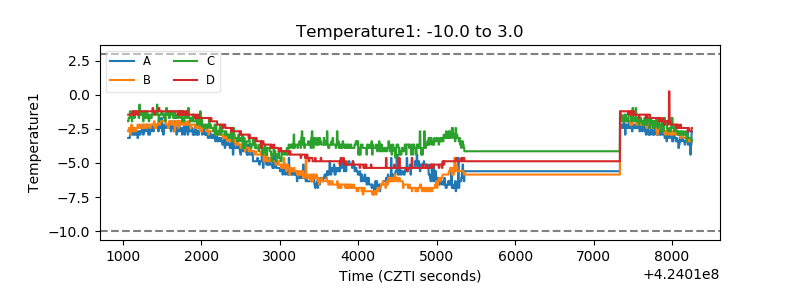 |
| Veto HV Monitor | 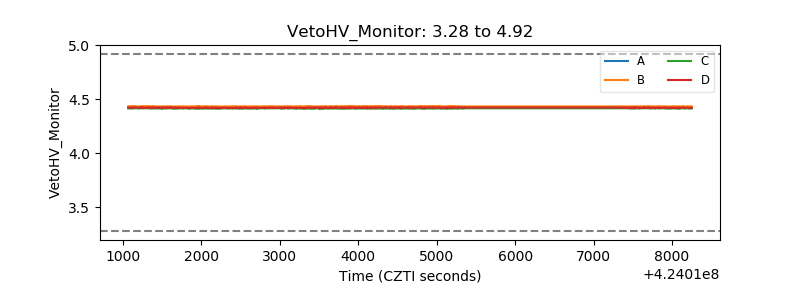 |
| Veto LLD | 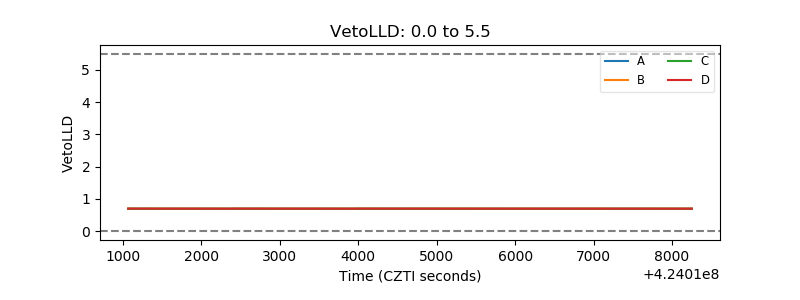 |
| Alpha Counter | 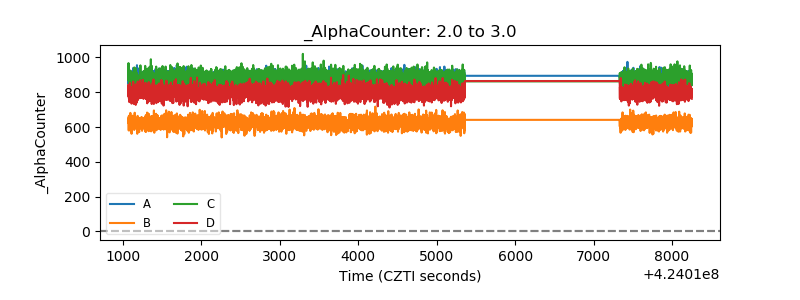 |
| _CPM_Rate | 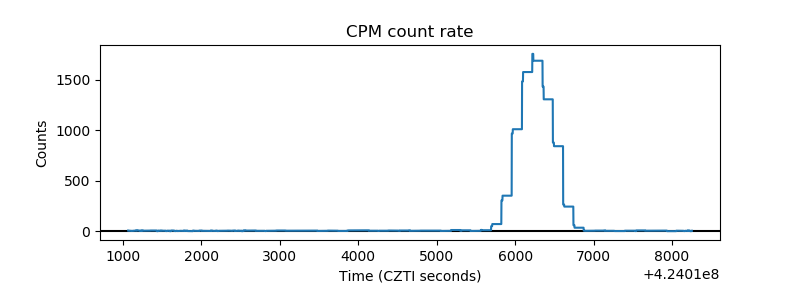 |
| CZT Counter | 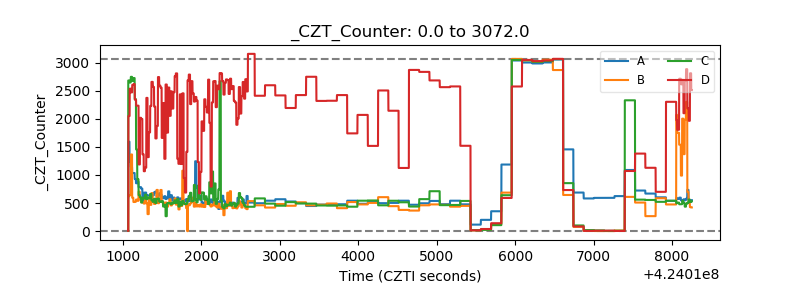 |
| +2.5 Volts monitor | 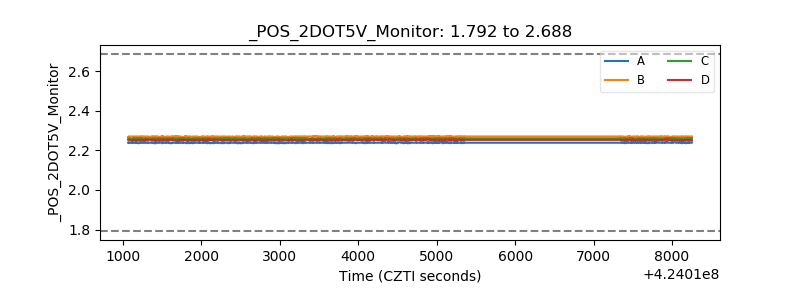 |
| +5 Volts monitor | 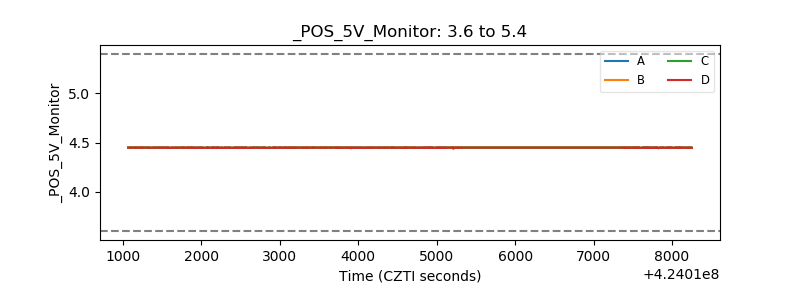 |
| _ROLL_ROT | 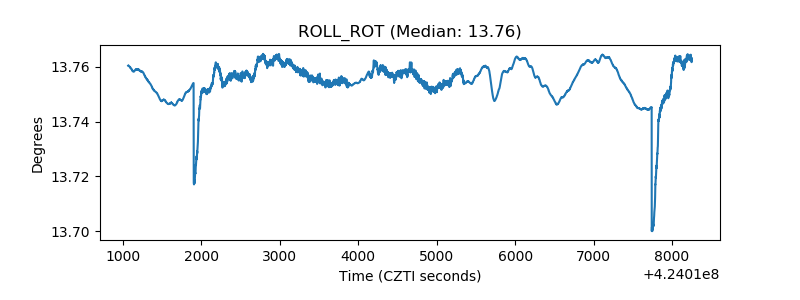 |
| _Roll_DEC |  |
| _Roll_RA | 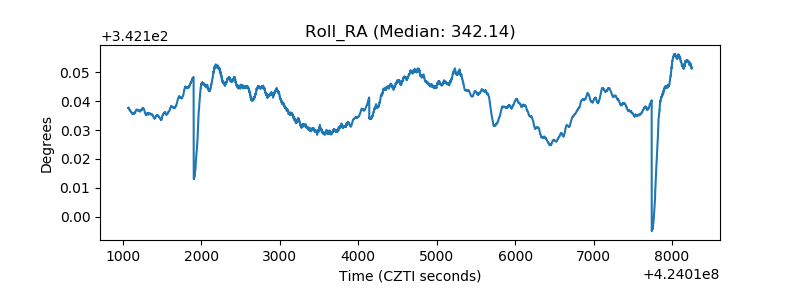 |
| Veto Counter | 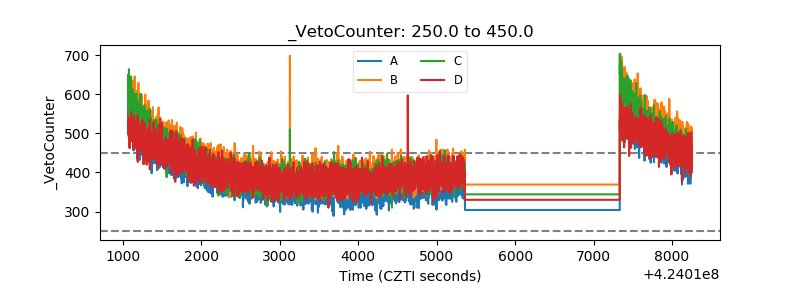 |