| Param | Original file | Final file |
|---|---|---|
| Filename | modeM0/AS1A12_035T02_9000005680_41619cztM0_level2.fits | modeM0/AS1A12_035T02_9000005680_41619cztM0_level2_quad_clean.evt |
| Size (bytes) | 509,544,000 | 84,317,760 |
| Size | 485.9 MB | 80.4 MB |
| Events in quadrant A | 2,900,097 | 654,046 |
| Events in quadrant B | 3,036,435 | 656,791 |
| Events in quadrant C | 3,035,451 | 593,380 |
| Events in quadrant D | 9,499,949 | 297,757 |
| Mode SS | |||
|---|---|---|---|
| Quadrant | BADHDUFLAG | Total packets | Discarded packets |
| A | 0 | 102 | 0 |
| B | 0 | 102 | 0 |
| C | 0 | 102 | 0 |
| D | 0 | 102 | 0 |
| Mode M0 | |||
|---|---|---|---|
| Quadrant | BADHDUFLAG | Total packets | Discarded packets |
| A | 0 | 11649 | 2 |
| B | 0 | 12138 | 2 |
| C | 0 | 11860 | 2 |
| D | 0 | 31633 | 2 |
| Mode M9 | |||
|---|---|---|---|
| Quadrant | BADHDUFLAG | Total packets | Discarded packets |
| A | 0 | 29 | 0 |
| B | 0 | 30 | 0 |
| C | 0 | 30 | 0 |
| D | 0 | 30 | 0 |
| Quadrant | Total seconds | Saturated seconds | Saturation percentage |
|---|---|---|---|
| A | 5011 | 19 | 0.379166% |
| B | 5010 | 150 | 2.994012% |
| C | 5010 | 209 | 4.171657% |
| D | 5010 | 2617 | 52.235529% |
Noise dominated data is calculated using 1-second bins in cleaned event files. If a bin has >2000 counts, and if more than 50% of those come from <1% of pixels, then it is considered to be noise-dominated and hence unusable.
| Quadrant | # 1 sec bins | Bins with >0 counts | Bins with >2000 counts | High rate bins dominated by noise | Noise dominated (total time) | Noise dominated (detector-on time) | Marked lightcurve |
|---|---|---|---|---|---|---|---|
| A | 7073 | 5012 | 4 | 4 | 0.06% | 0.08% | 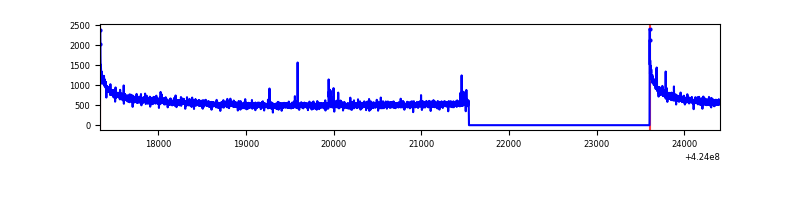 |
| B | 7072 | 5011 | 85 | 85 | 1.20% | 1.70% | 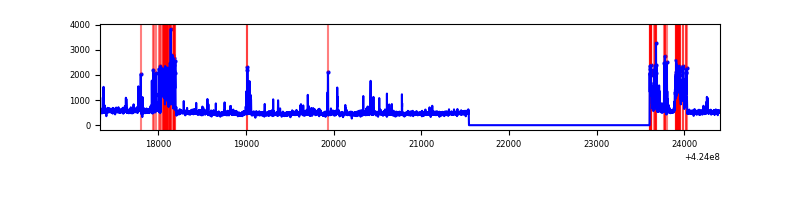 |
| C | 7072 | 5011 | 192 | 192 | 2.71% | 3.83% | 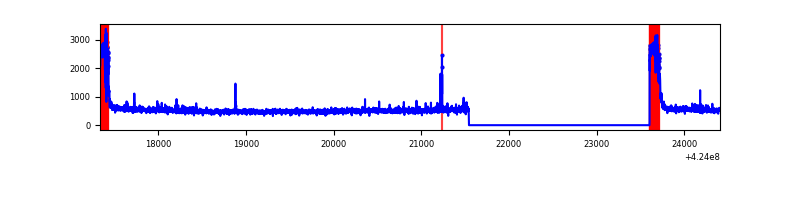 |
| D | 7072 | 5011 | 2489 | 2489 | 35.20% | 49.67% | 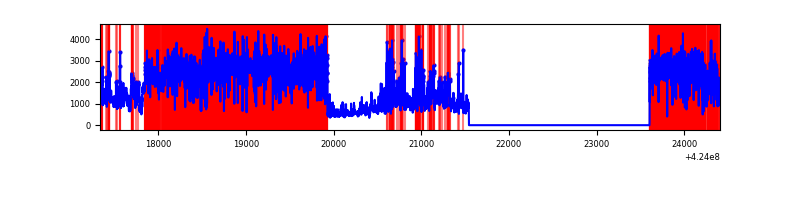 |
Top three noisy pixels from each quadrant. If the there are fewer than three noisy pixels in the level2.evt file, extra rows are filled as -1
| Pixel properties | Quadrant properties | ||||||
|---|---|---|---|---|---|---|---|
| Quadrant | DetID | PixID | Counts | Sigma | Mean | Median | Sigma |
| A | 10 | 83 | 522388 | 4271.47 | 606 | 599 | 122.2 |
| A | 13 | 248 | 14293 | 112.1 | 606 | 599 | 122.2 |
| A | 13 | 6 | 9459 | 72.53 | 606 | 599 | 122.2 |
| B | 0 | 186 | 423642 | 3755.38 | 600 | 586 | 112.7 |
| B | 5 | 255 | 158506 | 1401.82 | 600 | 586 | 112.7 |
| B | 0 | 245 | 41963 | 367.29 | 600 | 586 | 112.7 |
| C | 0 | 10 | 530694 | 4062.0 | 566 | 571 | 130.5 |
| C | 15 | 214 | 215716 | 1648.52 | 566 | 571 | 130.5 |
| C | 0 | 15 | 56805 | 430.89 | 566 | 571 | 130.5 |
| D | 12 | 79 | 6965913 | 62766.18 | 452 | 439 | 111.0 |
| D | 2 | 120 | 313427 | 2820.35 | 452 | 439 | 111.0 |
| D | 13 | 249 | 265961 | 2392.63 | 452 | 439 | 111.0 |
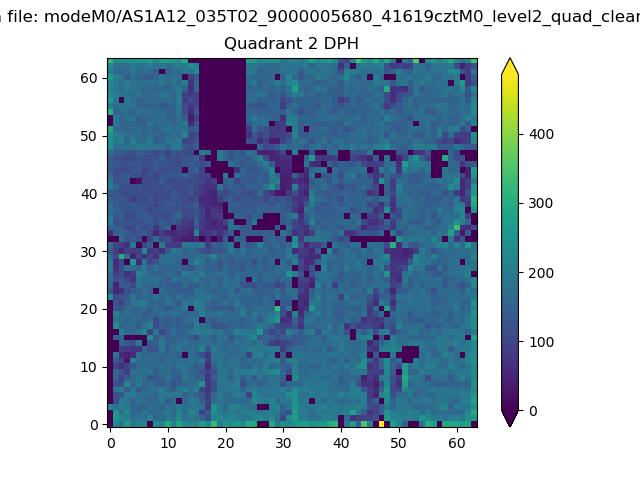
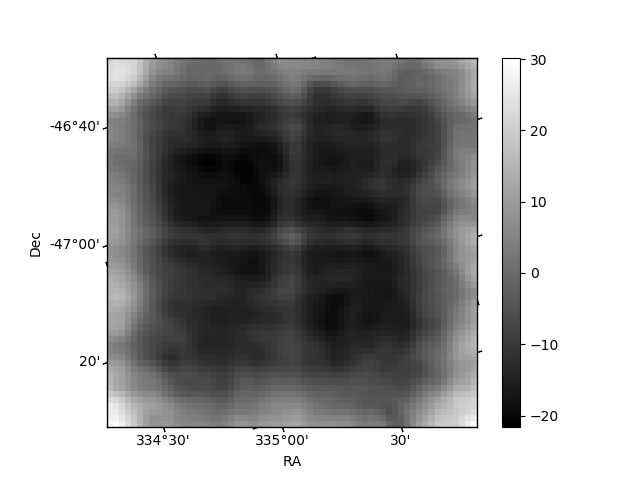
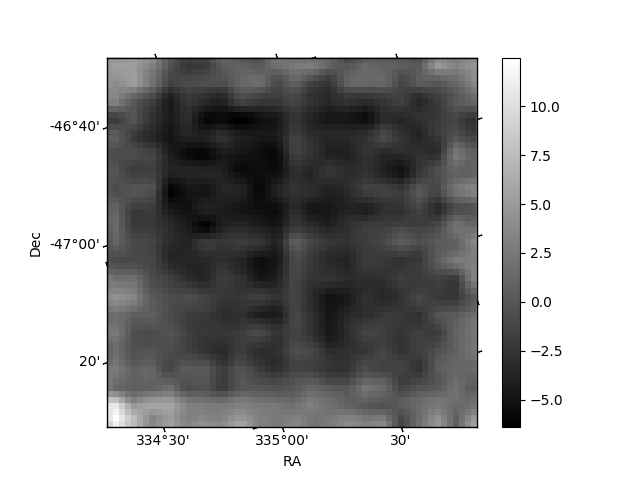
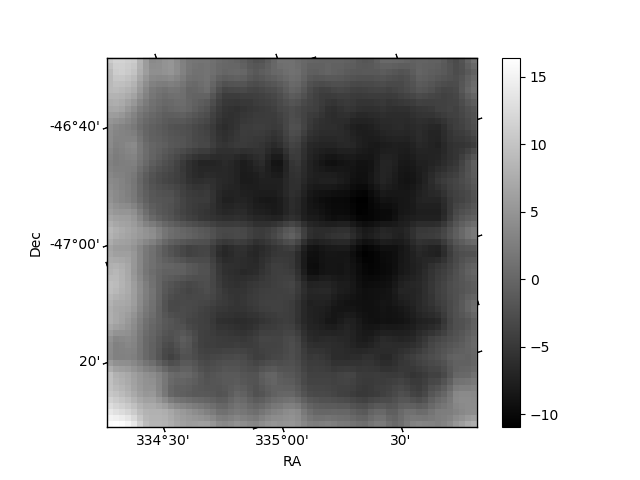
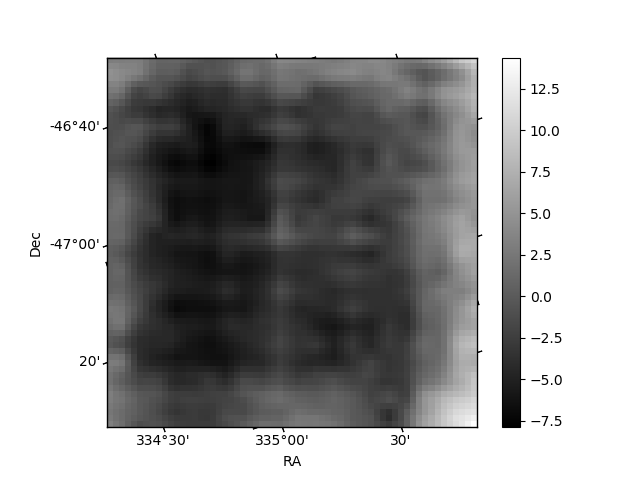
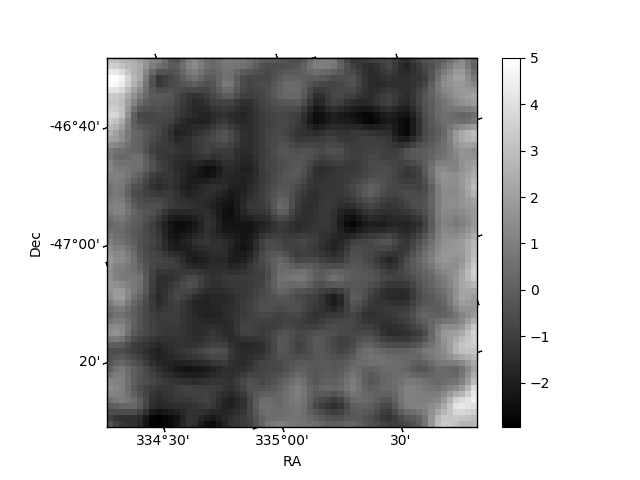
Histogram calculated using DETX and DETY for each event in the final _common_clean file
| Quadrant A | 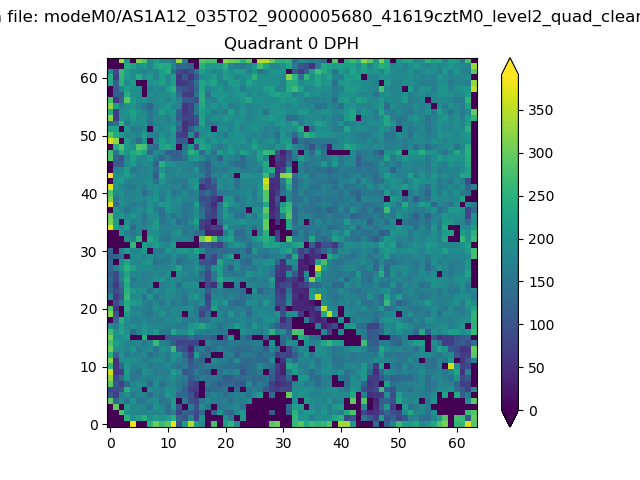 |
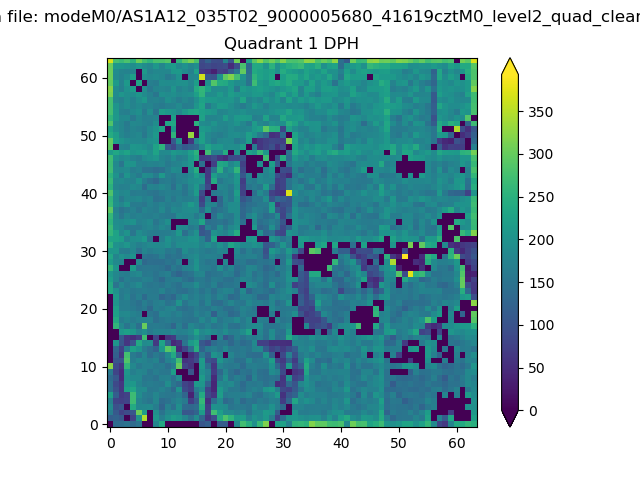 |
Quadrant B |
|---|---|---|---|
| Quadrant D | 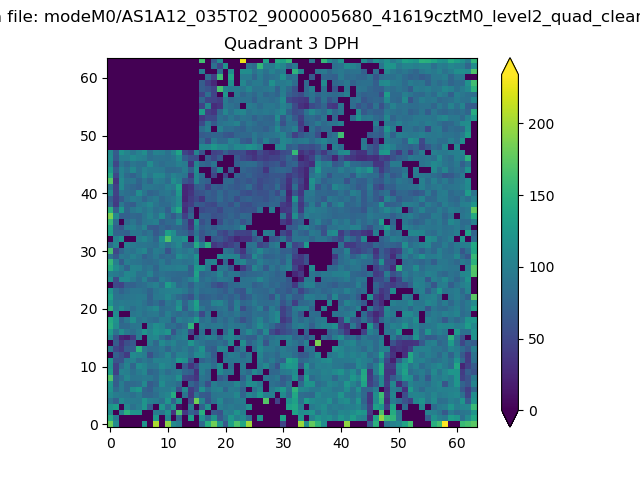 |
 |
Quadrant C |
| Plot type | Count rate plots | Images |
|---|---|---|
| Comparison with Poisson distribution Blue bars denote a histogram of data divided into 1 sec bins. Red curve is a Poisson curve with rate = median count rate of data. |
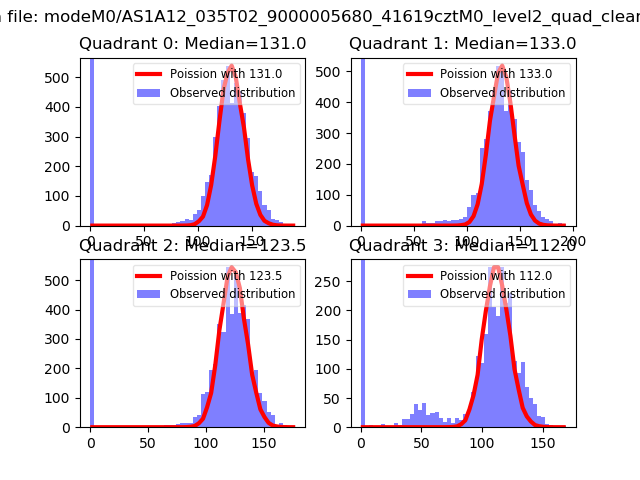 |
 |
| Quadrant-wise count rates Data is divided into 100 sec bins |
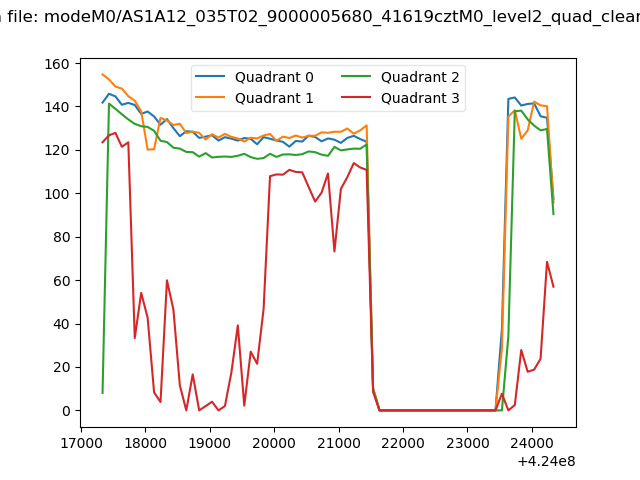 |
|
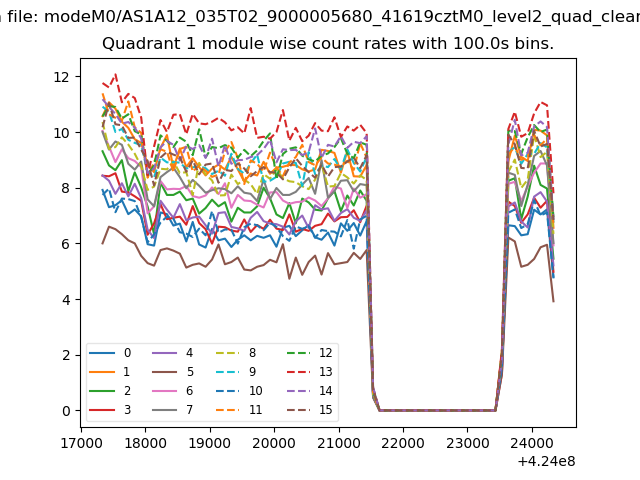
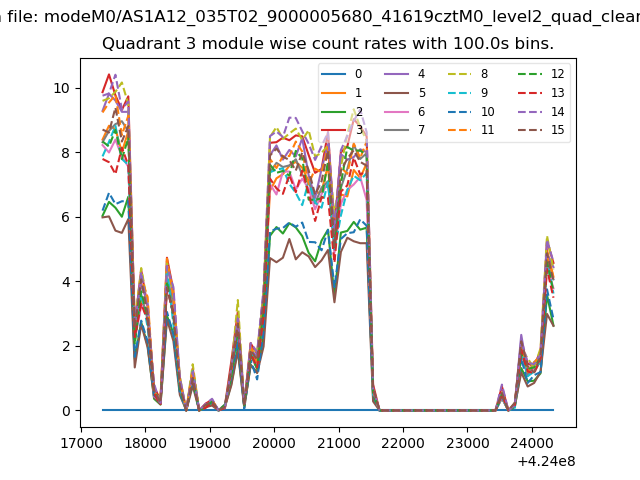
| Module-wise count rates for Quadrant A Data is divided into 100 sec bins |
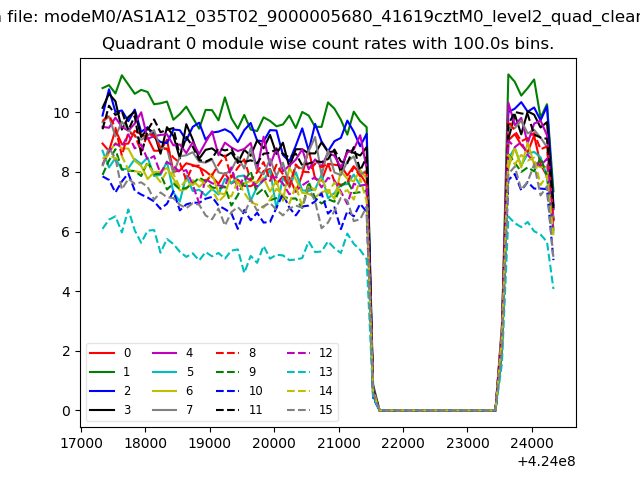 |
 |
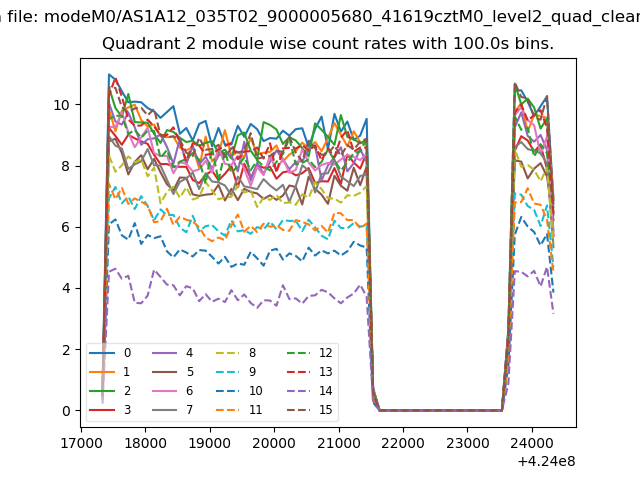
| Module-wise count rates for Quadrant B Data is divided into 100 sec bins |
 |
 |
| Module-wise count rates for Quadrant C Data is divided into 100 sec bins |
 |
 |
| Module-wise count rates for Quadrant D Data is divided into 100 sec bins |
 |
 |
| Parameter | Plot |
|---|---|
| CZT HV Monitor | 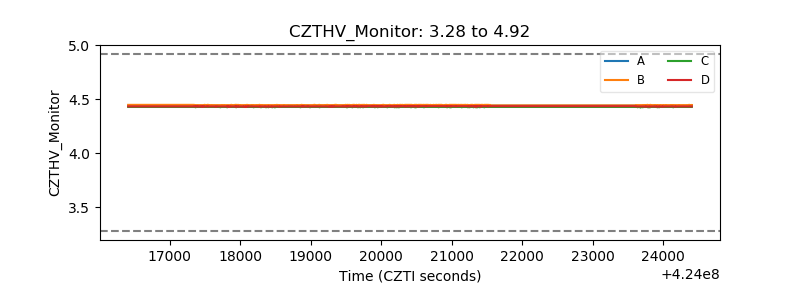 |
| D_VDD | 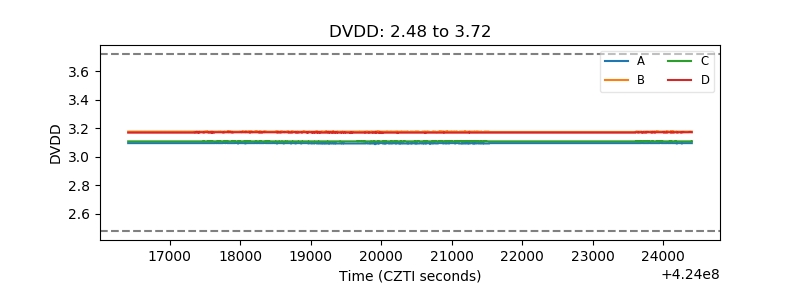 |
| Temperature 1 | 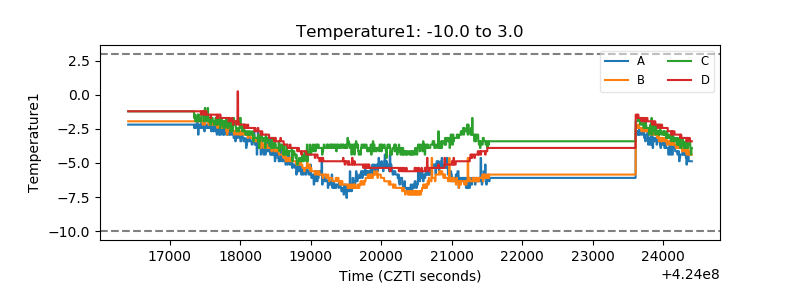 |
| Veto HV Monitor | 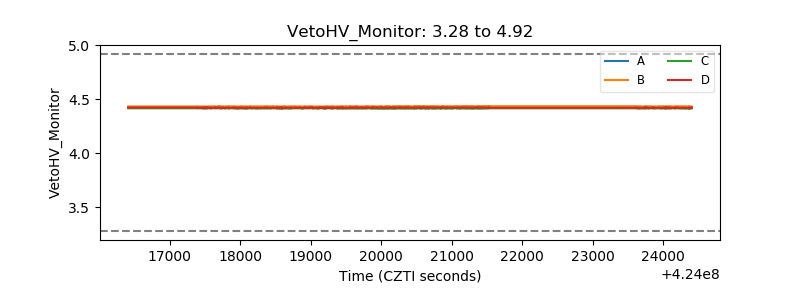 |
| Veto LLD | 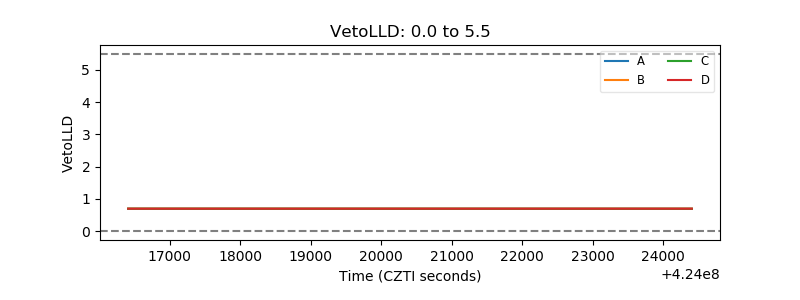 |
| Alpha Counter | 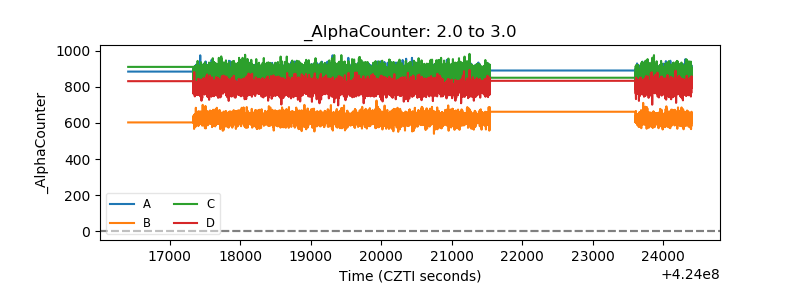 |
| _CPM_Rate | 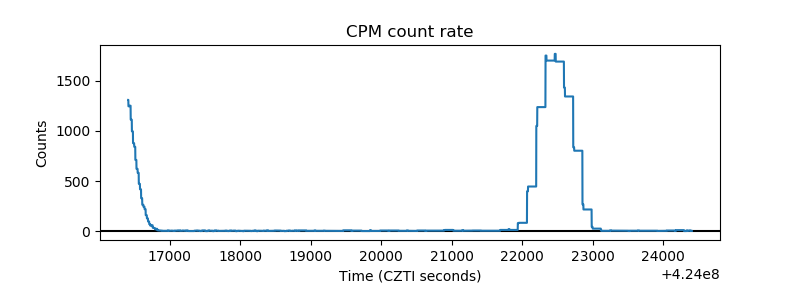 |
| CZT Counter | 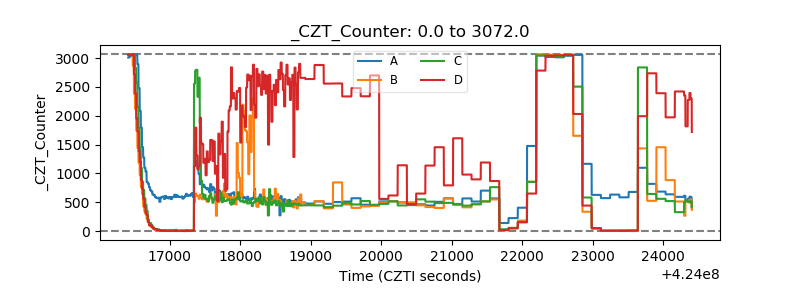 |
| +2.5 Volts monitor | 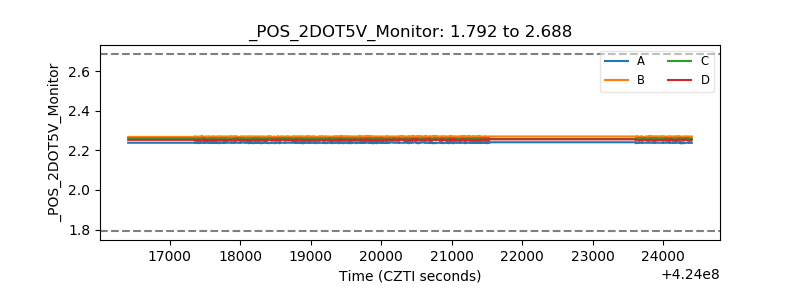 |
| +5 Volts monitor |  |
| _ROLL_ROT | 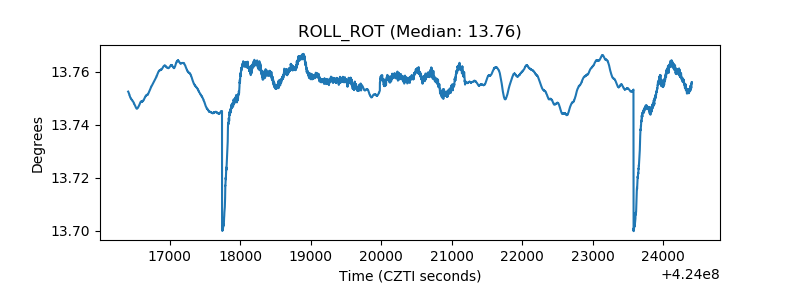 |
| _Roll_DEC | 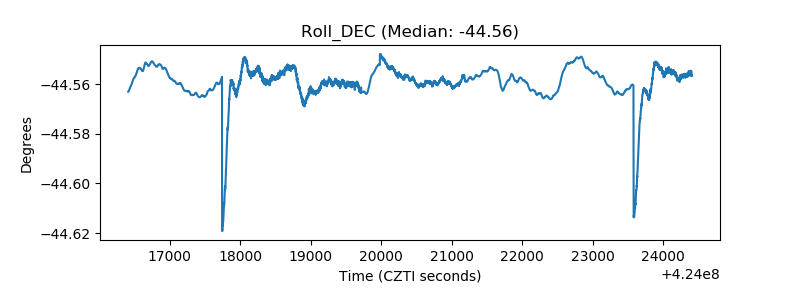 |
| _Roll_RA | 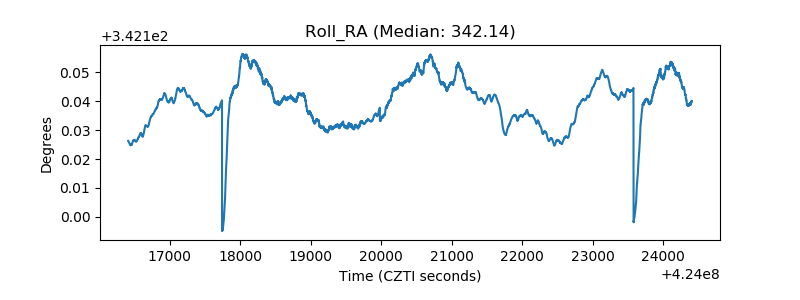 |
| Veto Counter | 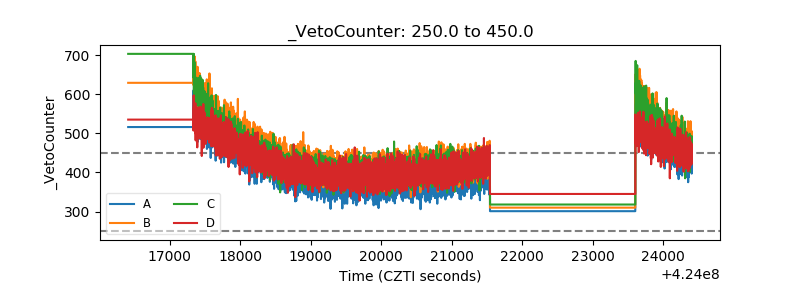 |