| Param | Original file | Final file |
|---|---|---|
| Filename | modeM0/AS1A12_035T02_9000005680_41620cztM0_level2.fits | modeM0/AS1A12_035T02_9000005680_41620cztM0_level2_quad_clean.evt |
| Size (bytes) | 490,089,600 | 80,962,560 |
| Size | 467.4 MB | 77.2 MB |
| Events in quadrant A | 2,861,018 | 623,935 |
| Events in quadrant B | 2,640,246 | 630,058 |
| Events in quadrant C | 3,088,599 | 566,622 |
| Events in quadrant D | 9,173,299 | 289,106 |
| Mode SS | |||
|---|---|---|---|
| Quadrant | BADHDUFLAG | Total packets | Discarded packets |
| A | 0 | 102 | 0 |
| B | 0 | 102 | 0 |
| C | 0 | 102 | 0 |
| D | 0 | 102 | 0 |
| Mode M0 | |||
|---|---|---|---|
| Quadrant | BADHDUFLAG | Total packets | Discarded packets |
| A | 0 | 11379 | 2 |
| B | 0 | 10925 | 2 |
| C | 0 | 11915 | 2 |
| D | 0 | 30596 | 2 |
| Mode M9 | |||
|---|---|---|---|
| Quadrant | BADHDUFLAG | Total packets | Discarded packets |
| A | 0 | 27 | 0 |
| B | 0 | 28 | 0 |
| C | 0 | 28 | 0 |
| D | 0 | 28 | 0 |
| Quadrant | Total seconds | Saturated seconds | Saturation percentage |
|---|---|---|---|
| A | 4864 | 47 | 0.966283% |
| B | 4864 | 124 | 2.549342% |
| C | 4864 | 230 | 4.728618% |
| D | 4864 | 2575 | 52.939967% |
Noise dominated data is calculated using 1-second bins in cleaned event files. If a bin has >2000 counts, and if more than 50% of those come from <1% of pixels, then it is considered to be noise-dominated and hence unusable.
| Quadrant | # 1 sec bins | Bins with >0 counts | Bins with >2000 counts | High rate bins dominated by noise | Noise dominated (total time) | Noise dominated (detector-on time) | Marked lightcurve |
|---|---|---|---|---|---|---|---|
| A | 7015 | 4865 | 22 | 22 | 0.31% | 0.45% | 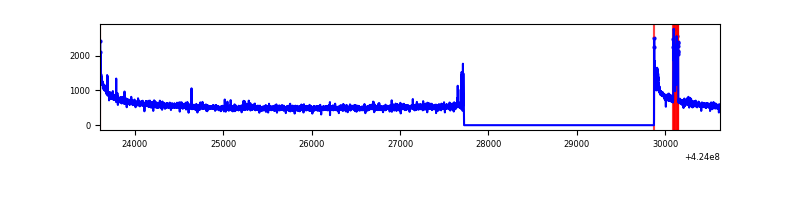 |
| B | 7015 | 4865 | 65 | 65 | 0.93% | 1.34% | 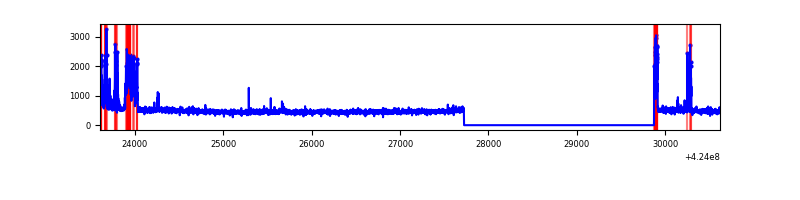 |
| C | 7015 | 4865 | 209 | 209 | 2.98% | 4.30% | 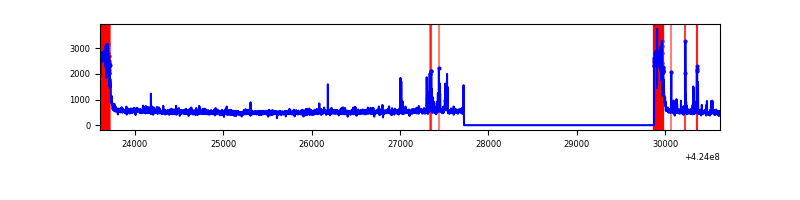 |
| D | 7015 | 4865 | 2416 | 2416 | 34.44% | 49.66% | 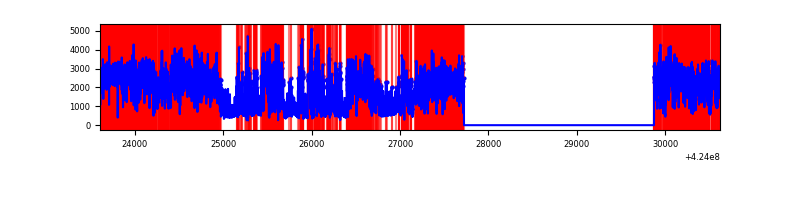 |
Top three noisy pixels from each quadrant. If the there are fewer than three noisy pixels in the level2.evt file, extra rows are filled as -1
| Pixel properties | Quadrant properties | ||||||
|---|---|---|---|---|---|---|---|
| Quadrant | DetID | PixID | Counts | Sigma | Mean | Median | Sigma |
| A | 10 | 83 | 501627 | 4280.63 | 578 | 569 | 117.1 |
| A | 15 | 254 | 68620 | 581.37 | 578 | 569 | 117.1 |
| A | 15 | 223 | 26811 | 224.19 | 578 | 569 | 117.1 |
| B | 0 | 186 | 316558 | 2936.42 | 575 | 563 | 107.6 |
| B | 5 | 255 | 40503 | 371.15 | 575 | 563 | 107.6 |
| B | 0 | 189 | 18222 | 164.1 | 575 | 563 | 107.6 |
| C | 0 | 10 | 553960 | 4422.84 | 543 | 547 | 125.1 |
| C | 15 | 214 | 210531 | 1678.18 | 543 | 547 | 125.1 |
| C | 4 | 254 | 101082 | 803.47 | 543 | 547 | 125.1 |
| D | 12 | 79 | 5460111 | 50239.14 | 440 | 428 | 108.7 |
| D | 13 | 249 | 976410 | 8980.83 | 440 | 428 | 108.7 |
| D | 2 | 120 | 425659 | 3912.91 | 440 | 428 | 108.7 |
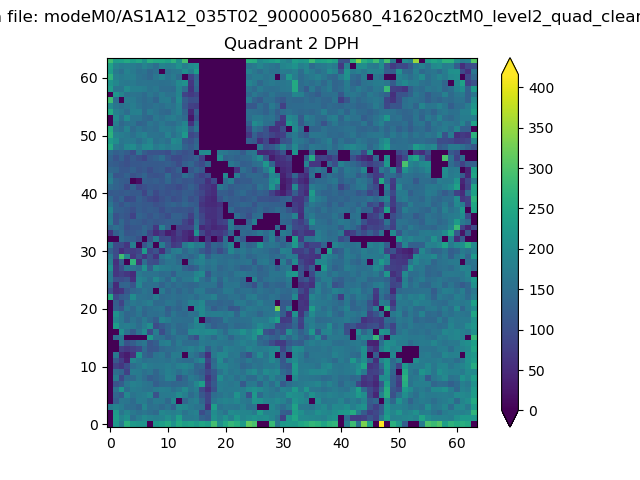
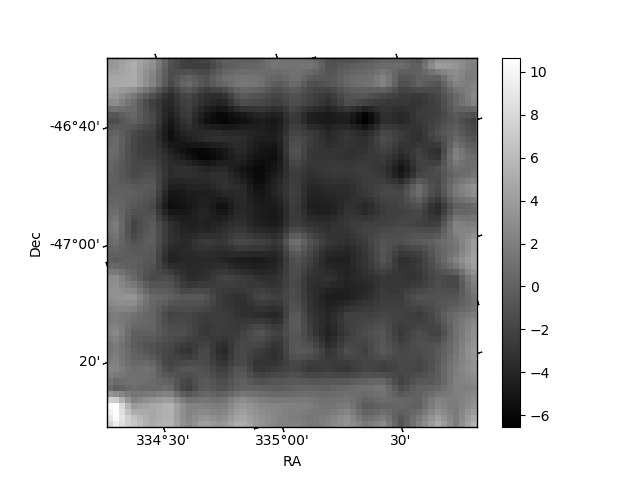
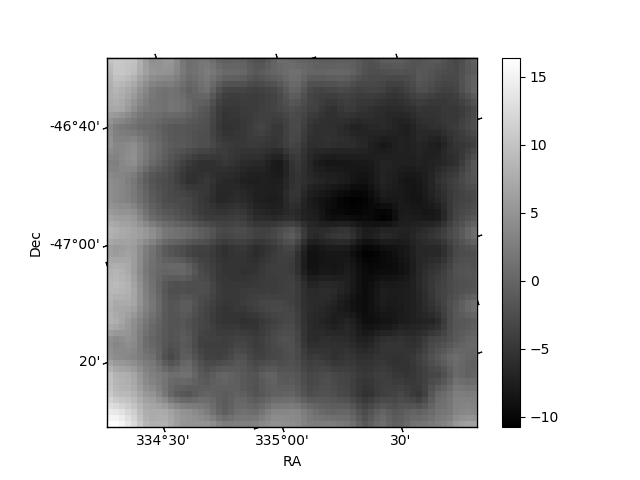
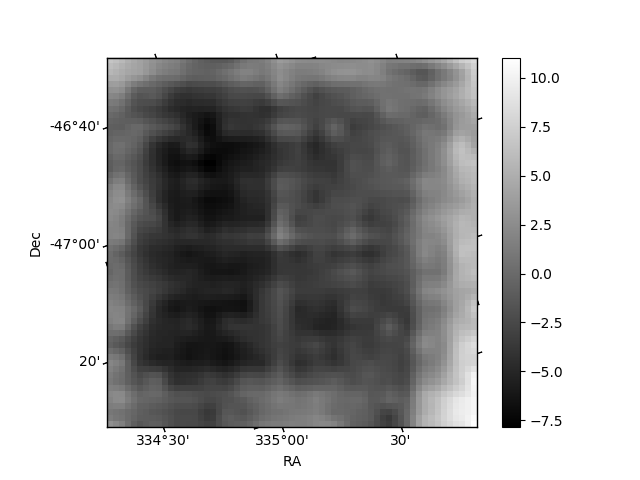
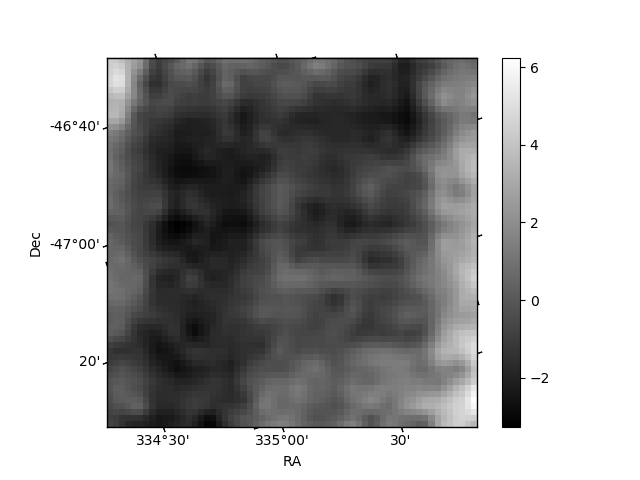
Histogram calculated using DETX and DETY for each event in the final _common_clean file
| Quadrant A | 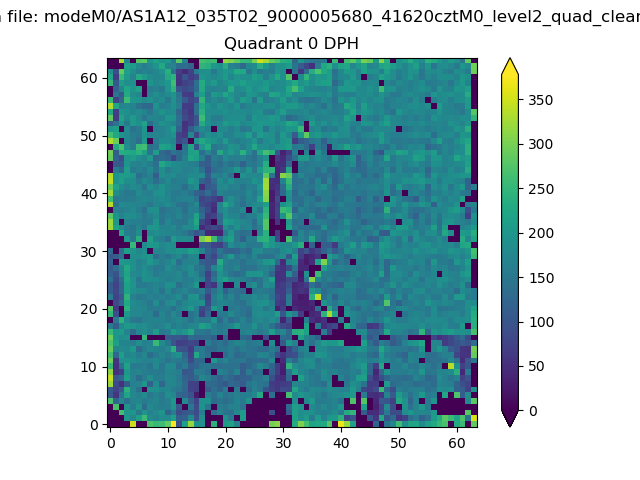 |
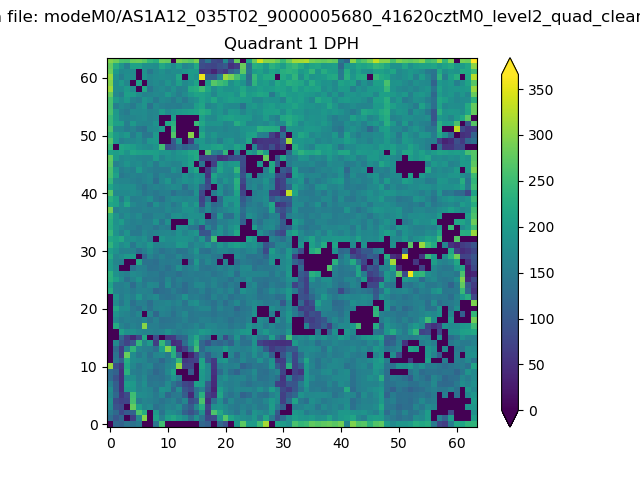 |
Quadrant B |
|---|---|---|---|
| Quadrant D | 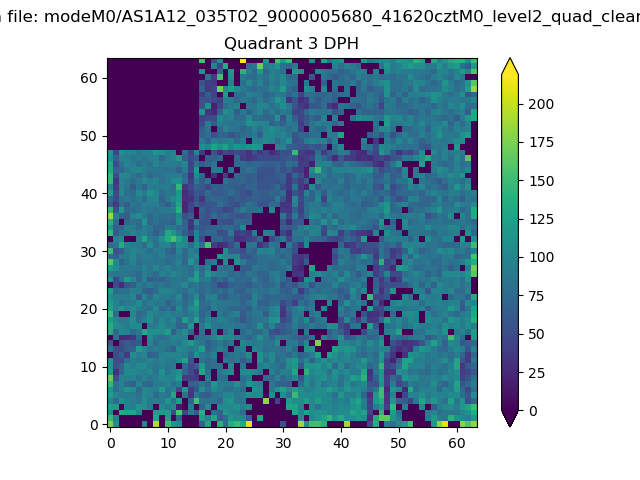 |
 |
Quadrant C |
| Plot type | Count rate plots | Images |
|---|---|---|
| Comparison with Poisson distribution Blue bars denote a histogram of data divided into 1 sec bins. Red curve is a Poisson curve with rate = median count rate of data. |
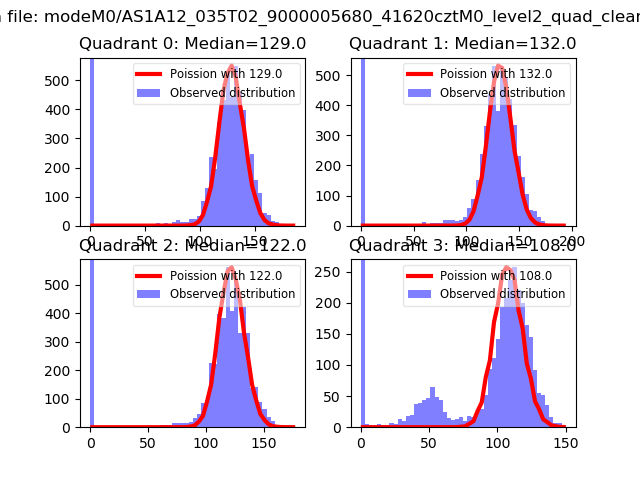 |
 |
| Quadrant-wise count rates Data is divided into 100 sec bins |
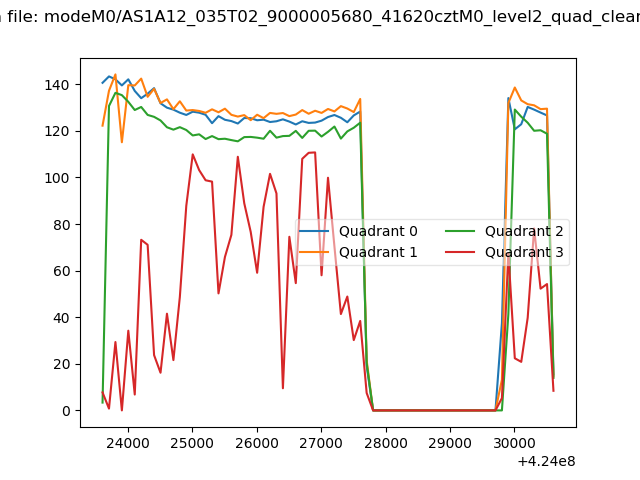 |
|
| Module-wise count rates for Quadrant A Data is divided into 100 sec bins |
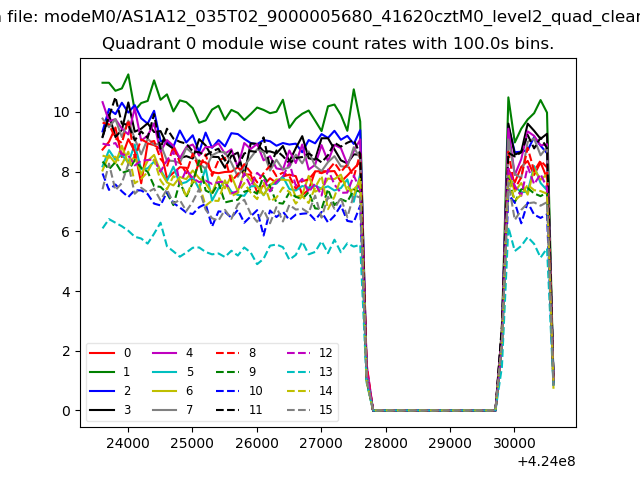 |
 |
| Module-wise count rates for Quadrant B Data is divided into 100 sec bins |
 |
 |
| Module-wise count rates for Quadrant C Data is divided into 100 sec bins |
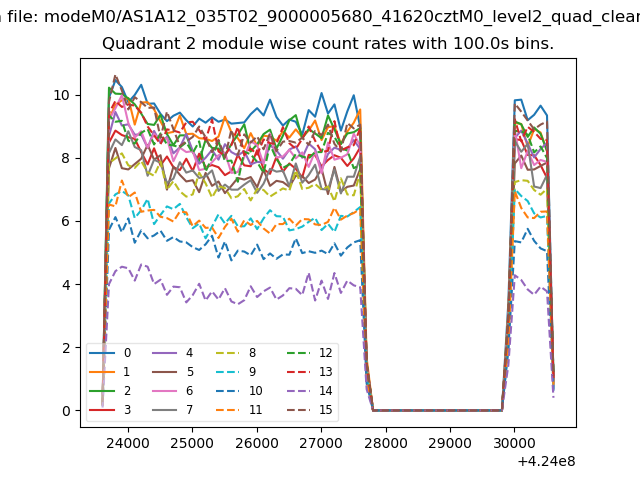 |
 |
| Module-wise count rates for Quadrant D Data is divided into 100 sec bins |
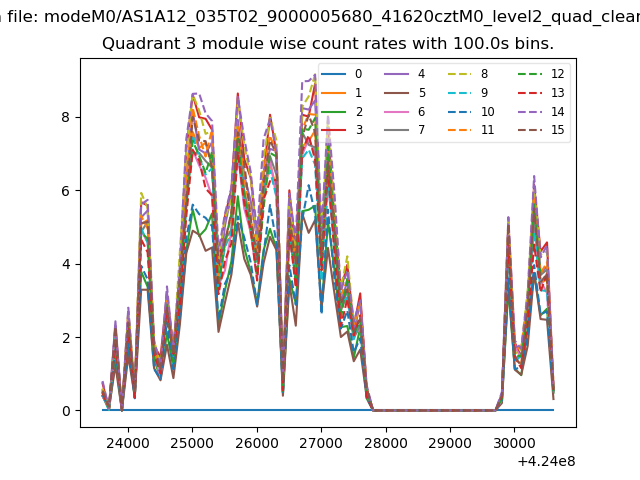 |
 |
| Parameter | Plot |
|---|---|
| CZT HV Monitor | 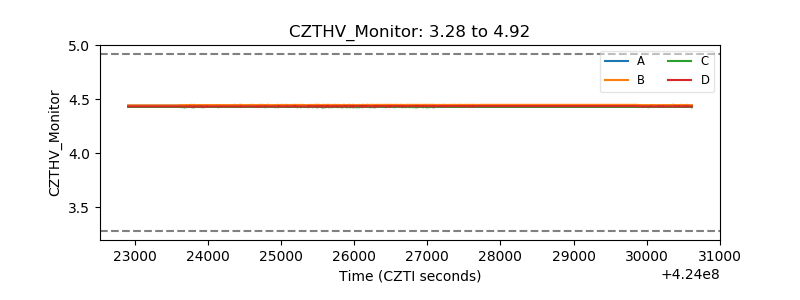 |
| D_VDD | 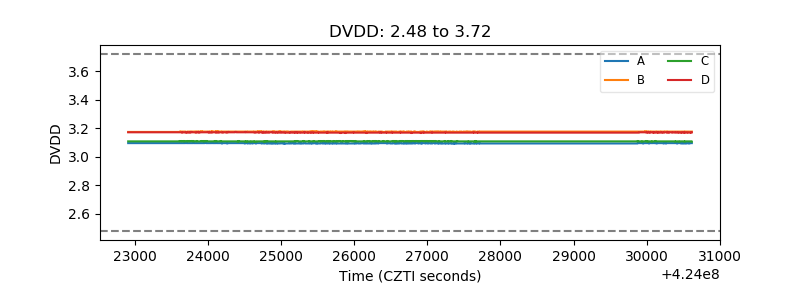 |
| Temperature 1 | 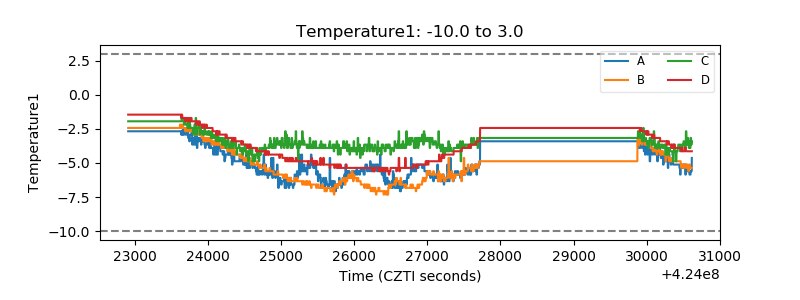 |
| Veto HV Monitor | 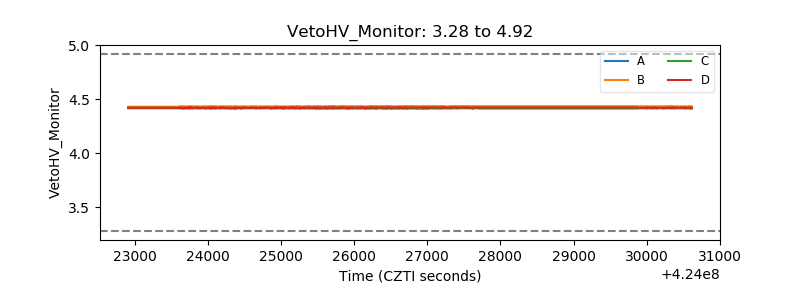 |
| Veto LLD | 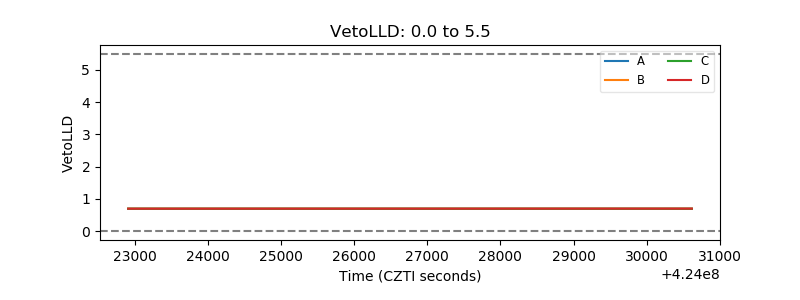 |
| Alpha Counter | 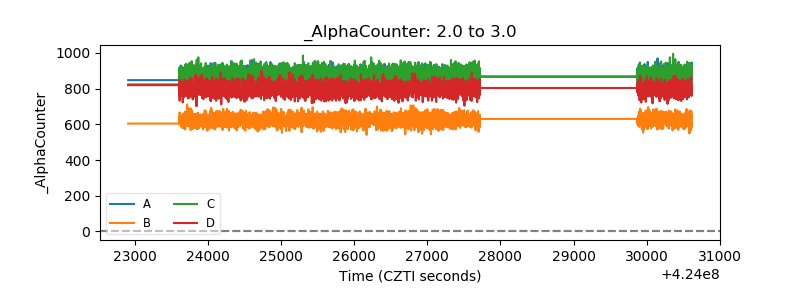 |
| _CPM_Rate | 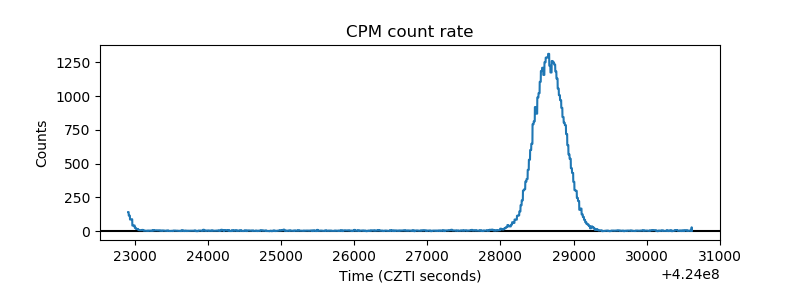 |
| CZT Counter | 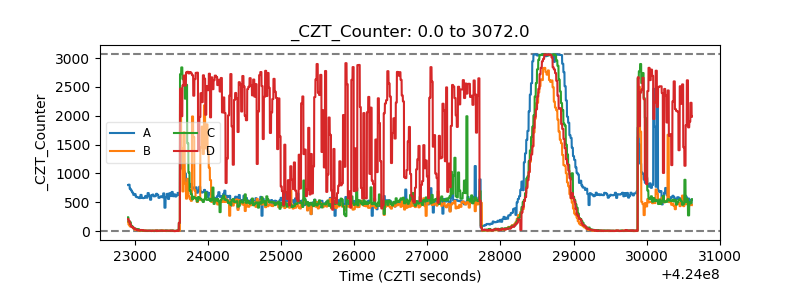 |
| +2.5 Volts monitor | 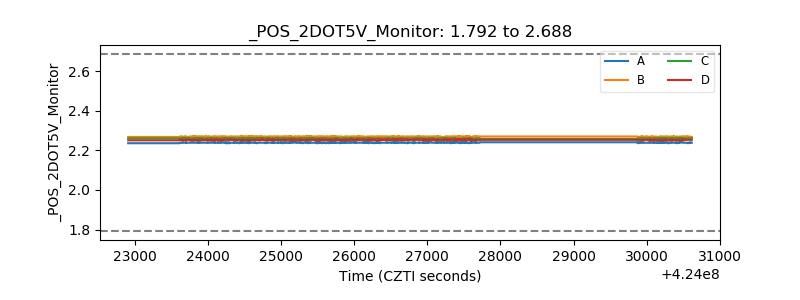 |
| +5 Volts monitor | 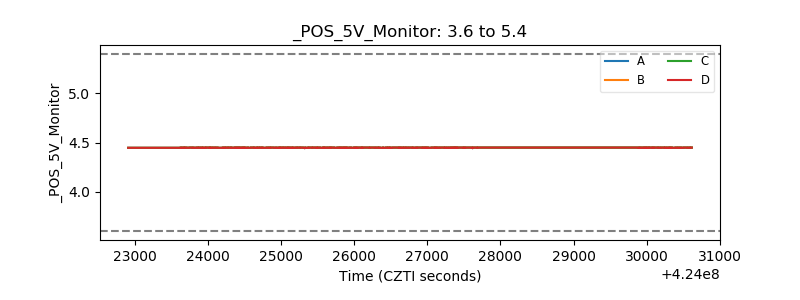 |
| _ROLL_ROT | 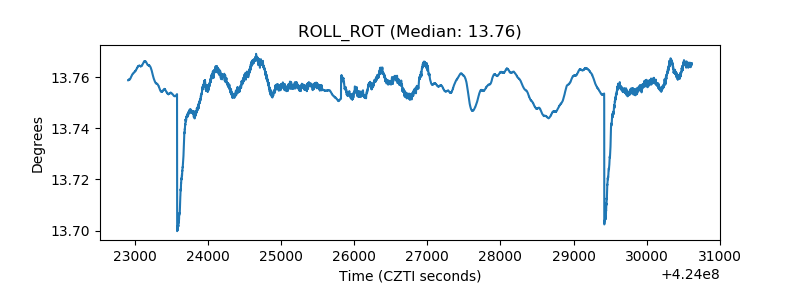 |
| _Roll_DEC |  |
| _Roll_RA | 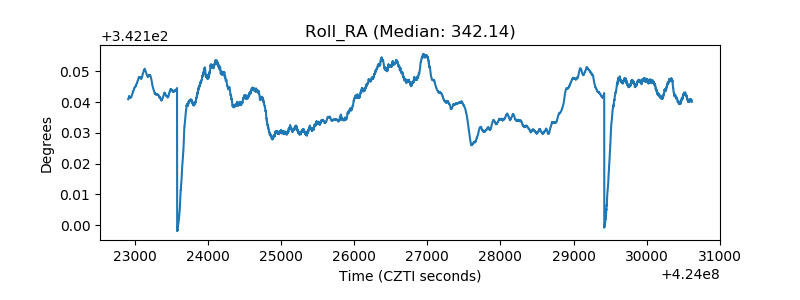 |
| Veto Counter | 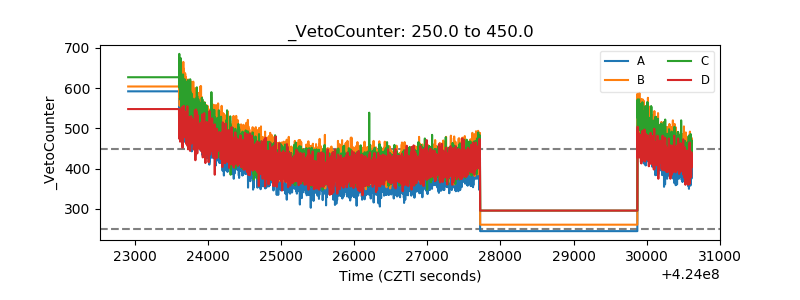 |