| Param | Original file | Final file |
|---|---|---|
| Filename | modeM0/AS1A12_035T02_9000005680_41622cztM0_level2.fits | modeM0/AS1A12_035T02_9000005680_41622cztM0_level2_quad_clean.evt |
| Size (bytes) | 487,284,480 | 78,744,960 |
| Size | 464.7 MB | 75.1 MB |
| Events in quadrant A | 2,727,744 | 593,804 |
| Events in quadrant B | 2,515,875 | 601,734 |
| Events in quadrant C | 2,904,680 | 545,568 |
| Events in quadrant D | 9,491,706 | 284,805 |
| Mode SS | |||
|---|---|---|---|
| Quadrant | BADHDUFLAG | Total packets | Discarded packets |
| A | 0 | 108 | 0 |
| B | 0 | 108 | 0 |
| C | 0 | 108 | 0 |
| D | 0 | 108 | 0 |
| Mode M0 | |||
|---|---|---|---|
| Quadrant | BADHDUFLAG | Total packets | Discarded packets |
| A | 0 | 11143 | 2 |
| B | 0 | 11032 | 2 |
| C | 0 | 11757 | 2 |
| D | 0 | 31690 | 4 |
| Mode M9 | |||
|---|---|---|---|
| Quadrant | BADHDUFLAG | Total packets | Discarded packets |
| A | 0 | 39 | 0 |
| B | 0 | 40 | 0 |
| C | 0 | 40 | 0 |
| D | 0 | 40 | 0 |
| Quadrant | Total seconds | Saturated seconds | Saturation percentage |
|---|---|---|---|
| A | 5109 | 12 | 0.234880% |
| B | 5109 | 37 | 0.724212% |
| C | 5109 | 209 | 4.090820% |
| D | 5108 | 2612 | 51.135474% |
Noise dominated data is calculated using 1-second bins in cleaned event files. If a bin has >2000 counts, and if more than 50% of those come from <1% of pixels, then it is considered to be noise-dominated and hence unusable.
| Quadrant | # 1 sec bins | Bins with >0 counts | Bins with >2000 counts | High rate bins dominated by noise | Noise dominated (total time) | Noise dominated (detector-on time) | Marked lightcurve |
|---|---|---|---|---|---|---|---|
| A | 7082 | 5110 | 3 | 3 | 0.04% | 0.06% | 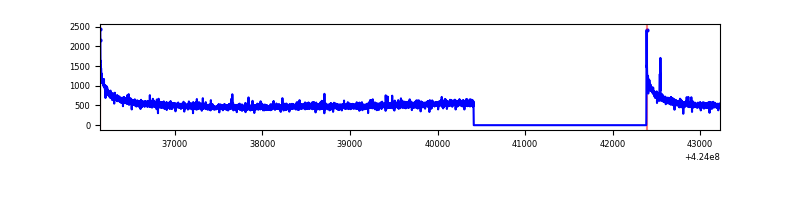 |
| B | 7082 | 5110 | 15 | 15 | 0.21% | 0.29% | 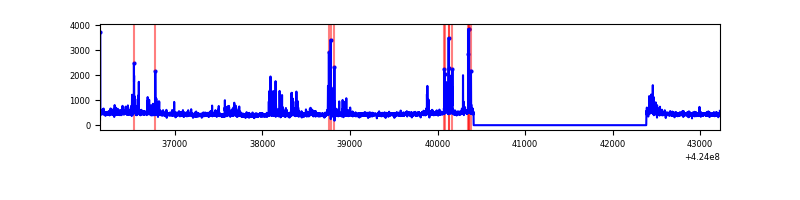 |
| C | 7082 | 5110 | 207 | 207 | 2.92% | 4.05% | 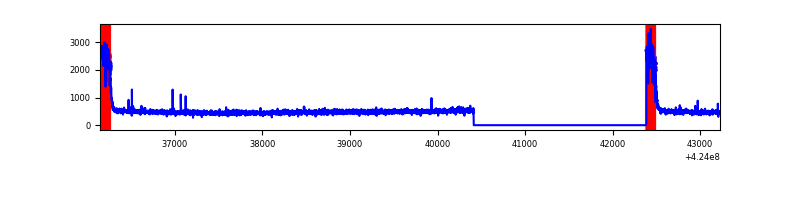 |
| D | 7080 | 5107 | 2373 | 2373 | 33.52% | 46.47% | 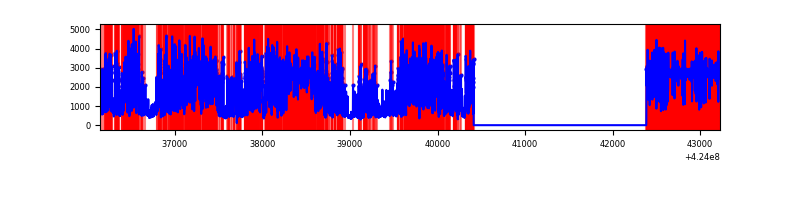 |
Top three noisy pixels from each quadrant. If the there are fewer than three noisy pixels in the level2.evt file, extra rows are filled as -1
| Pixel properties | Quadrant properties | ||||||
|---|---|---|---|---|---|---|---|
| Quadrant | DetID | PixID | Counts | Sigma | Mean | Median | Sigma |
| A | 10 | 83 | 505466 | 4379.73 | 566 | 555 | 115.3 |
| A | 2 | 79 | 9204 | 75.02 | 566 | 555 | 115.3 |
| A | 13 | 254 | 8906 | 72.44 | 566 | 555 | 115.3 |
| B | 5 | 255 | 290296 | 2661.28 | 561 | 543 | 108.9 |
| B | 12 | 111 | 13648 | 120.36 | 561 | 543 | 108.9 |
| B | 11 | 111 | 12541 | 110.19 | 561 | 543 | 108.9 |
| C | 0 | 10 | 533819 | 4218.96 | 542 | 545 | 126.4 |
| C | 15 | 214 | 222252 | 1754.02 | 542 | 545 | 126.4 |
| C | 0 | 15 | 29723 | 230.84 | 542 | 545 | 126.4 |
| D | 12 | 79 | 5903760 | 56723.3 | 419 | 405 | 104.1 |
| D | 13 | 249 | 1076943 | 10344.08 | 419 | 405 | 104.1 |
| D | 2 | 120 | 345596 | 3316.82 | 419 | 405 | 104.1 |
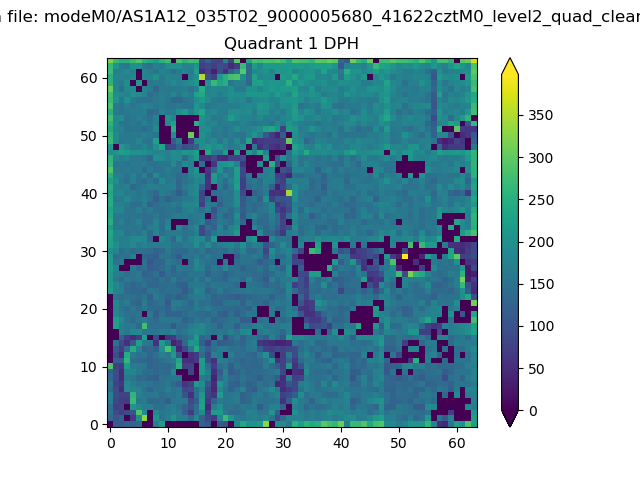
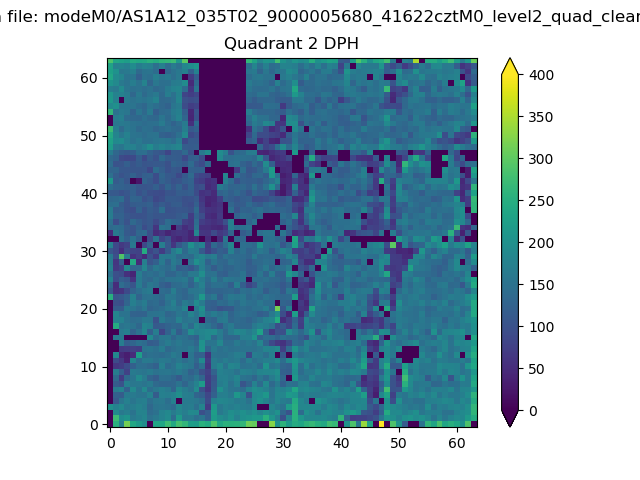
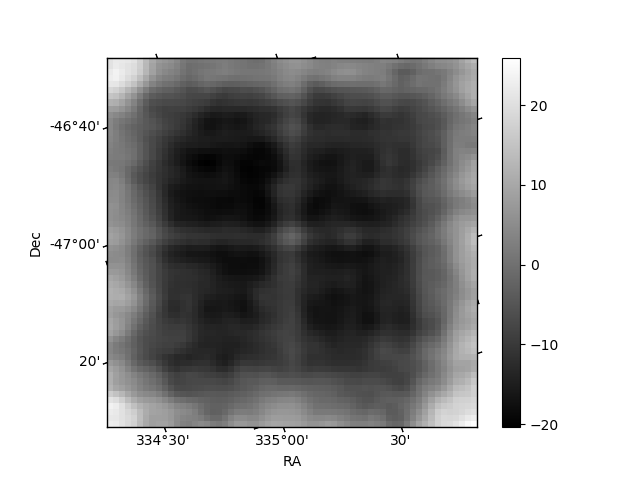
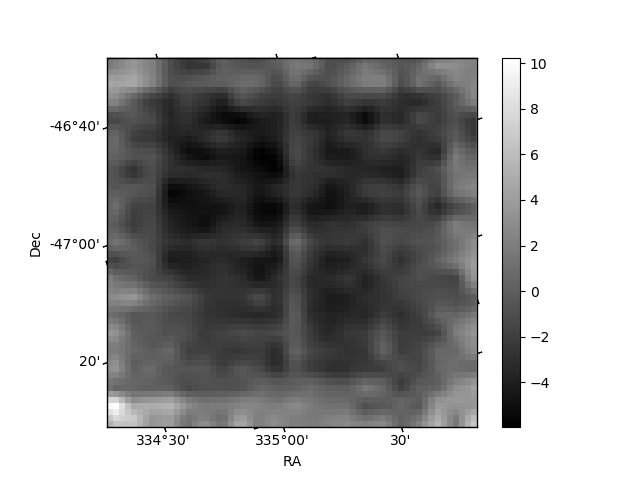
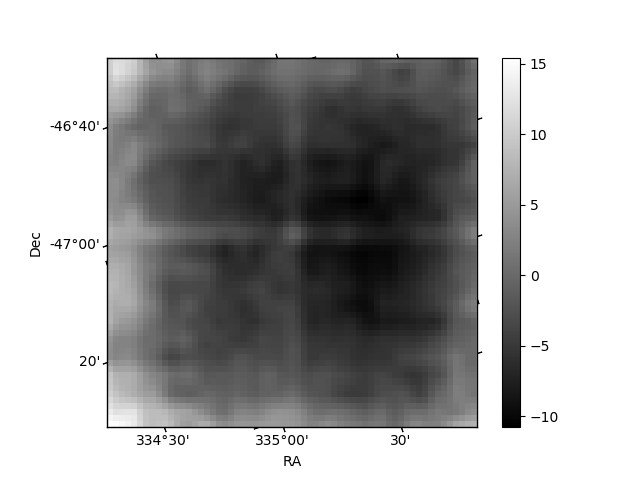
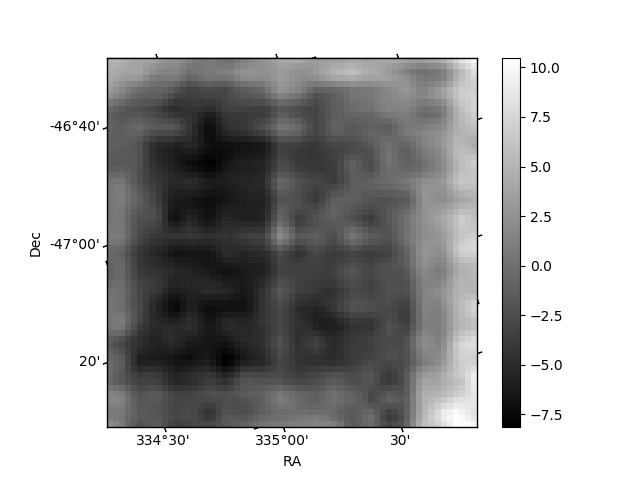
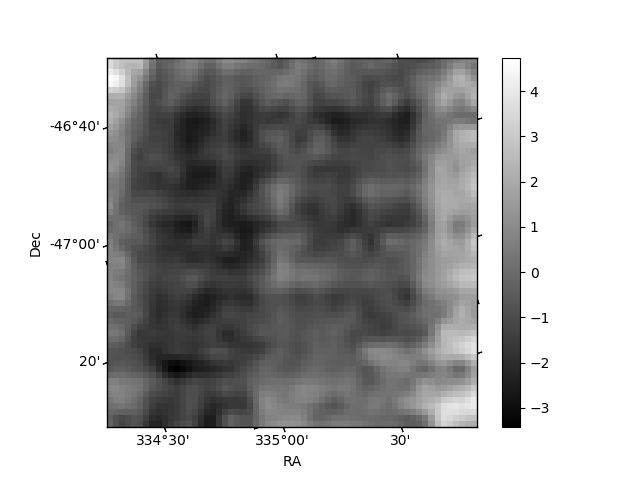
Histogram calculated using DETX and DETY for each event in the final _common_clean file
| Quadrant A |  |
 |
Quadrant B |
|---|---|---|---|
| Quadrant D | 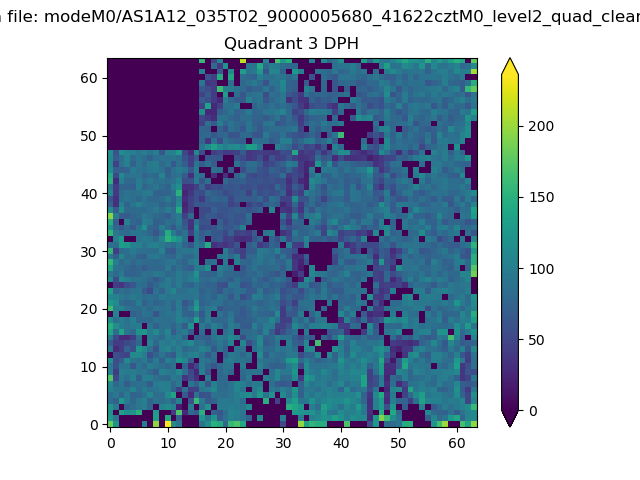 |
 |
Quadrant C |
| Plot type | Count rate plots | Images |
|---|---|---|
| Comparison with Poisson distribution Blue bars denote a histogram of data divided into 1 sec bins. Red curve is a Poisson curve with rate = median count rate of data. |
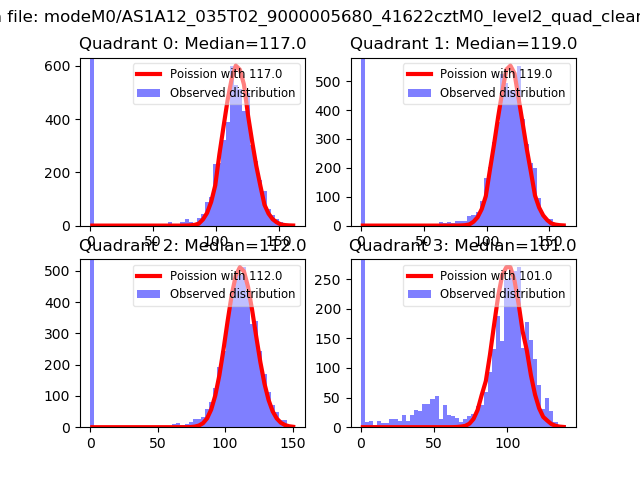 |
 |
| Quadrant-wise count rates Data is divided into 100 sec bins |
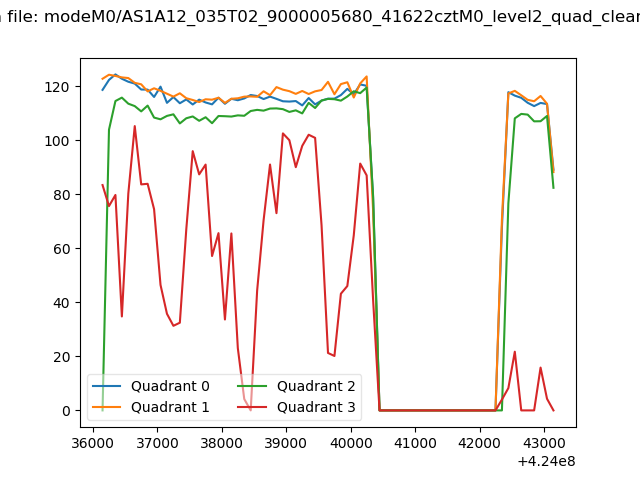 |
|
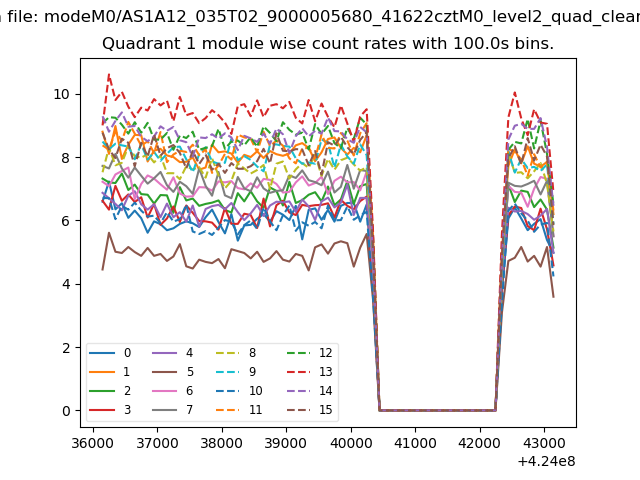
| Module-wise count rates for Quadrant A Data is divided into 100 sec bins |
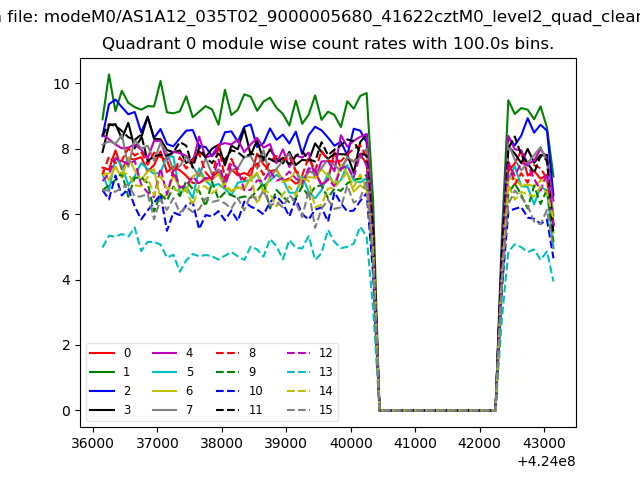 |
 |
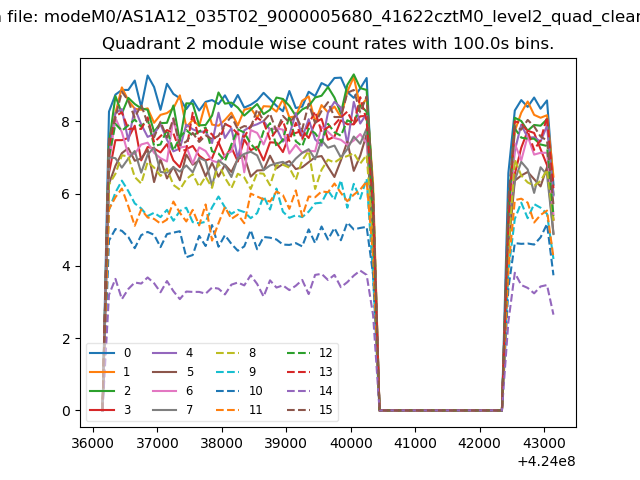
| Module-wise count rates for Quadrant B Data is divided into 100 sec bins |
 |
 |
| Module-wise count rates for Quadrant C Data is divided into 100 sec bins |
 |
 |
| Module-wise count rates for Quadrant D Data is divided into 100 sec bins |
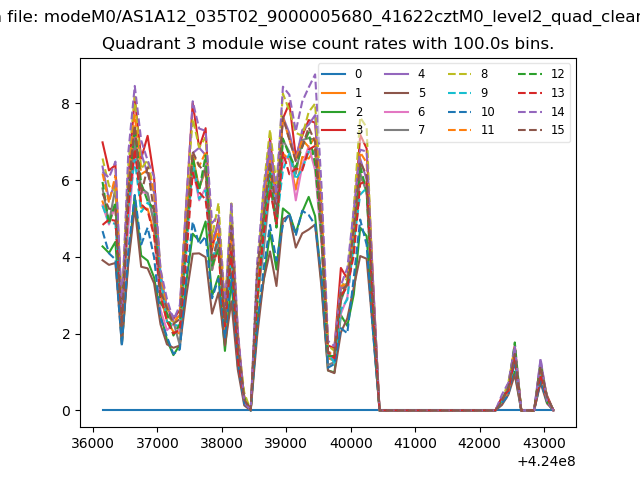 |
 |
| Parameter | Plot |
|---|---|
| CZT HV Monitor | 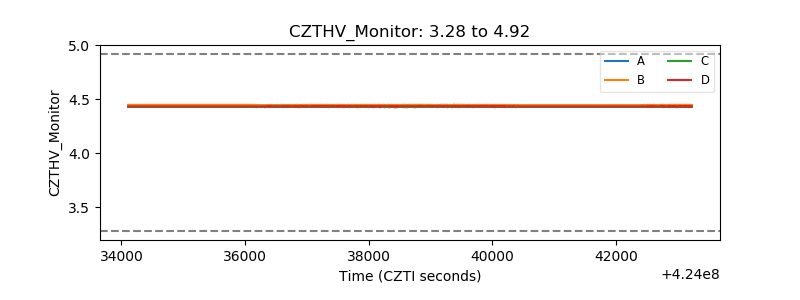 |
| D_VDD | 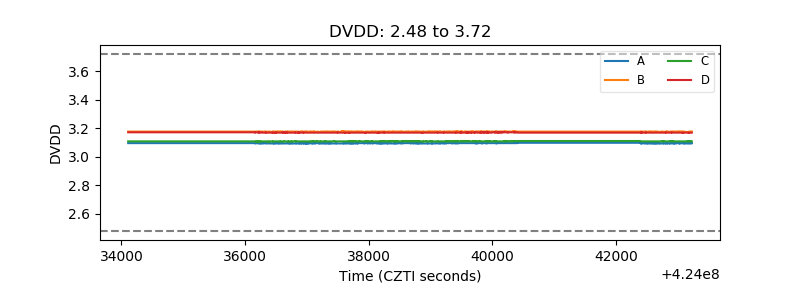 |
| Temperature 1 | 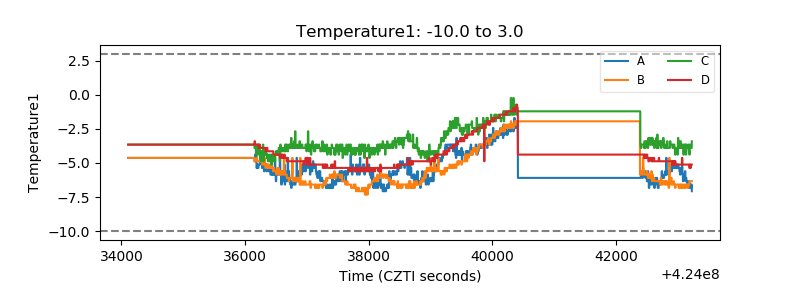 |
| Veto HV Monitor | 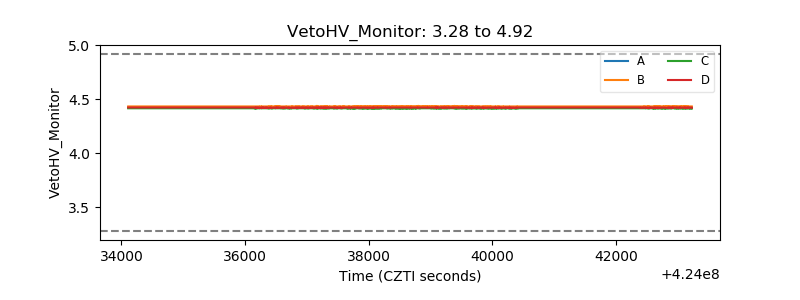 |
| Veto LLD | 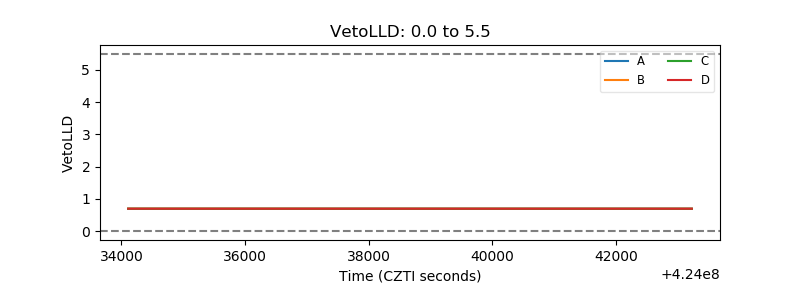 |
| Alpha Counter | 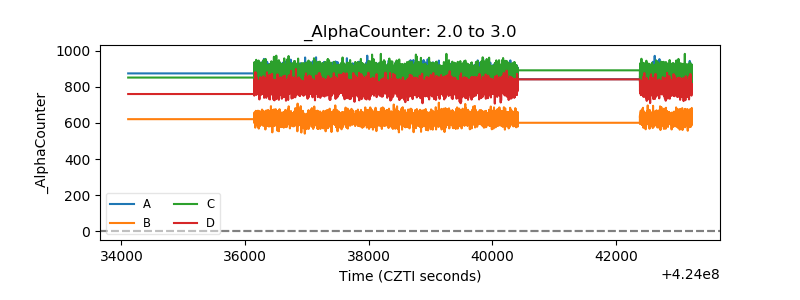 |
| _CPM_Rate | 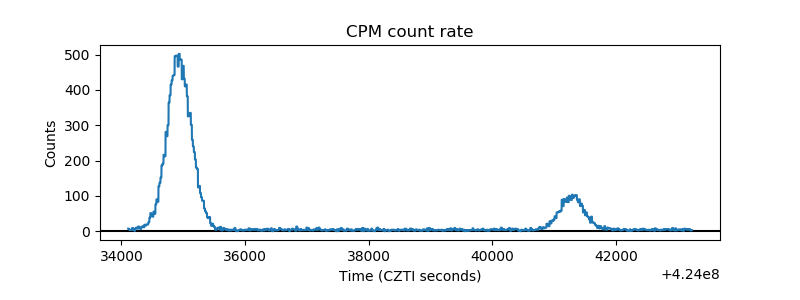 |
| CZT Counter | 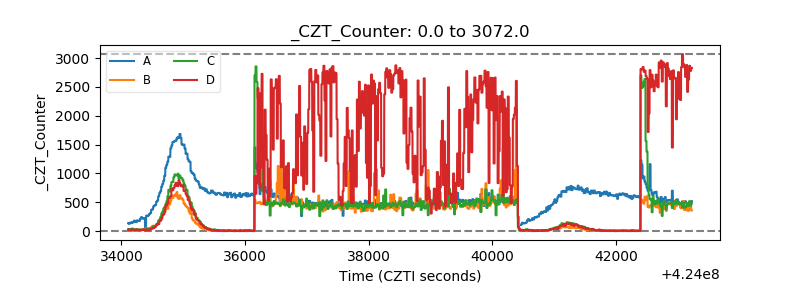 |
| +2.5 Volts monitor | 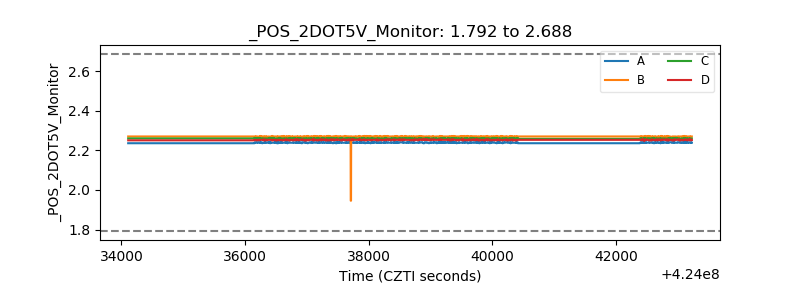 |
| +5 Volts monitor |  |
| _ROLL_ROT | 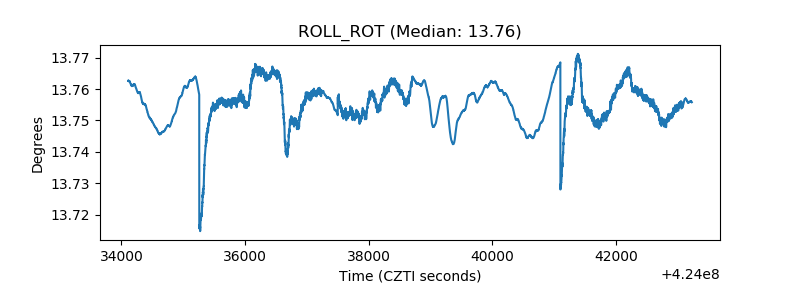 |
| _Roll_DEC | 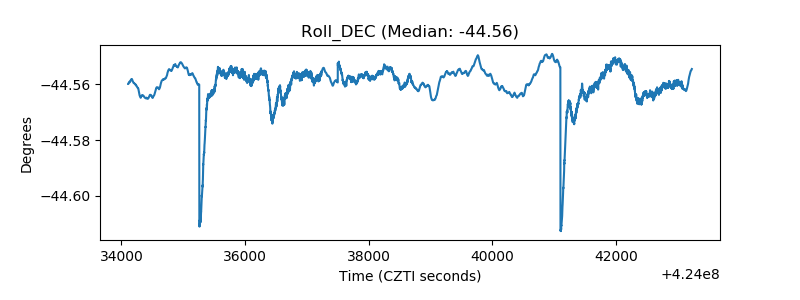 |
| _Roll_RA | 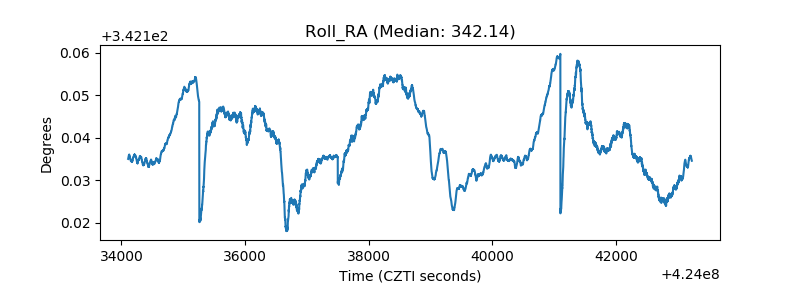 |
| Veto Counter | 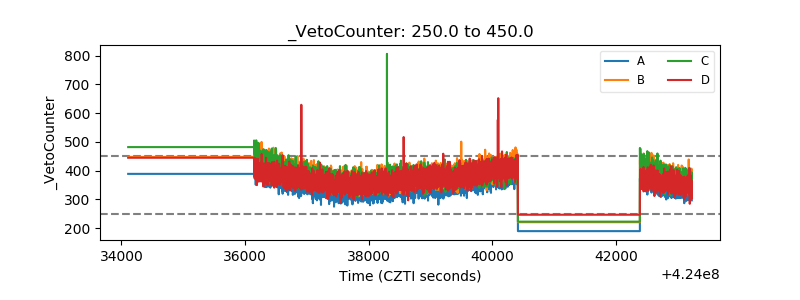 |