| Param | Original file | Final file |
|---|---|---|
| Filename | modeM0/AS1A12_035T02_9000005680_41623cztM0_level2.fits | modeM0/AS1A12_035T02_9000005680_41623cztM0_level2_quad_clean.evt |
| Size (bytes) | 613,828,800 | 75,291,840 |
| Size | 585.4 MB | 71.8 MB |
| Events in quadrant A | 2,932,863 | 612,484 |
| Events in quadrant B | 2,591,124 | 624,298 |
| Events in quadrant C | 3,068,451 | 579,820 |
| Events in quadrant D | 13,703,452 | 79,962 |
| Mode SS | |||
|---|---|---|---|
| Quadrant | BADHDUFLAG | Total packets | Discarded packets |
| A | 0 | 112 | 0 |
| B | 0 | 112 | 0 |
| C | 0 | 112 | 0 |
| D | 0 | 112 | 0 |
| Mode M0 | |||
|---|---|---|---|
| Quadrant | BADHDUFLAG | Total packets | Discarded packets |
| A | 0 | 12056 | 2 |
| B | 0 | 11628 | 2 |
| C | 0 | 12497 | 3 |
| D | 0 | 44365 | 2 |
| Mode M9 | |||
|---|---|---|---|
| Quadrant | BADHDUFLAG | Total packets | Discarded packets |
| A | 0 | 25 | 0 |
| B | 0 | 26 | 0 |
| C | 0 | 26 | 0 |
| D | 0 | 26 | 0 |
| Quadrant | Total seconds | Saturated seconds | Saturation percentage |
|---|---|---|---|
| A | 5474 | 17 | 0.310559% |
| B | 5474 | 37 | 0.675923% |
| C | 5473 | 166 | 3.033071% |
| D | 5473 | 4811 | 87.904257% |
Noise dominated data is calculated using 1-second bins in cleaned event files. If a bin has >2000 counts, and if more than 50% of those come from <1% of pixels, then it is considered to be noise-dominated and hence unusable.
| Quadrant | # 1 sec bins | Bins with >0 counts | Bins with >2000 counts | High rate bins dominated by noise | Noise dominated (total time) | Noise dominated (detector-on time) | Marked lightcurve |
|---|---|---|---|---|---|---|---|
| A | 7117 | 5475 | 5 | 5 | 0.07% | 0.09% | 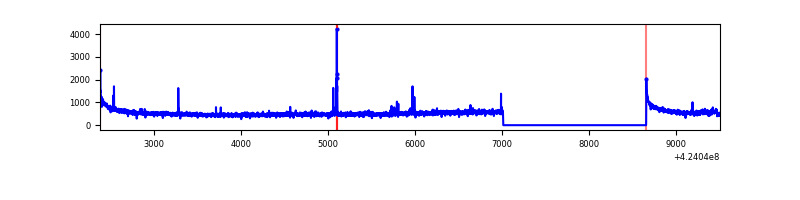 |
| B | 7117 | 5475 | 10 | 10 | 0.14% | 0.18% | 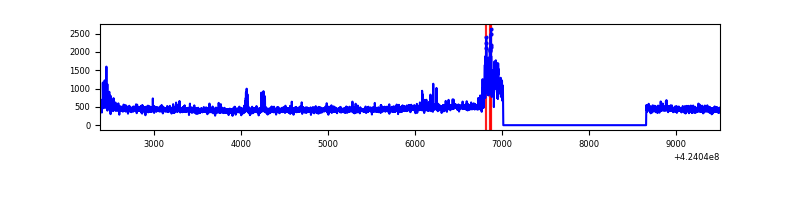 |
| C | 7116 | 5474 | 166 | 166 | 2.33% | 3.03% | 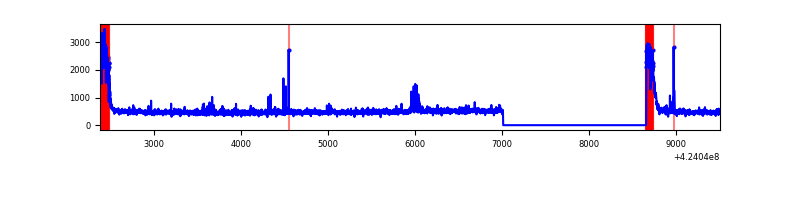 |
| D | 7116 | 5473 | 4491 | 4491 | 63.11% | 82.06% | 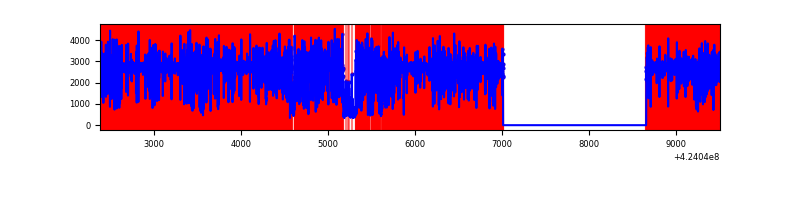 |
Top three noisy pixels from each quadrant. If the there are fewer than three noisy pixels in the level2.evt file, extra rows are filled as -1
| Pixel properties | Quadrant properties | ||||||
|---|---|---|---|---|---|---|---|
| Quadrant | DetID | PixID | Counts | Sigma | Mean | Median | Sigma |
| A | 10 | 83 | 518823 | 4191.25 | 602 | 591 | 123.6 |
| A | 13 | 248 | 37202 | 296.1 | 602 | 591 | 123.6 |
| A | 15 | 223 | 30532 | 242.15 | 602 | 591 | 123.6 |
| B | 0 | 186 | 169254 | 1445.84 | 598 | 579 | 116.7 |
| B | 5 | 255 | 50454 | 427.52 | 598 | 579 | 116.7 |
| B | 12 | 111 | 14864 | 122.45 | 598 | 579 | 116.7 |
| C | 0 | 10 | 455796 | 3337.96 | 581 | 583 | 136.4 |
| C | 15 | 214 | 239215 | 1749.83 | 581 | 583 | 136.4 |
| C | 14 | 254 | 58155 | 422.16 | 581 | 583 | 136.4 |
| D | 12 | 79 | 12064726 | 163492.61 | 300 | 290 | 73.8 |
| D | 13 | 249 | 170692 | 2309.22 | 300 | 290 | 73.8 |
| D | 2 | 120 | 150983 | 2042.13 | 300 | 290 | 73.8 |
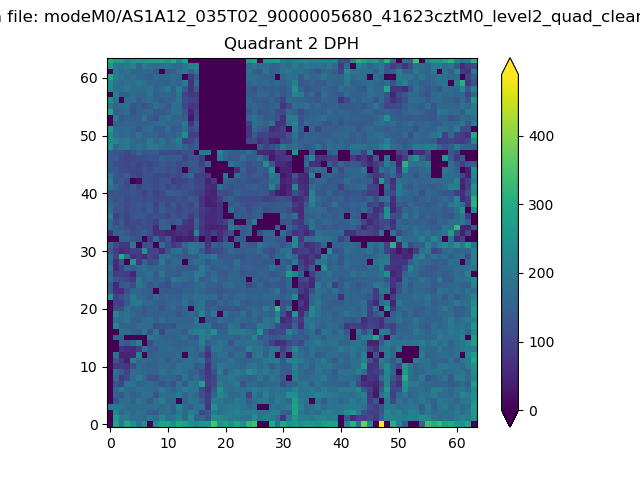
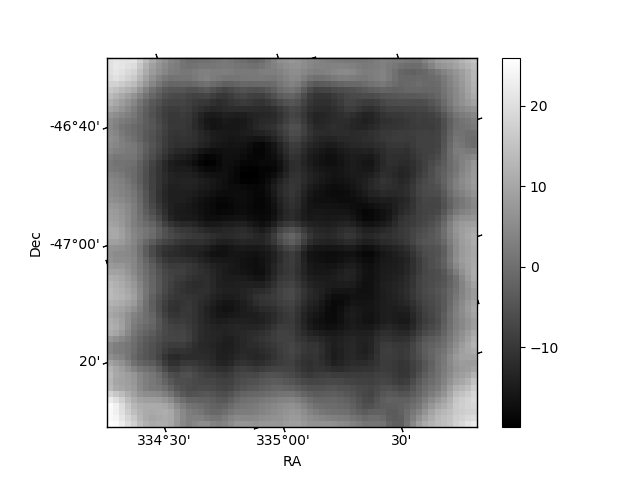
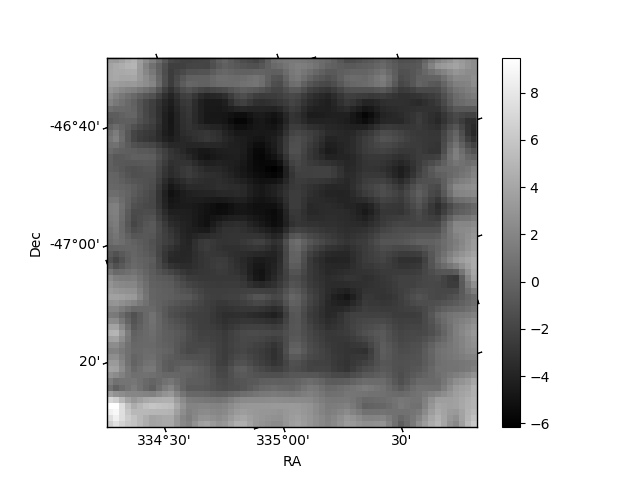
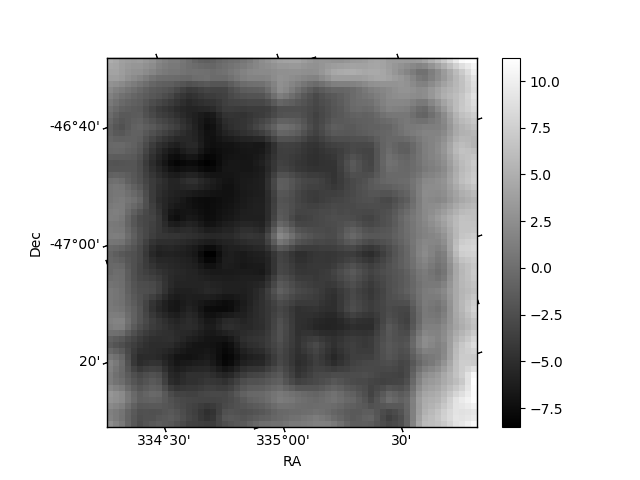
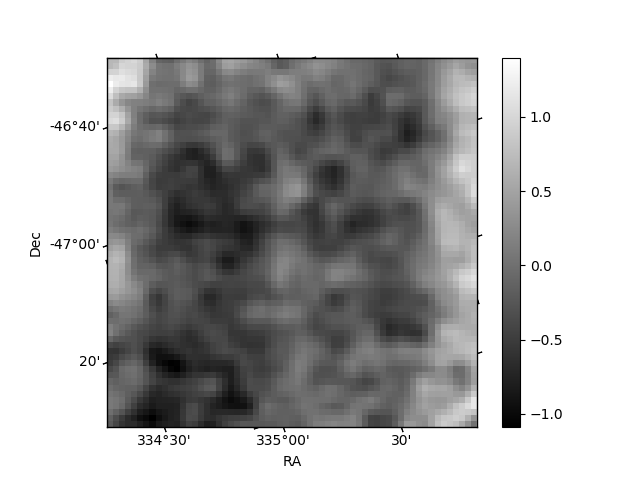
Histogram calculated using DETX and DETY for each event in the final _common_clean file
| Quadrant A | 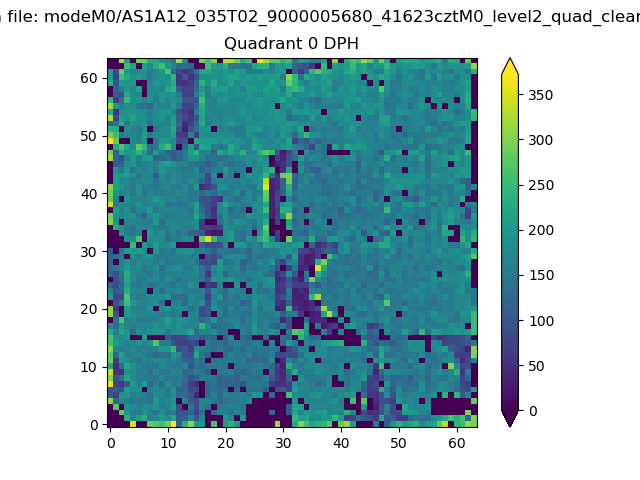 |
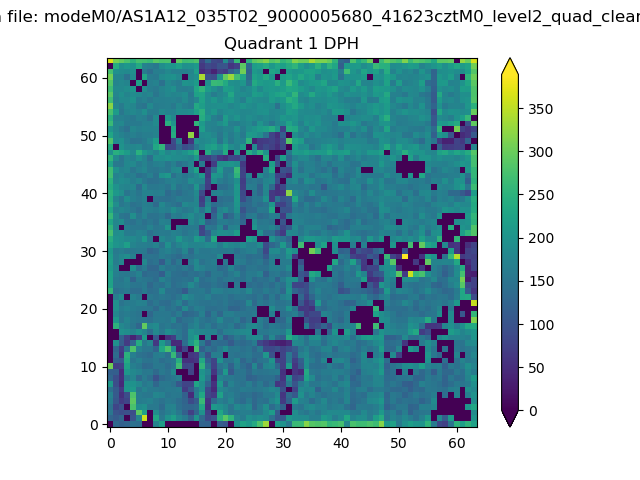 |
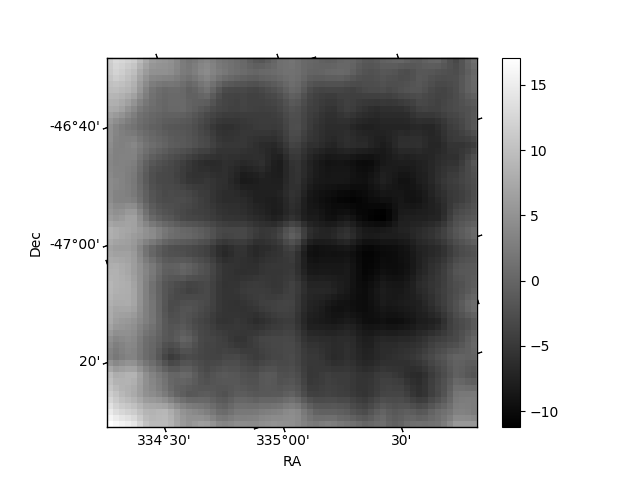
Quadrant B |
|---|---|---|---|
| Quadrant D | 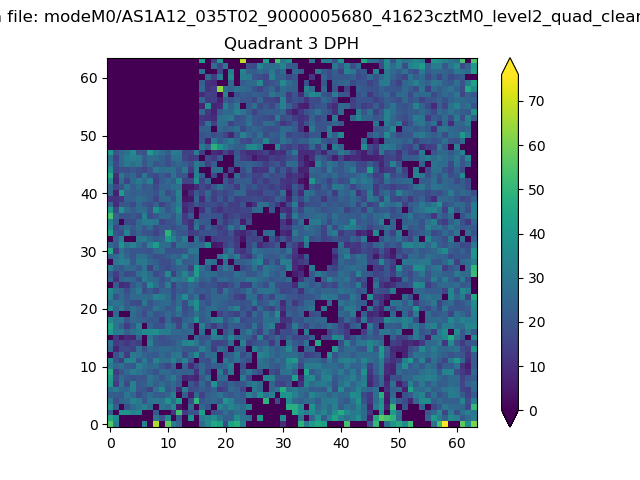 |
 |
Quadrant C |
| Plot type | Count rate plots | Images |
|---|---|---|
| Comparison with Poisson distribution Blue bars denote a histogram of data divided into 1 sec bins. Red curve is a Poisson curve with rate = median count rate of data. |
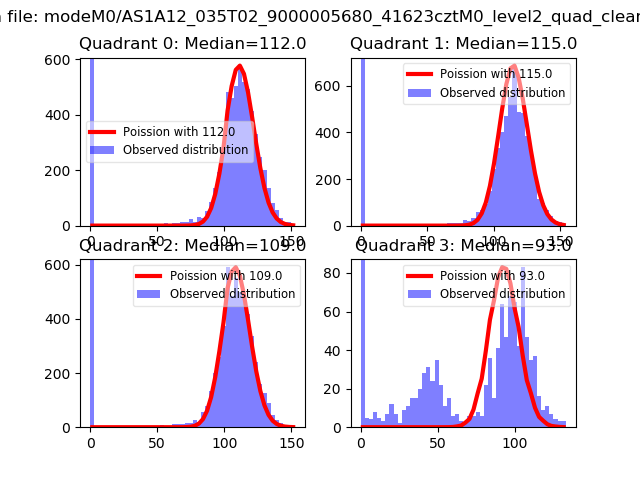 |
 |
| Quadrant-wise count rates Data is divided into 100 sec bins |
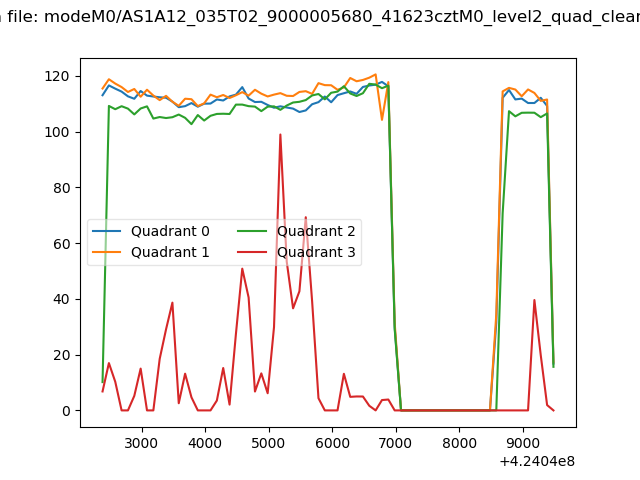 |
|
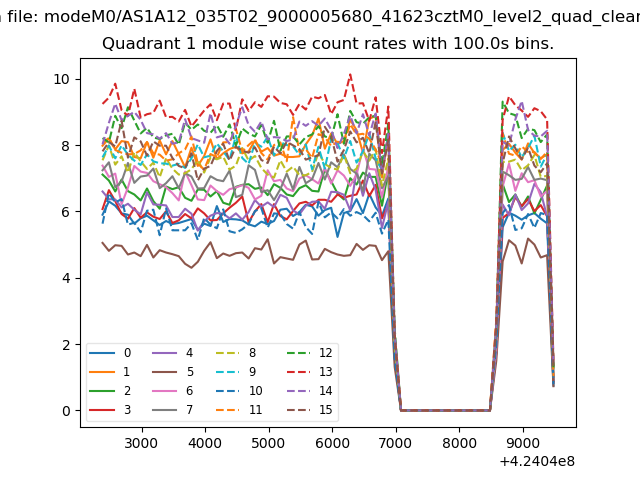
| Module-wise count rates for Quadrant A Data is divided into 100 sec bins |
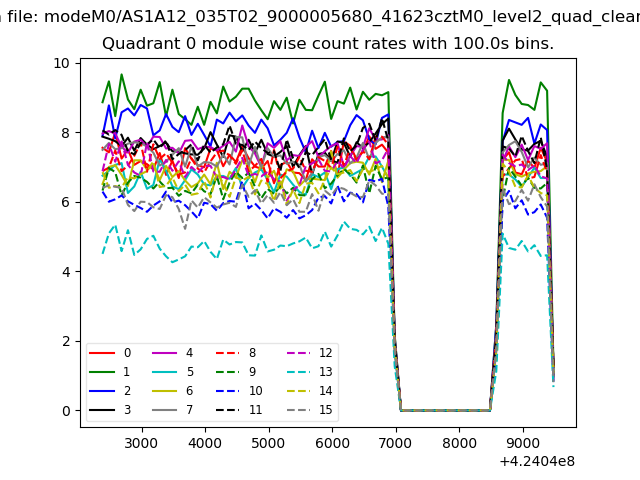 |
 |
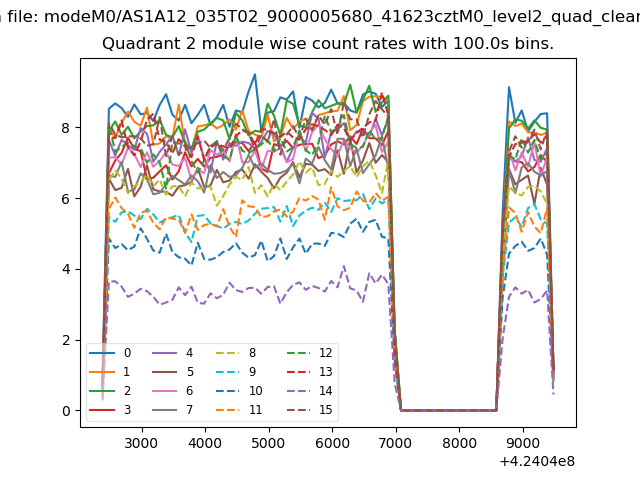
| Module-wise count rates for Quadrant B Data is divided into 100 sec bins |
 |
 |
| Module-wise count rates for Quadrant C Data is divided into 100 sec bins |
 |
 |
| Module-wise count rates for Quadrant D Data is divided into 100 sec bins |
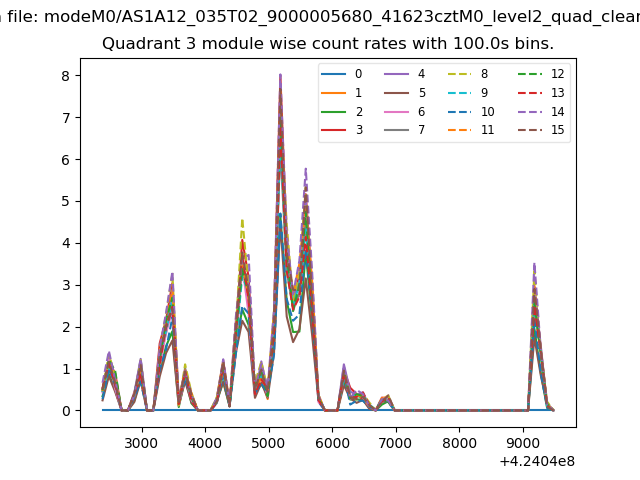 |
 |
| Parameter | Plot |
|---|---|
| CZT HV Monitor | 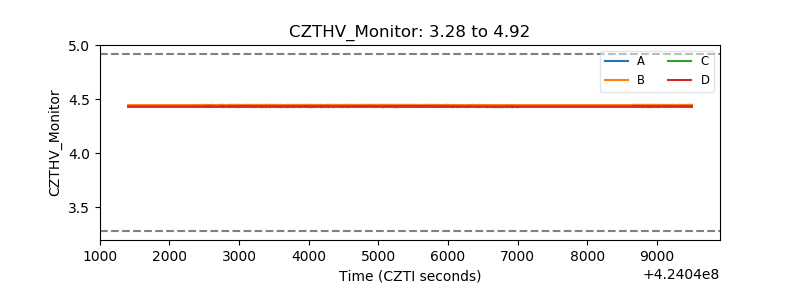 |
| D_VDD | 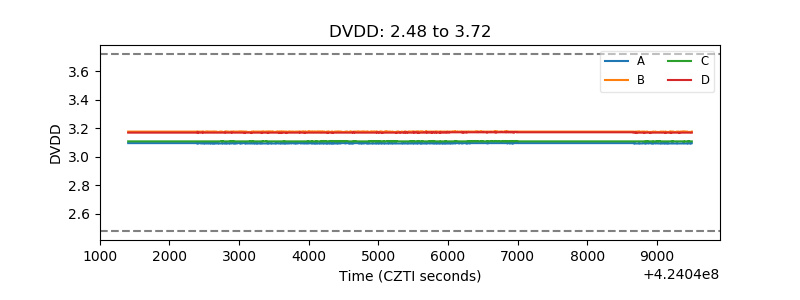 |
| Temperature 1 | 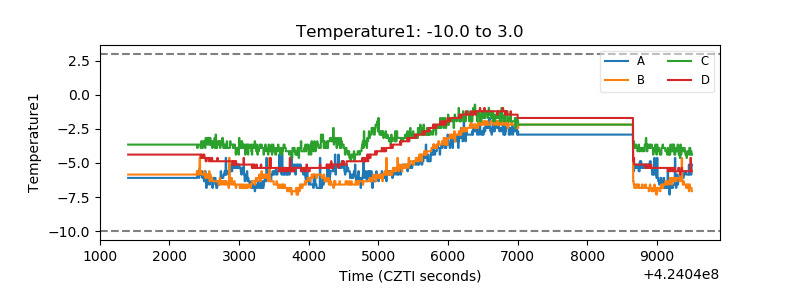 |
| Veto HV Monitor | 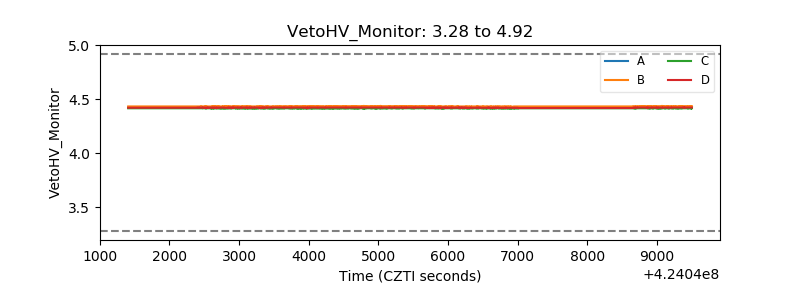 |
| Veto LLD | 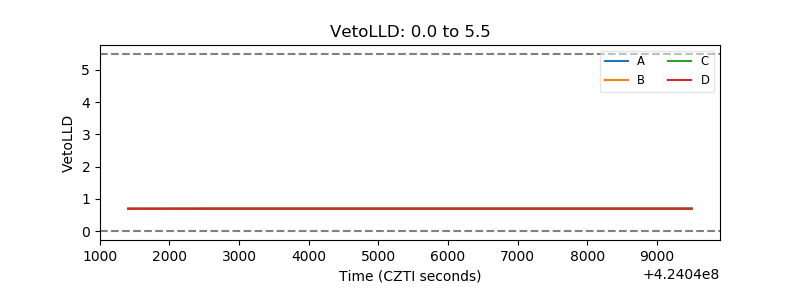 |
| Alpha Counter | 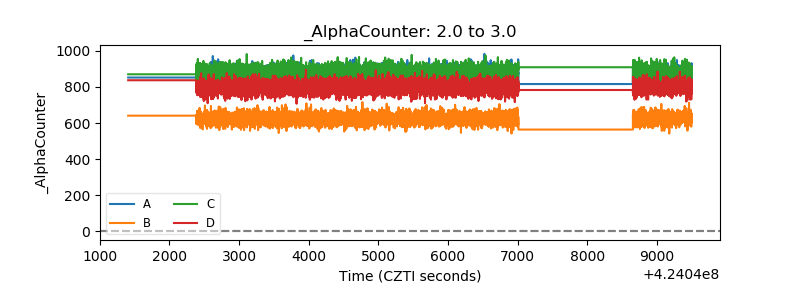 |
| _CPM_Rate | 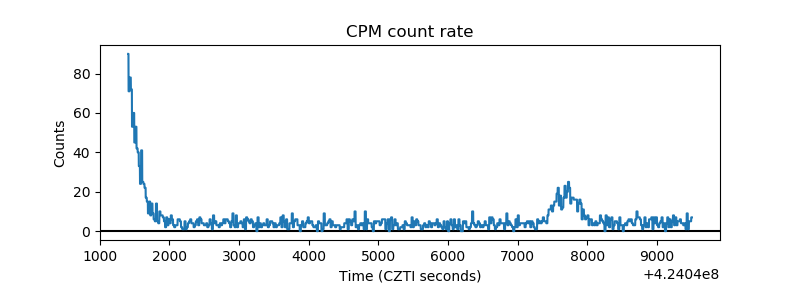 |
| CZT Counter |  |
| +2.5 Volts monitor | 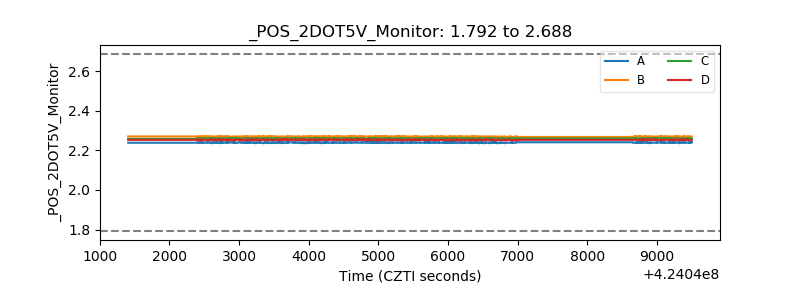 |
| +5 Volts monitor | 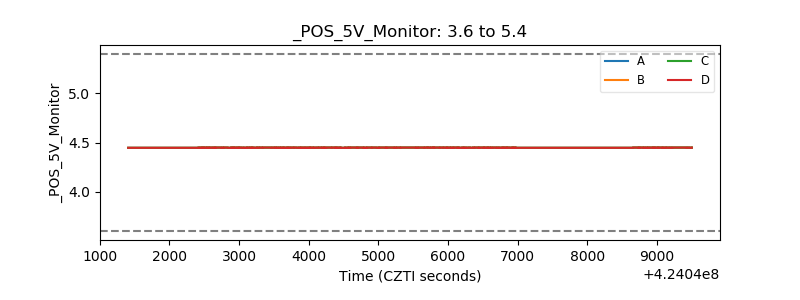 |
| _ROLL_ROT | 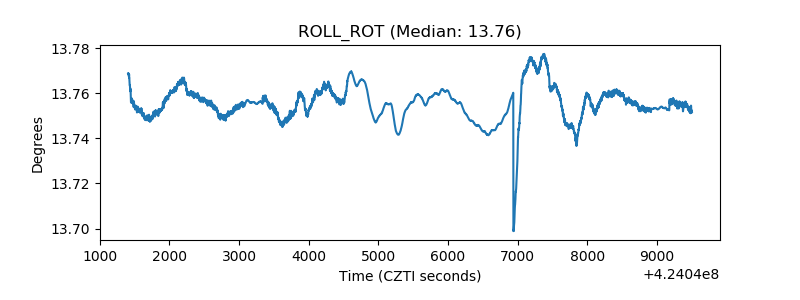 |
| _Roll_DEC | 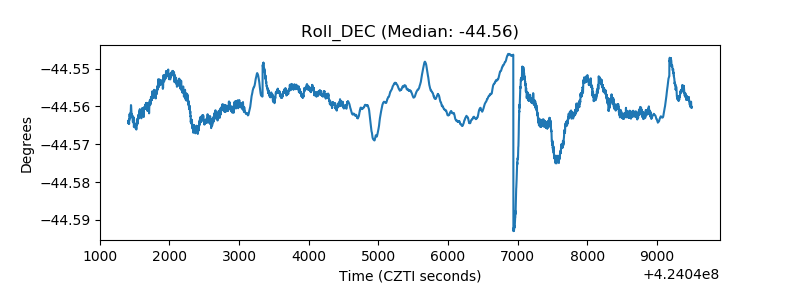 |
| _Roll_RA | 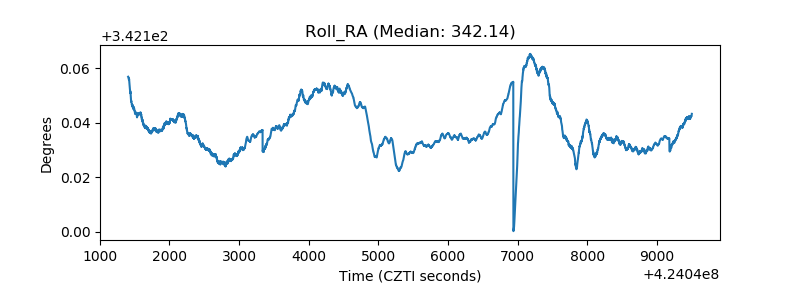 |
| Veto Counter | 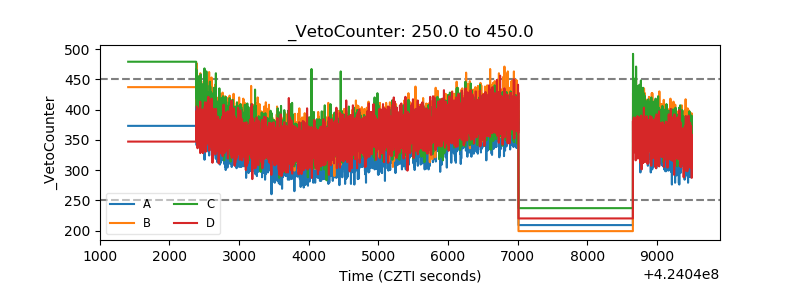 |