| Param | Original file | Final file |
|---|---|---|
| Filename | modeM0/AS1A12_035T02_9000005680_41624cztM0_level2.fits | modeM0/AS1A12_035T02_9000005680_41624cztM0_level2_quad_clean.evt |
| Size (bytes) | 565,836,480 | 83,111,040 |
| Size | 539.6 MB | 79.3 MB |
| Events in quadrant A | 3,098,498 | 628,332 |
| Events in quadrant B | 2,685,267 | 644,141 |
| Events in quadrant C | 3,141,240 | 600,640 |
| Events in quadrant D | 11,577,858 | 245,549 |
| Mode SS | |||
|---|---|---|---|
| Quadrant | BADHDUFLAG | Total packets | Discarded packets |
| A | 0 | 116 | 0 |
| B | 0 | 116 | 0 |
| C | 0 | 116 | 0 |
| D | 0 | 116 | 0 |
| Mode M0 | |||
|---|---|---|---|
| Quadrant | BADHDUFLAG | Total packets | Discarded packets |
| A | 0 | 12606 | 3 |
| B | 0 | 12034 | 2 |
| C | 0 | 12824 | 2 |
| D | 0 | 38285 | 2 |
| Mode M9 | |||
|---|---|---|---|
| Quadrant | BADHDUFLAG | Total packets | Discarded packets |
| A | 0 | 23 | 0 |
| B | 0 | 24 | 0 |
| C | 0 | 24 | 0 |
| D | 0 | 24 | 0 |
| Quadrant | Total seconds | Saturated seconds | Saturation percentage |
|---|---|---|---|
| A | 5687 | 24 | 0.422015% |
| B | 5687 | 19 | 0.334095% |
| C | 5687 | 134 | 2.356251% |
| D | 5687 | 3563 | 62.651662% |
Noise dominated data is calculated using 1-second bins in cleaned event files. If a bin has >2000 counts, and if more than 50% of those come from <1% of pixels, then it is considered to be noise-dominated and hence unusable.
| Quadrant | # 1 sec bins | Bins with >0 counts | Bins with >2000 counts | High rate bins dominated by noise | Noise dominated (total time) | Noise dominated (detector-on time) | Marked lightcurve |
|---|---|---|---|---|---|---|---|
| A | 7060 | 5688 | 12 | 12 | 0.17% | 0.21% | 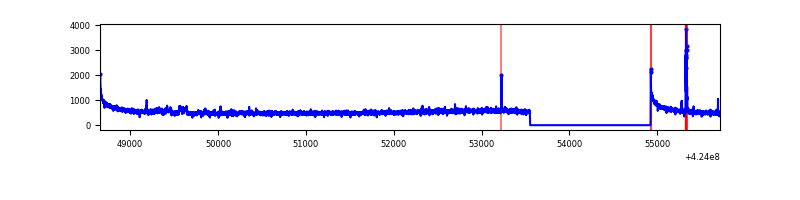 |
| B | 7060 | 5688 | 0 | 0 | 0.00% | 0.00% | 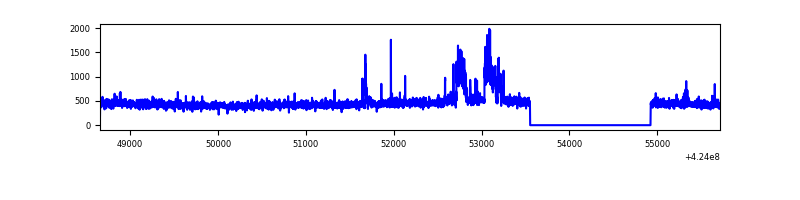 |
| C | 7060 | 5688 | 124 | 124 | 1.76% | 2.18% | 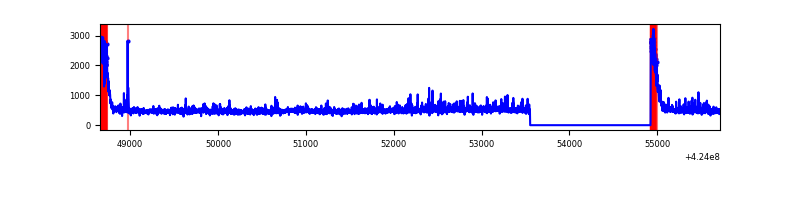 |
| D | 7060 | 5688 | 3240 | 3240 | 45.89% | 56.96% | 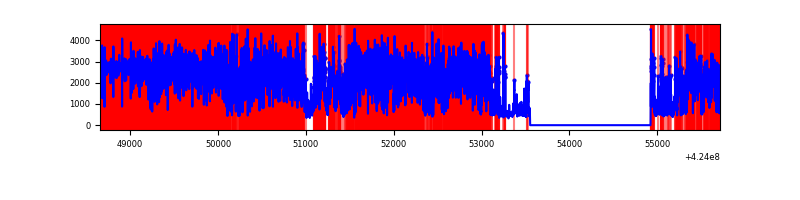 |
Top three noisy pixels from each quadrant. If the there are fewer than three noisy pixels in the level2.evt file, extra rows are filled as -1
| Pixel properties | Quadrant properties | ||||||
|---|---|---|---|---|---|---|---|
| Quadrant | DetID | PixID | Counts | Sigma | Mean | Median | Sigma |
| A | 10 | 83 | 550951 | 4230.23 | 628 | 616 | 130.1 |
| A | 15 | 223 | 61536 | 468.27 | 628 | 616 | 130.1 |
| A | 13 | 248 | 37502 | 283.53 | 628 | 616 | 130.1 |
| B | 0 | 186 | 186894 | 1530.3 | 622 | 604 | 121.7 |
| B | 5 | 255 | 26886 | 215.9 | 622 | 604 | 121.7 |
| B | 12 | 111 | 15371 | 121.31 | 622 | 604 | 121.7 |
| C | 0 | 10 | 389347 | 2715.45 | 608 | 612 | 143.2 |
| C | 15 | 214 | 250615 | 1746.36 | 608 | 612 | 143.2 |
| C | 0 | 15 | 85291 | 591.51 | 608 | 612 | 143.2 |
| D | 12 | 79 | 8149427 | 73029.54 | 452 | 437 | 111.6 |
| D | 13 | 249 | 1433556 | 12843.31 | 452 | 437 | 111.6 |
| D | 2 | 249 | 107212 | 956.9 | 452 | 437 | 111.6 |
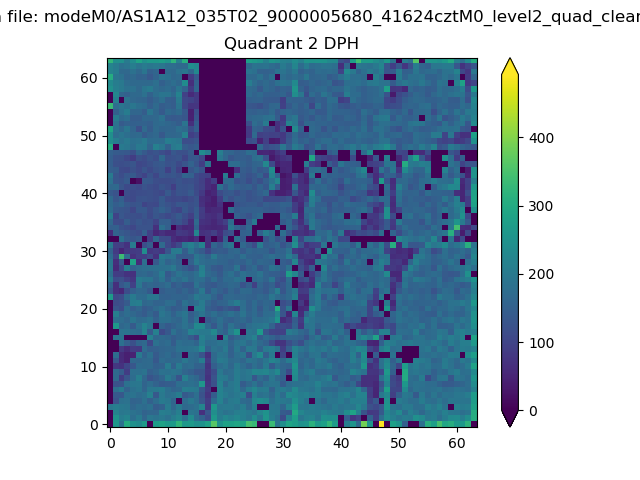
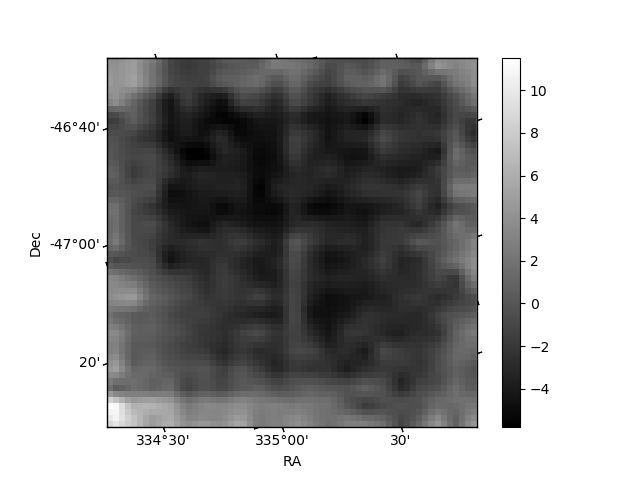
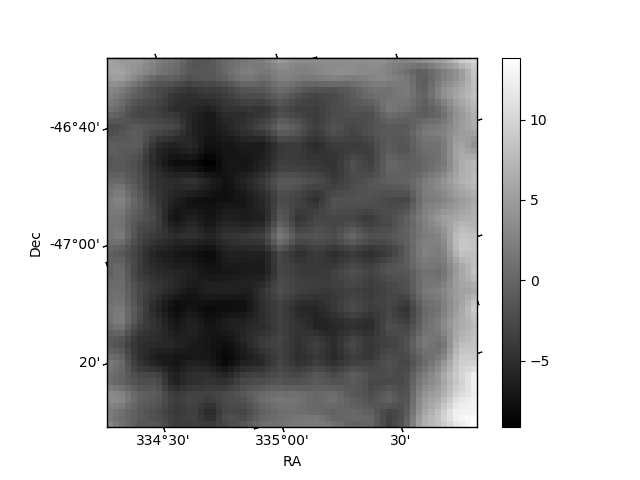
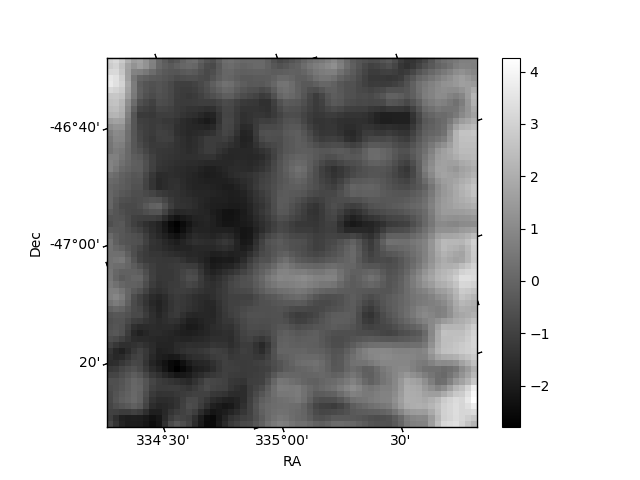
Histogram calculated using DETX and DETY for each event in the final _common_clean file
| Quadrant A | 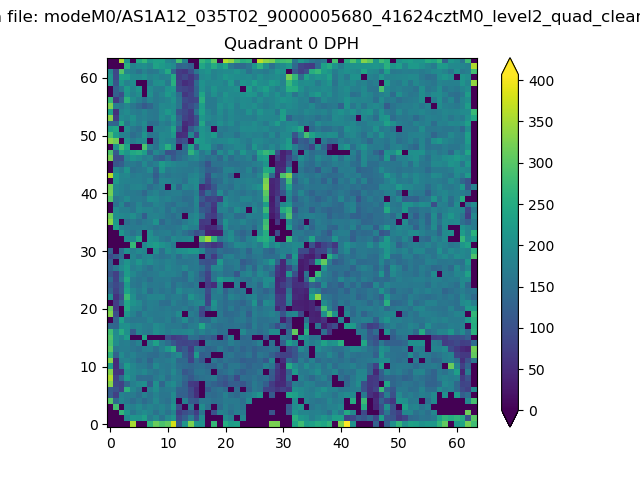 |
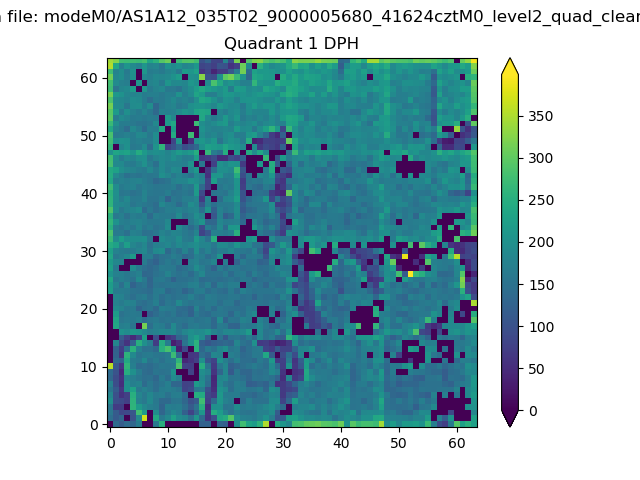 |
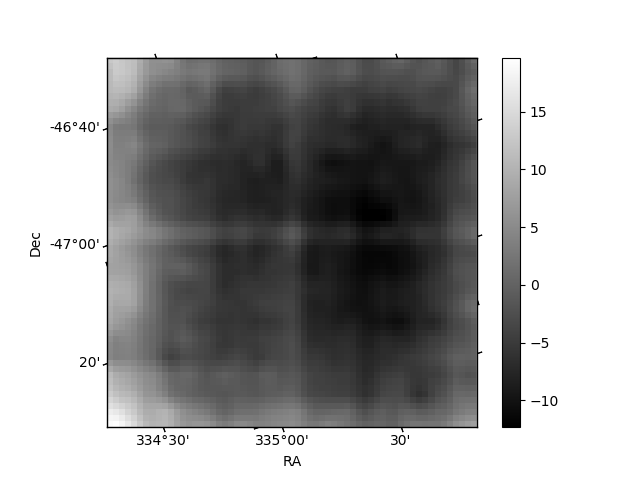
Quadrant B |
|---|---|---|---|
| Quadrant D | 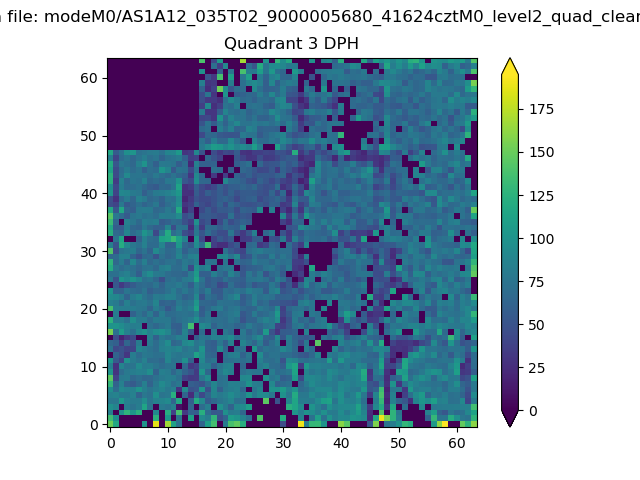 |
 |
Quadrant C |
| Plot type | Count rate plots | Images |
|---|---|---|
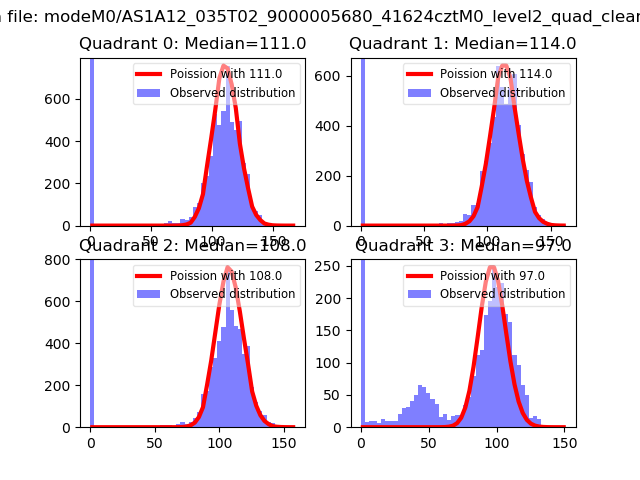
| Comparison with Poisson distribution Blue bars denote a histogram of data divided into 1 sec bins. Red curve is a Poisson curve with rate = median count rate of data. |
 |
 |
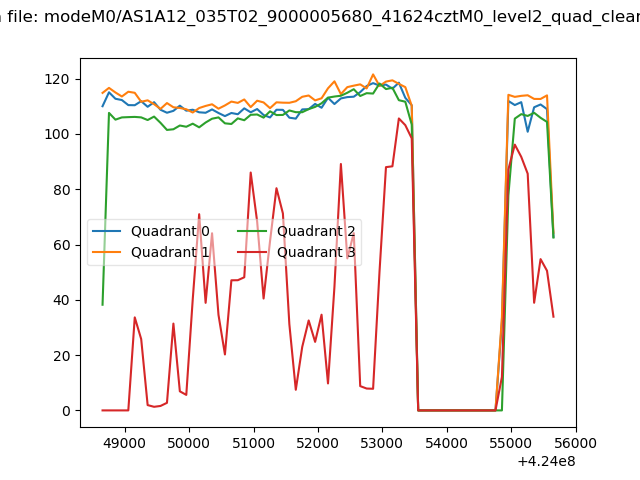
| Quadrant-wise count rates Data is divided into 100 sec bins |
 |
|
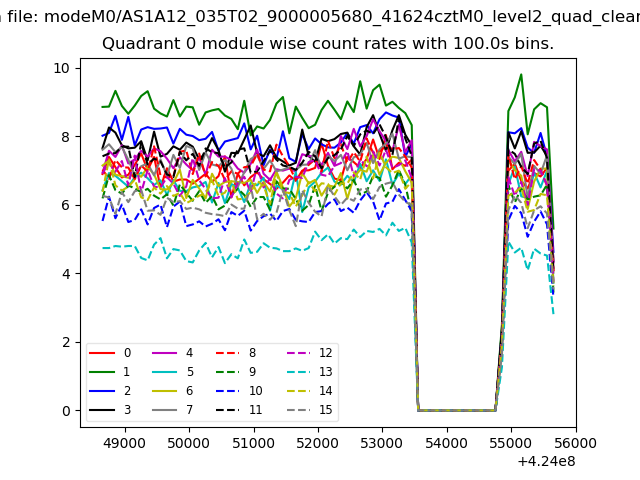
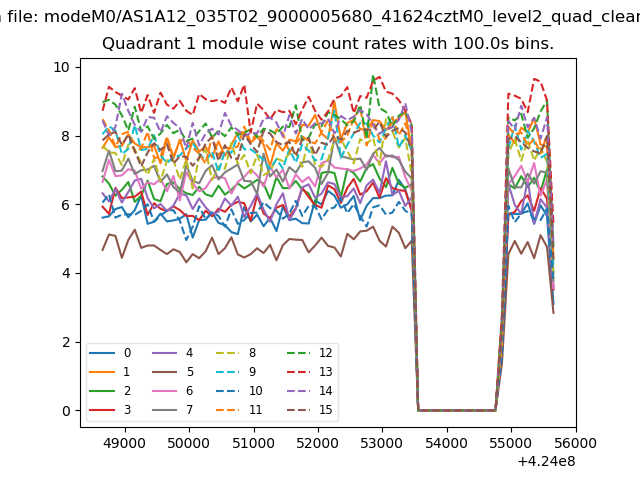
| Module-wise count rates for Quadrant A Data is divided into 100 sec bins |
 |
 |
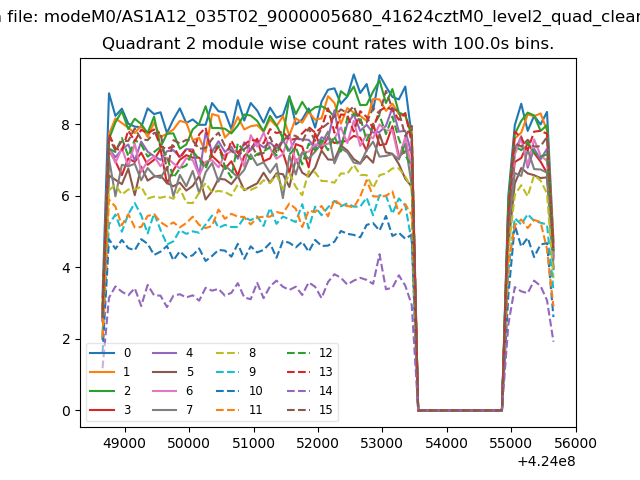
| Module-wise count rates for Quadrant B Data is divided into 100 sec bins |
 |
 |
| Module-wise count rates for Quadrant C Data is divided into 100 sec bins |
 |
 |
| Module-wise count rates for Quadrant D Data is divided into 100 sec bins |
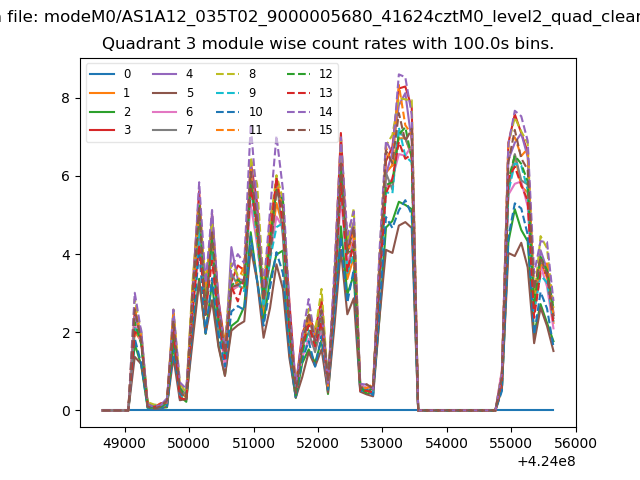 |
 |
| Parameter | Plot |
|---|---|
| CZT HV Monitor | 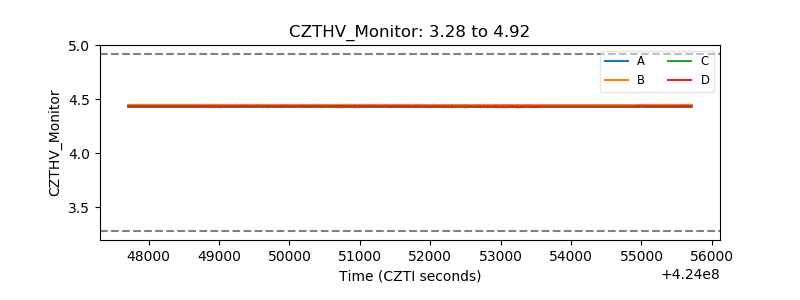 |
| D_VDD | 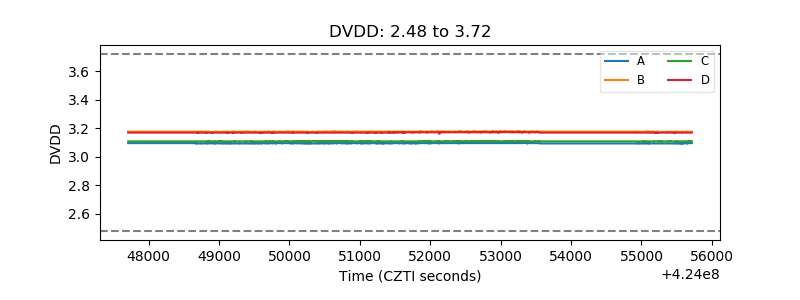 |
| Temperature 1 | 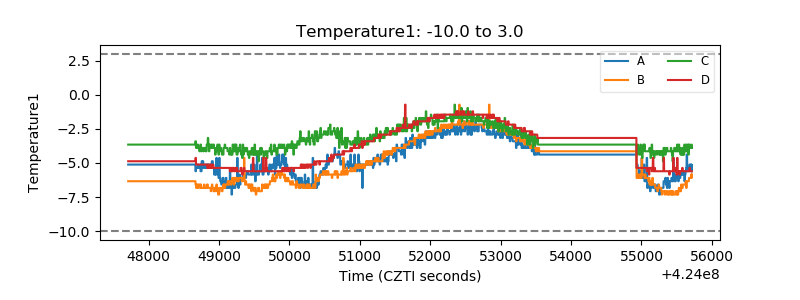 |
| Veto HV Monitor | 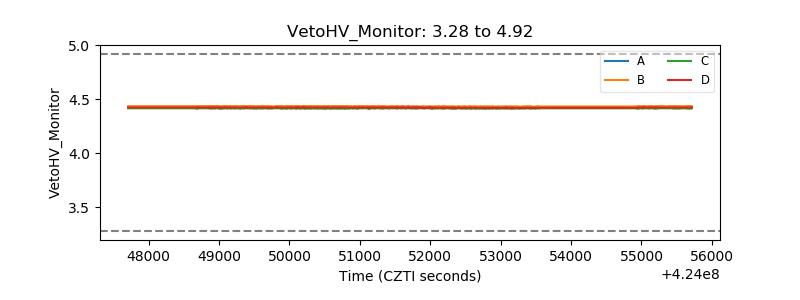 |
| Veto LLD | 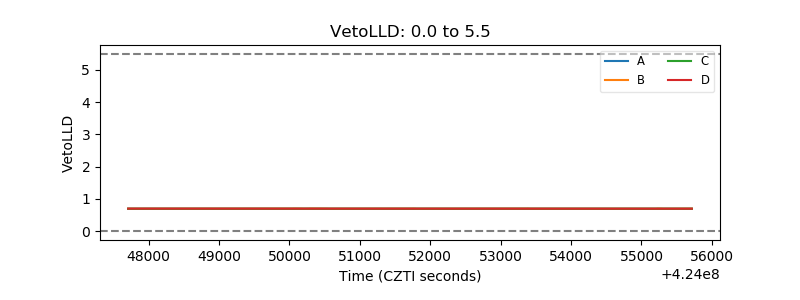 |
| Alpha Counter | 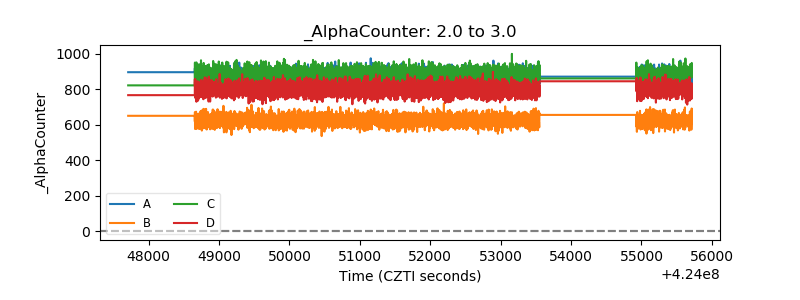 |
| _CPM_Rate | 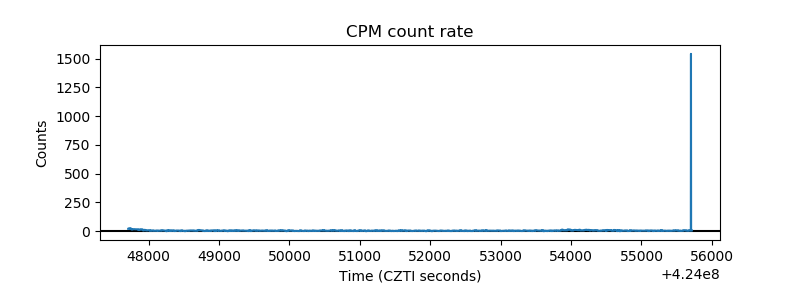 |
| CZT Counter | 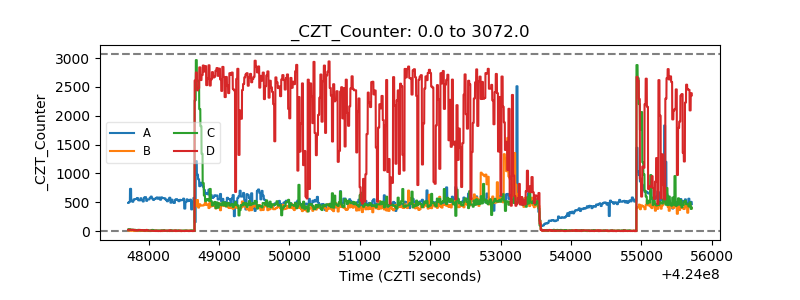 |
| +2.5 Volts monitor | 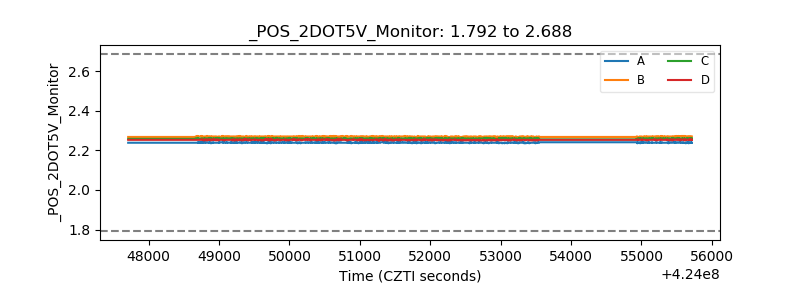 |
| +5 Volts monitor |  |
| _ROLL_ROT | 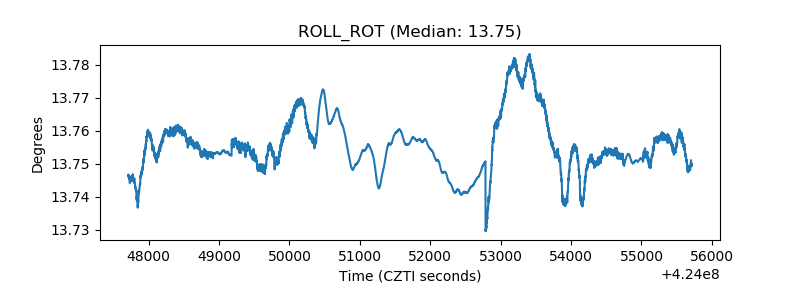 |
| _Roll_DEC | 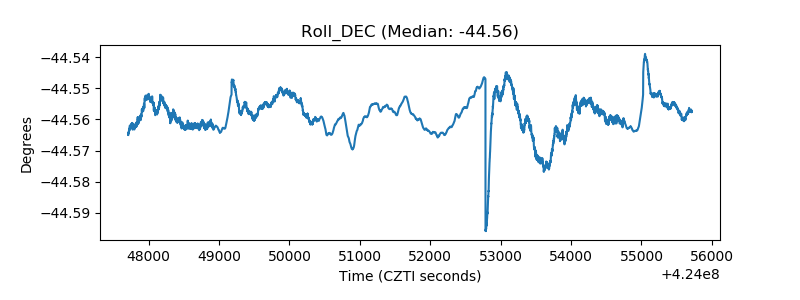 |
| _Roll_RA | 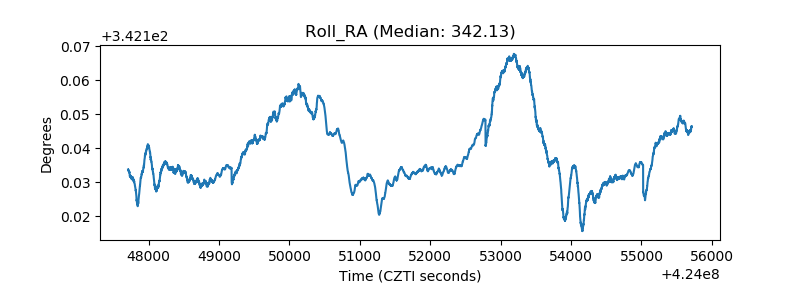 |
| Veto Counter | 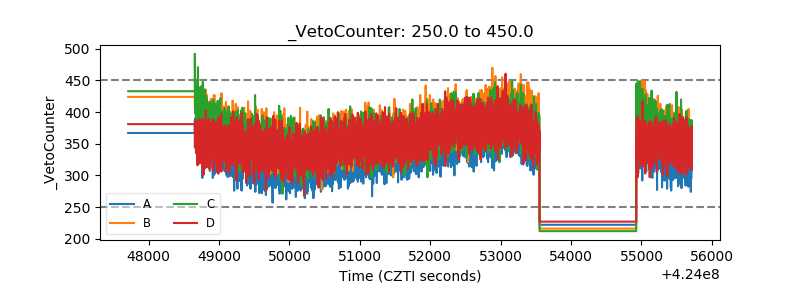 |