| Param | Original file | Final file |
|---|---|---|
| Filename | modeM0/AS1A12_035T02_9000005680_41625cztM0_level2.fits | modeM0/AS1A12_035T02_9000005680_41625cztM0_level2_quad_clean.evt |
| Size (bytes) | 585,973,440 | 91,932,480 |
| Size | 558.8 MB | 87.7 MB |
| Events in quadrant A | 3,374,724 | 674,110 |
| Events in quadrant B | 2,964,717 | 694,387 |
| Events in quadrant C | 3,367,256 | 656,016 |
| Events in quadrant D | 11,505,581 | 329,254 |
| Mode SS | |||
|---|---|---|---|
| Quadrant | BADHDUFLAG | Total packets | Discarded packets |
| A | 0 | 126 | 0 |
| B | 0 | 126 | 0 |
| C | 0 | 126 | 0 |
| D | 0 | 126 | 0 |
| Mode M0 | |||
|---|---|---|---|
| Quadrant | BADHDUFLAG | Total packets | Discarded packets |
| A | 0 | 13657 | 2 |
| B | 0 | 13015 | 2 |
| C | 0 | 13815 | 2 |
| D | 0 | 38395 | 2 |
| Mode M9 | |||
|---|---|---|---|
| Quadrant | BADHDUFLAG | Total packets | Discarded packets |
| A | 0 | 27 | 0 |
| B | 0 | 27 | 0 |
| C | 0 | 27 | 0 |
| D | 0 | 27 | 0 |
| Quadrant | Total seconds | Saturated seconds | Saturation percentage |
|---|---|---|---|
| A | 6156 | 37 | 0.601040% |
| B | 6157 | 26 | 0.422284% |
| C | 6157 | 108 | 1.754101% |
| D | 6157 | 3215 | 52.216989% |
Noise dominated data is calculated using 1-second bins in cleaned event files. If a bin has >2000 counts, and if more than 50% of those come from <1% of pixels, then it is considered to be noise-dominated and hence unusable.
| Quadrant | # 1 sec bins | Bins with >0 counts | Bins with >2000 counts | High rate bins dominated by noise | Noise dominated (total time) | Noise dominated (detector-on time) | Marked lightcurve |
|---|---|---|---|---|---|---|---|
| A | 8841 | 6158 | 25 | 25 | 0.28% | 0.41% | 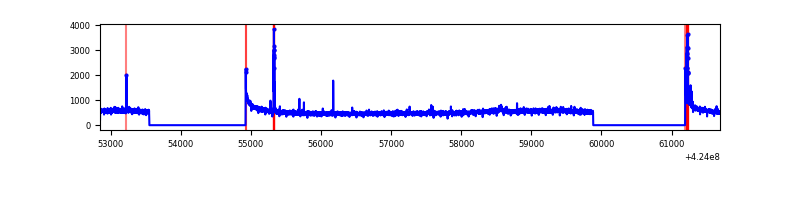 |
| B | 8842 | 6159 | 5 | 5 | 0.06% | 0.08% | 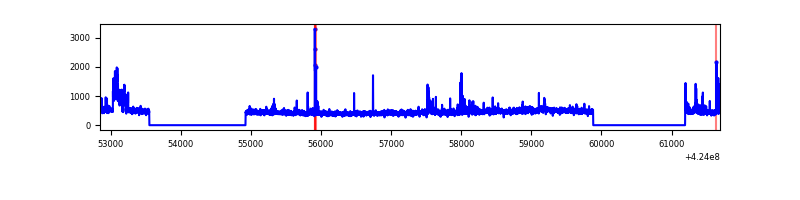 |
| C | 8842 | 6159 | 97 | 97 | 1.10% | 1.57% | 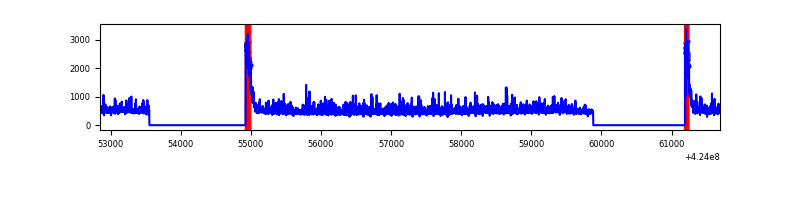 |
| D | 8842 | 6159 | 3012 | 3012 | 34.06% | 48.90% | 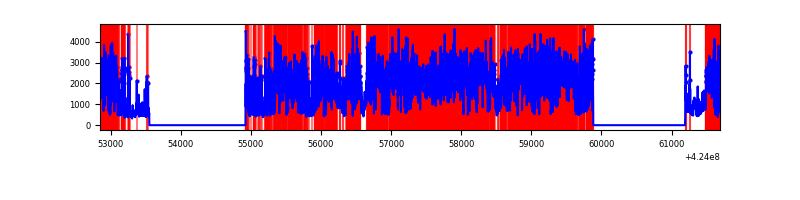 |
Top three noisy pixels from each quadrant. If the there are fewer than three noisy pixels in the level2.evt file, extra rows are filled as -1
| Pixel properties | Quadrant properties | ||||||
|---|---|---|---|---|---|---|---|
| Quadrant | DetID | PixID | Counts | Sigma | Mean | Median | Sigma |
| A | 10 | 83 | 576858 | 4047.06 | 693 | 678 | 142.4 |
| A | 7 | 3 | 37647 | 259.67 | 693 | 678 | 142.4 |
| A | 13 | 248 | 37303 | 257.25 | 693 | 678 | 142.4 |
| B | 5 | 255 | 127672 | 940.82 | 687 | 669 | 135.0 |
| B | 0 | 186 | 113940 | 839.09 | 687 | 669 | 135.0 |
| B | 12 | 111 | 17148 | 122.07 | 687 | 669 | 135.0 |
| C | 0 | 10 | 327241 | 2092.84 | 669 | 674 | 156.0 |
| C | 15 | 214 | 269911 | 1725.43 | 669 | 674 | 156.0 |
| C | 0 | 15 | 157168 | 1002.91 | 669 | 674 | 156.0 |
| D | 12 | 79 | 8470249 | 62123.1 | 544 | 526 | 136.3 |
| D | 13 | 249 | 595939 | 4367.19 | 544 | 526 | 136.3 |
| D | 2 | 249 | 138883 | 1014.81 | 544 | 526 | 136.3 |
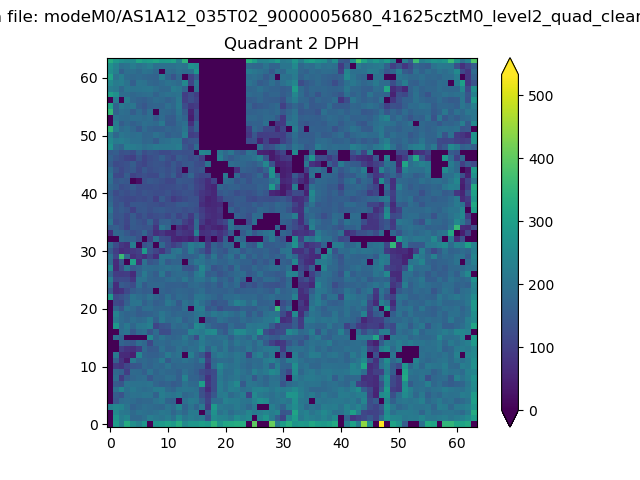
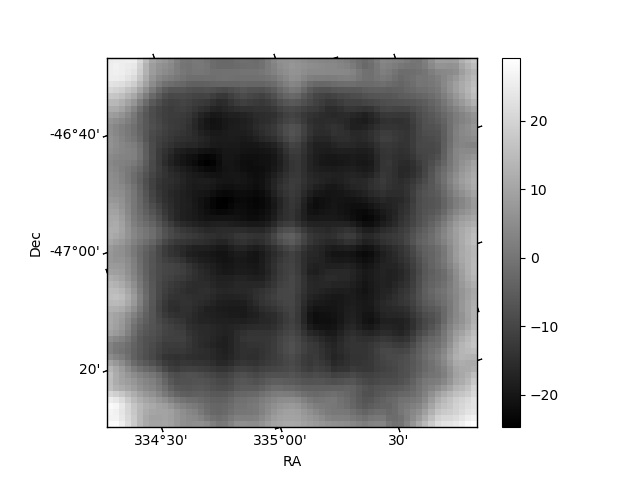
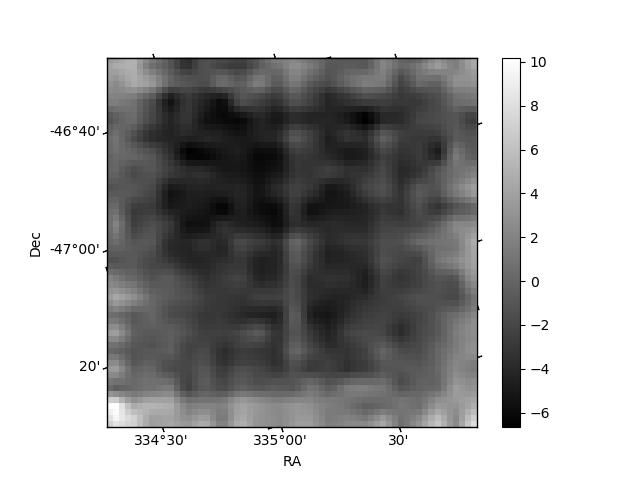
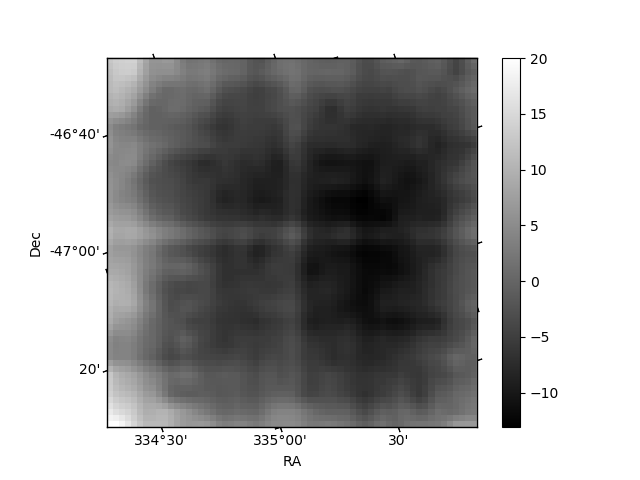
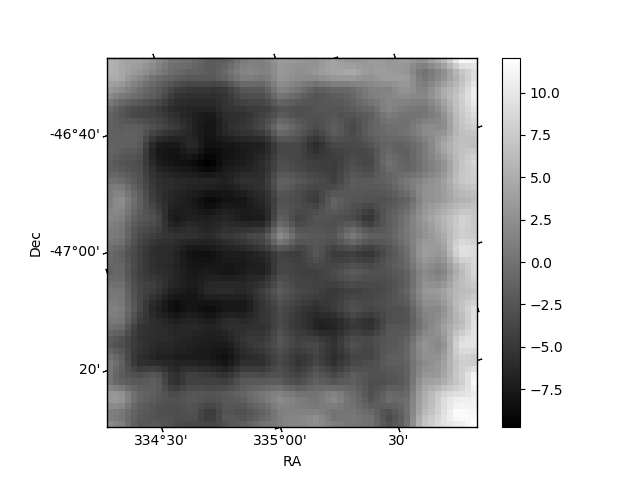
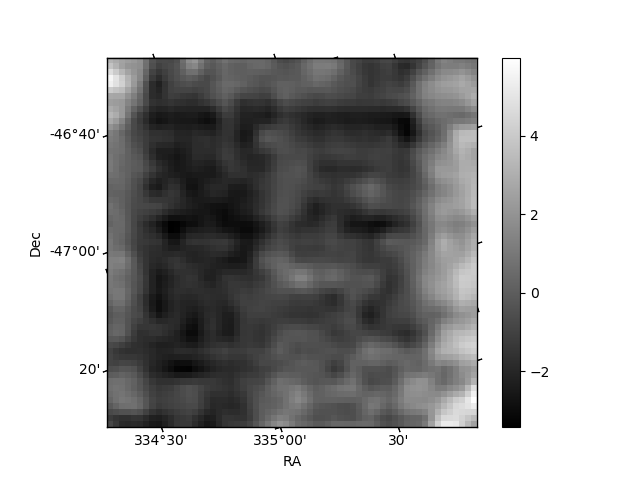
Histogram calculated using DETX and DETY for each event in the final _common_clean file
| Quadrant A | 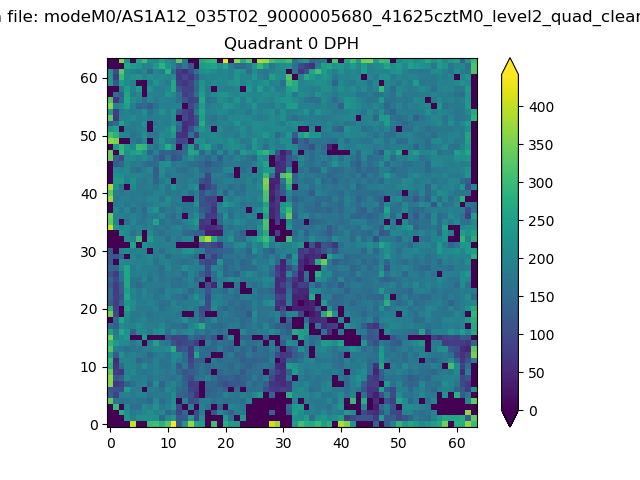 |
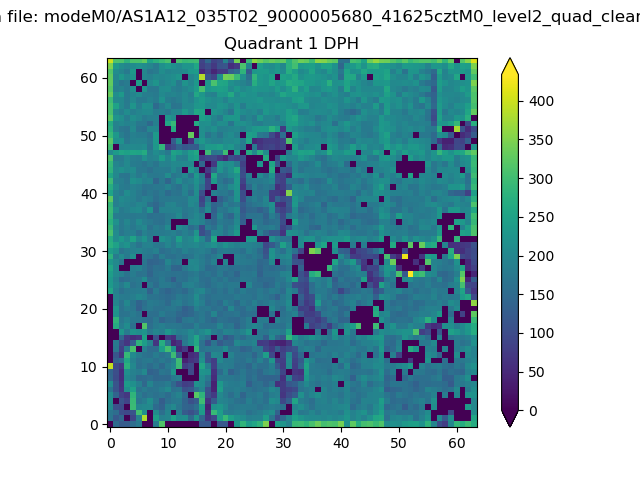 |
Quadrant B |
|---|---|---|---|
| Quadrant D | 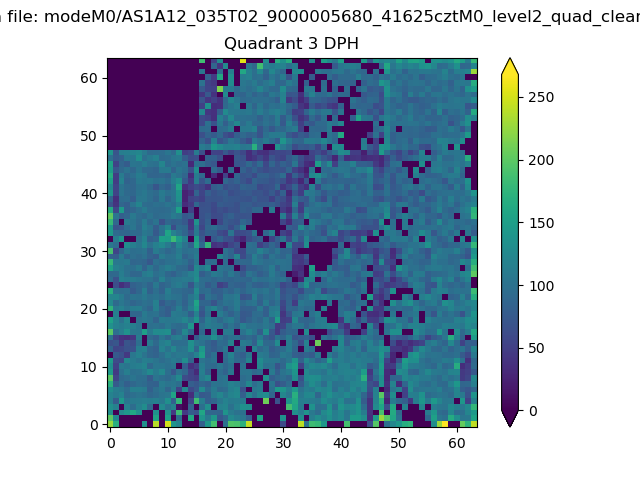 |
 |
Quadrant C |
| Plot type | Count rate plots | Images |
|---|---|---|
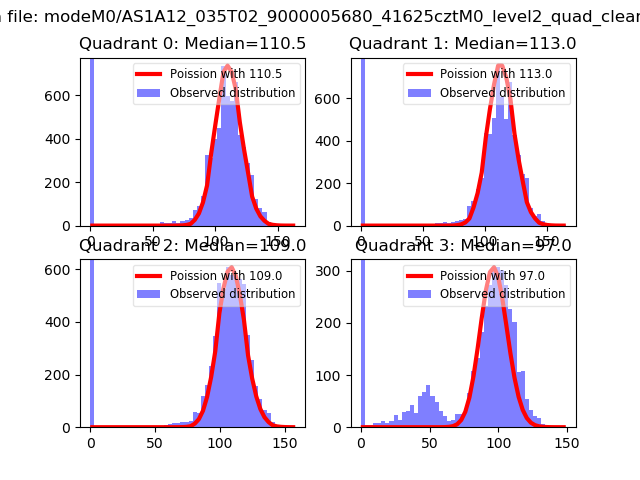
| Comparison with Poisson distribution Blue bars denote a histogram of data divided into 1 sec bins. Red curve is a Poisson curve with rate = median count rate of data. |
 |
 |
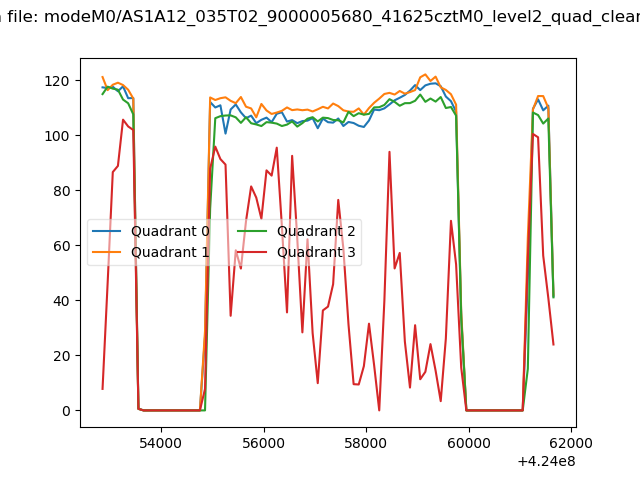
| Quadrant-wise count rates Data is divided into 100 sec bins |
 |
|
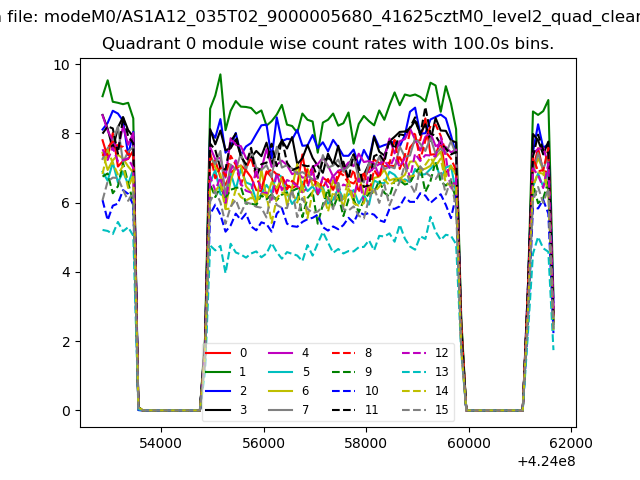
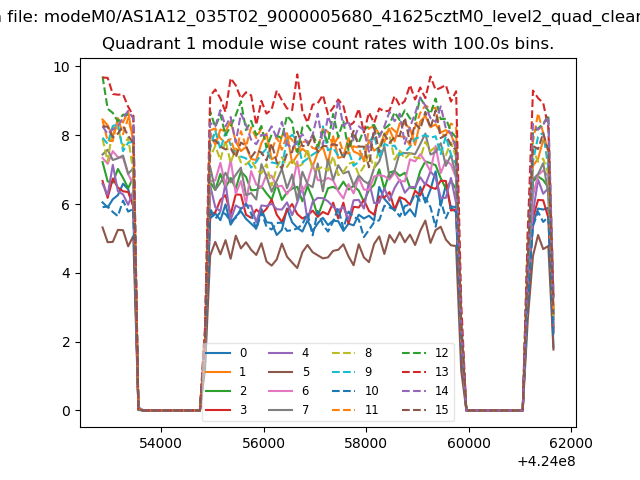
| Module-wise count rates for Quadrant A Data is divided into 100 sec bins |
 |
 |
| Module-wise count rates for Quadrant B Data is divided into 100 sec bins |
 |
 |
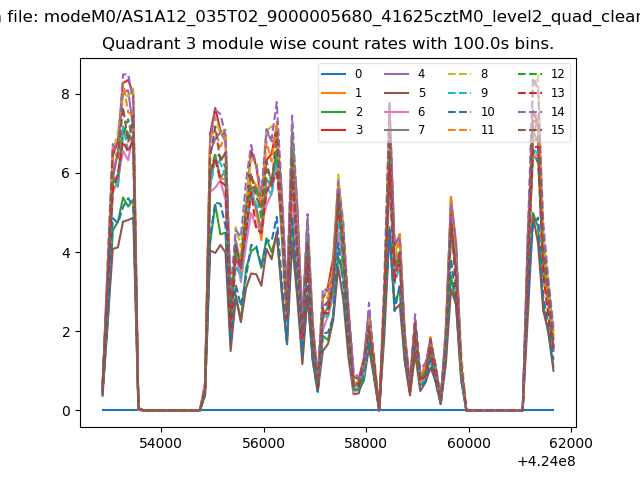
| Module-wise count rates for Quadrant C Data is divided into 100 sec bins |
 |
 |
| Module-wise count rates for Quadrant D Data is divided into 100 sec bins |
 |
 |
| Parameter | Plot |
|---|---|
| CZT HV Monitor | 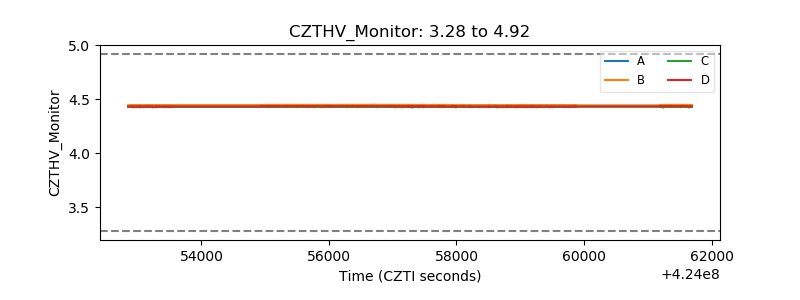 |
| D_VDD | 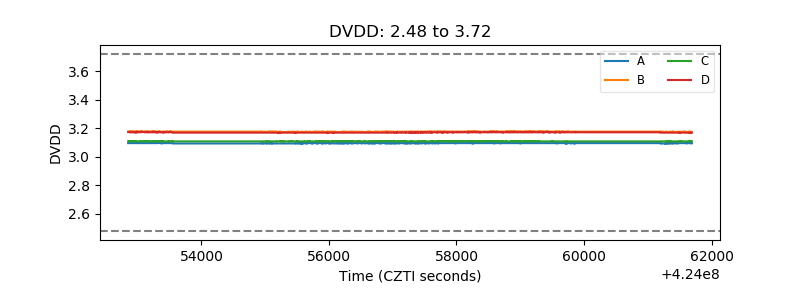 |
| Temperature 1 | 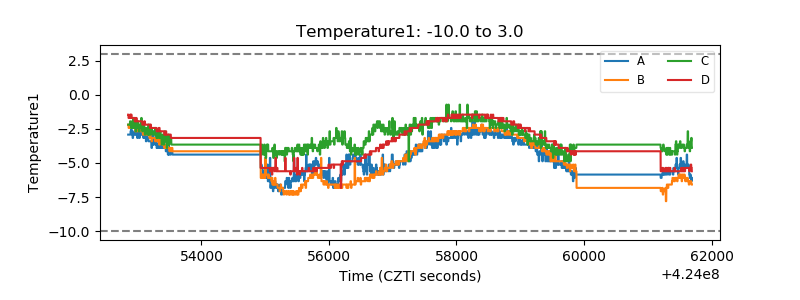 |
| Veto HV Monitor | 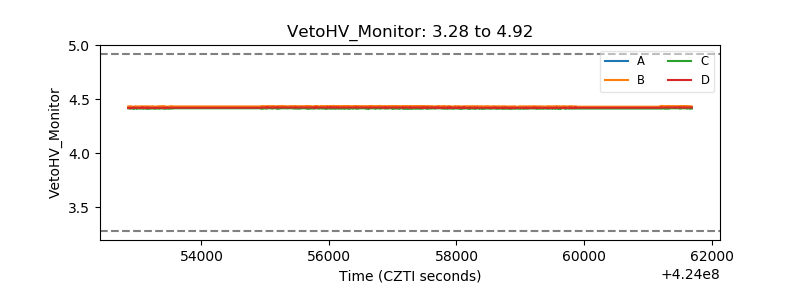 |
| Veto LLD | 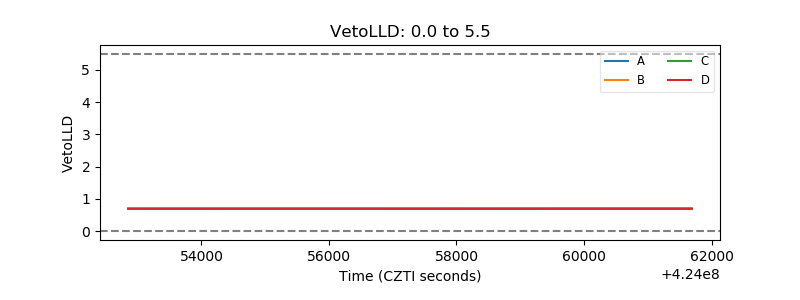 |
| Alpha Counter | 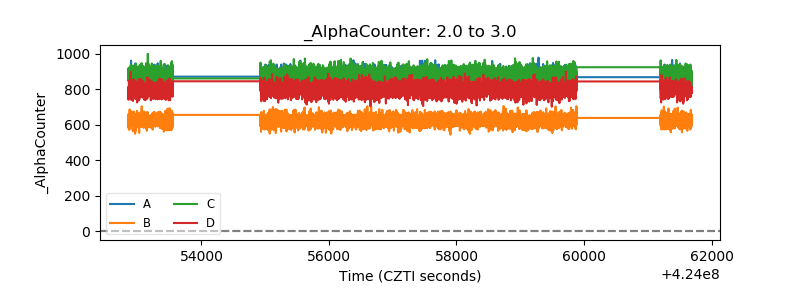 |
| _CPM_Rate | 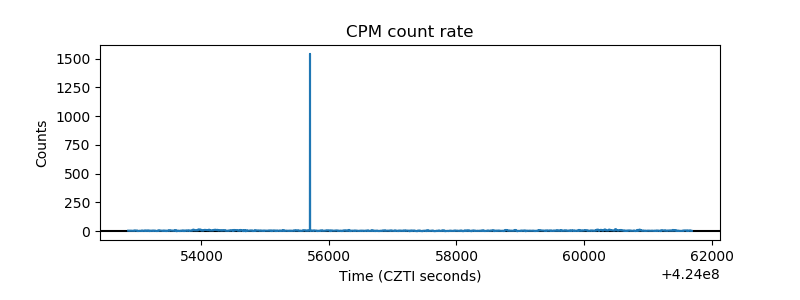 |
| CZT Counter | 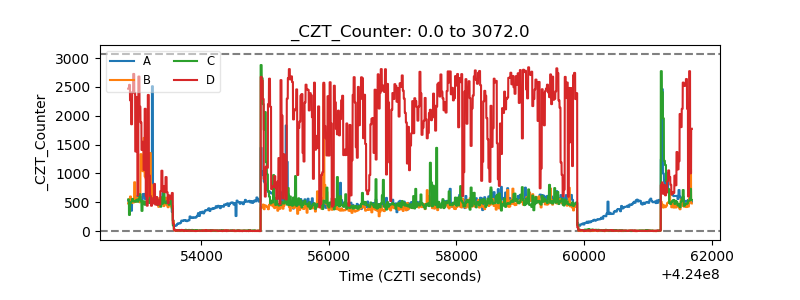 |
| +2.5 Volts monitor |  |
| +5 Volts monitor |  |
| _ROLL_ROT | 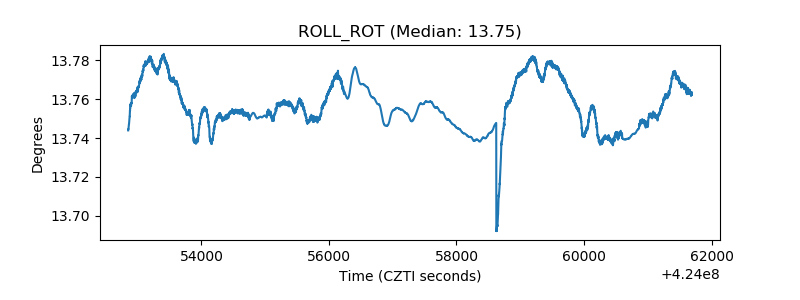 |
| _Roll_DEC | 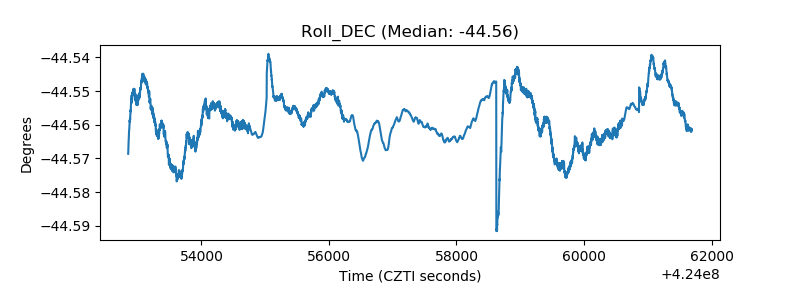 |
| _Roll_RA | 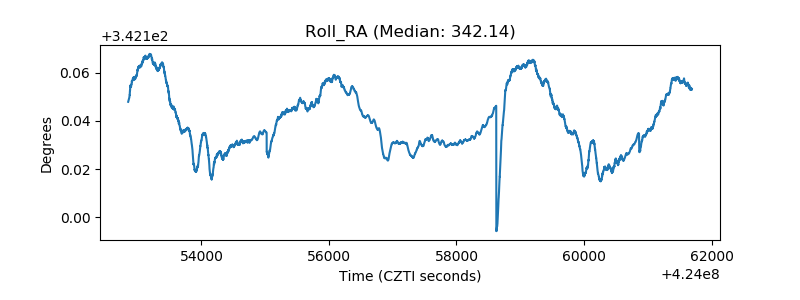 |
| Veto Counter | 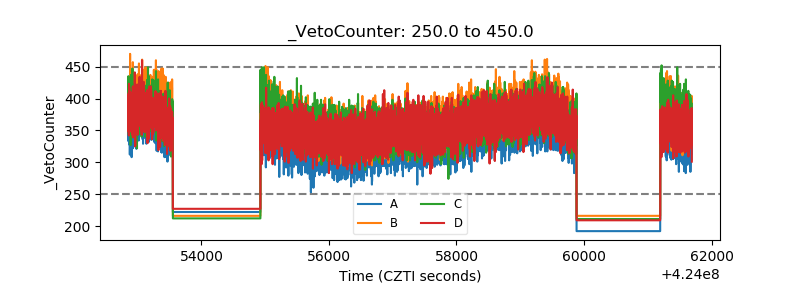 |