| Param | Original file | Final file |
|---|---|---|
| Filename | modeM0/AS1A12_035T02_9000005680_41629cztM0_level2.fits | modeM0/AS1A12_035T02_9000005680_41629cztM0_level2_quad_clean.evt |
| Size (bytes) | 671,132,160 | 160,064,640 |
| Size | 640.0 MB | 152.6 MB |
| Events in quadrant A | 5,185,839 | 1,084,961 |
| Events in quadrant B | 4,922,566 | 1,104,906 |
| Events in quadrant C | 5,354,421 | 1,056,122 |
| Events in quadrant D | 8,604,652 | 907,853 |
| Mode SS | |||
|---|---|---|---|
| Quadrant | BADHDUFLAG | Total packets | Discarded packets |
| A | 0 | 202 | 0 |
| B | 0 | 202 | 0 |
| C | 0 | 202 | 0 |
| D | 0 | 202 | 0 |
| Mode M0 | |||
|---|---|---|---|
| Quadrant | BADHDUFLAG | Total packets | Discarded packets |
| A | 0 | 21079 | 2 |
| B | 0 | 21535 | 2 |
| C | 0 | 22119 | 2 |
| D | 0 | 32427 | 2 |
| Mode M9 | |||
|---|---|---|---|
| Quadrant | BADHDUFLAG | Total packets | Discarded packets |
| A | 0 | 32 | 0 |
| B | 0 | 32 | 0 |
| C | 0 | 32 | 0 |
| D | 0 | 32 | 0 |
| Quadrant | Total seconds | Saturated seconds | Saturation percentage |
|---|---|---|---|
| A | 10000 | 16 | 0.160000% |
| B | 10001 | 73 | 0.729927% |
| C | 10001 | 137 | 1.369863% |
| D | 10000 | 983 | 9.830000% |
Noise dominated data is calculated using 1-second bins in cleaned event files. If a bin has >2000 counts, and if more than 50% of those come from <1% of pixels, then it is considered to be noise-dominated and hence unusable.
| Quadrant | # 1 sec bins | Bins with >0 counts | Bins with >2000 counts | High rate bins dominated by noise | Noise dominated (total time) | Noise dominated (detector-on time) | Marked lightcurve |
|---|---|---|---|---|---|---|---|
| A | 13167 | 10002 | 3 | 3 | 0.02% | 0.03% | 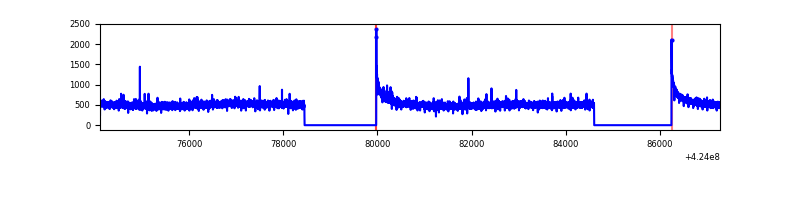 |
| B | 13168 | 10003 | 47 | 47 | 0.36% | 0.47% | 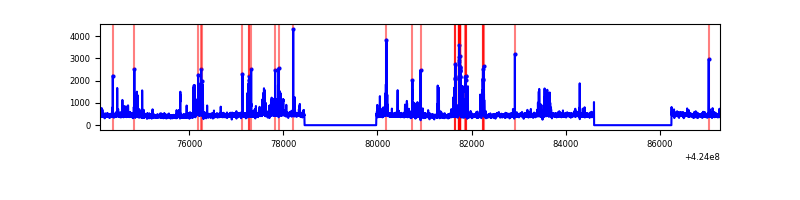 |
| C | 13168 | 10003 | 115 | 115 | 0.87% | 1.15% | 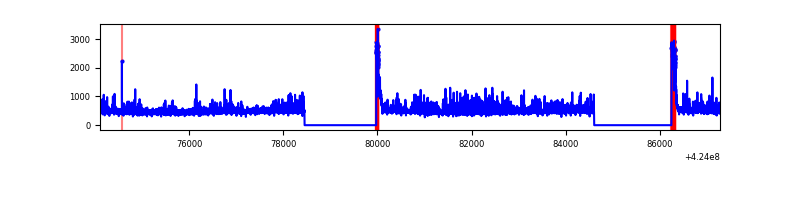 |
| D | 13167 | 10002 | 829 | 829 | 6.30% | 8.29% | 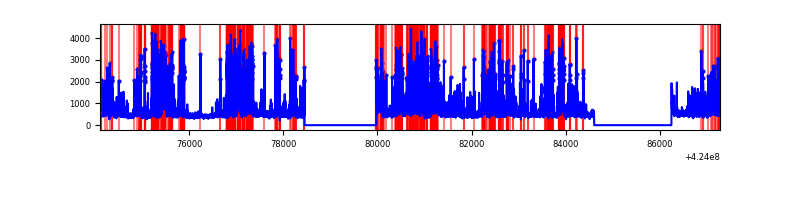 |
Top three noisy pixels from each quadrant. If the there are fewer than three noisy pixels in the level2.evt file, extra rows are filled as -1
| Pixel properties | Quadrant properties | ||||||
|---|---|---|---|---|---|---|---|
| Quadrant | DetID | PixID | Counts | Sigma | Mean | Median | Sigma |
| A | 10 | 83 | 835866 | 3645.19 | 1114 | 1091 | 229.0 |
| A | 13 | 254 | 17732 | 72.67 | 1114 | 1091 | 229.0 |
| A | 2 | 79 | 17526 | 71.77 | 1114 | 1091 | 229.0 |
| B | 5 | 255 | 307824 | 1453.25 | 1094 | 1063 | 211.1 |
| B | 0 | 186 | 261478 | 1233.69 | 1094 | 1063 | 211.1 |
| B | 12 | 111 | 27425 | 124.89 | 1094 | 1063 | 211.1 |
| C | 15 | 214 | 433596 | 1735.7 | 1072 | 1076 | 249.2 |
| C | 0 | 10 | 367909 | 1472.1 | 1072 | 1076 | 249.2 |
| C | 0 | 15 | 365144 | 1461.0 | 1072 | 1076 | 249.2 |
| D | 12 | 79 | 2150322 | 8447.23 | 1042 | 1013 | 254.4 |
| D | 13 | 249 | 1496146 | 5876.18 | 1042 | 1013 | 254.4 |
| D | 1 | 47 | 464649 | 1822.19 | 1042 | 1013 | 254.4 |
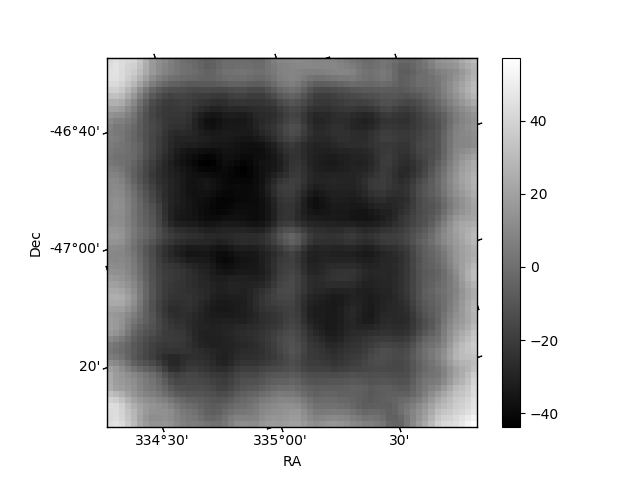
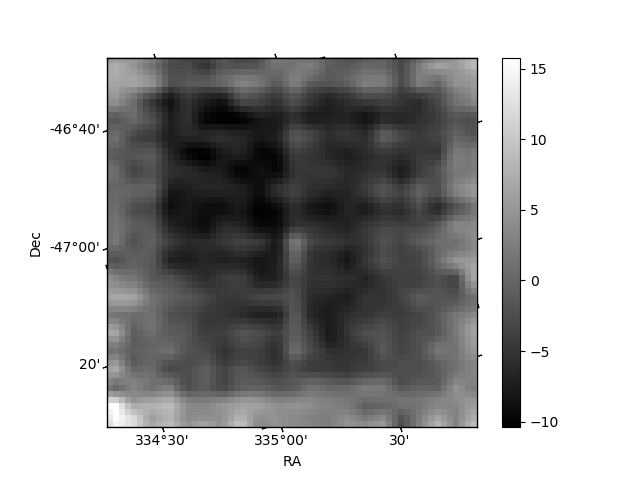
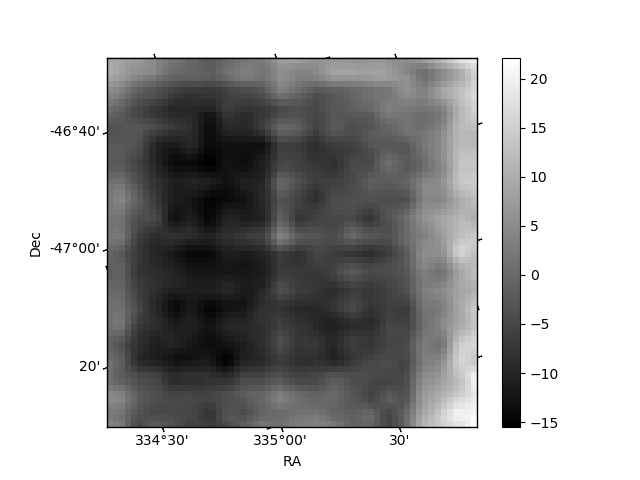
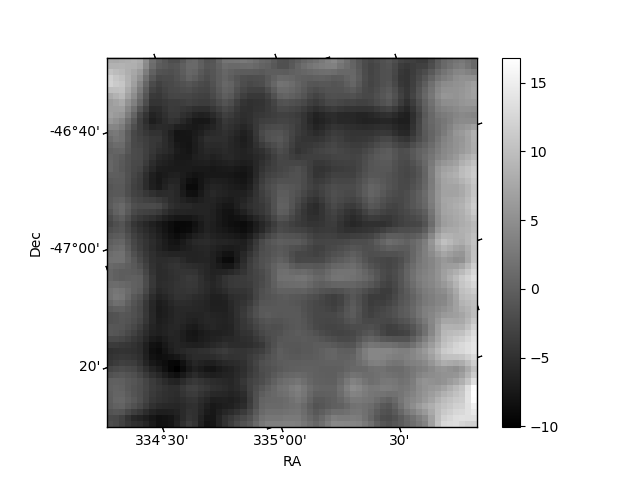
Histogram calculated using DETX and DETY for each event in the final _common_clean file
| Quadrant A | 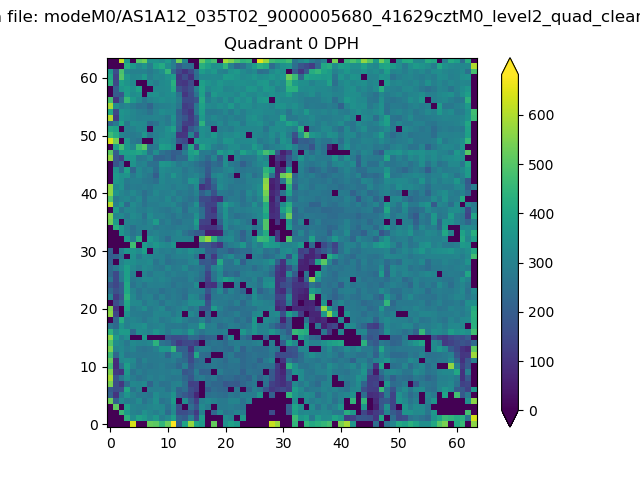 |
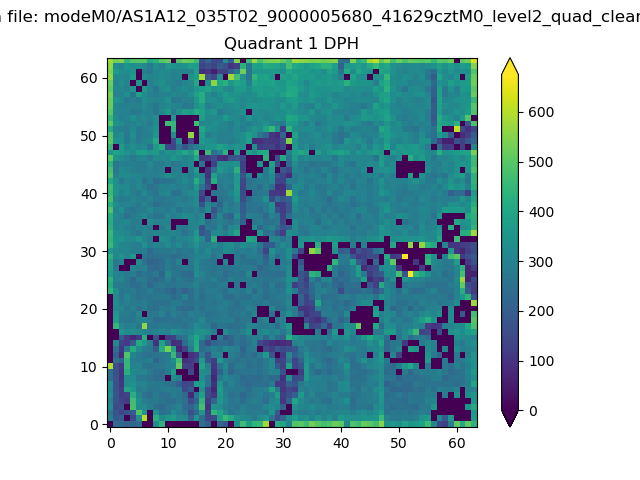 |
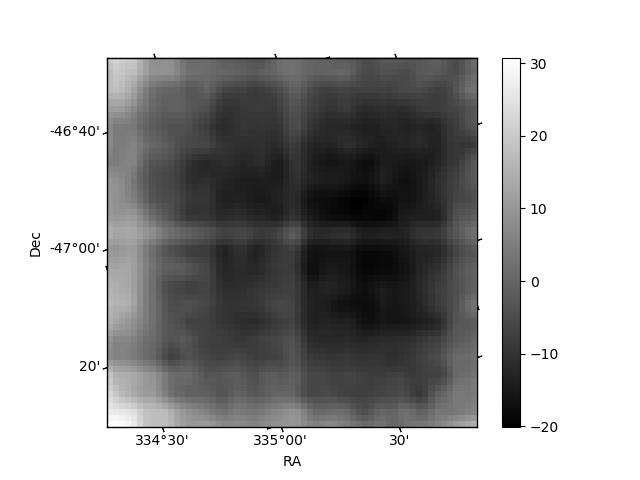
Quadrant B |
|---|---|---|---|
| Quadrant D | 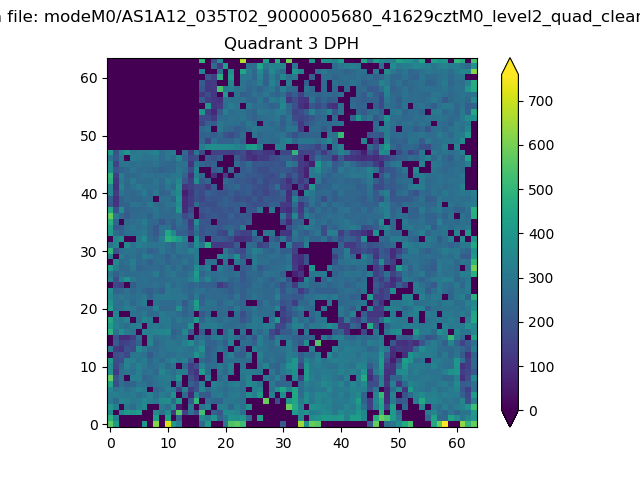 |
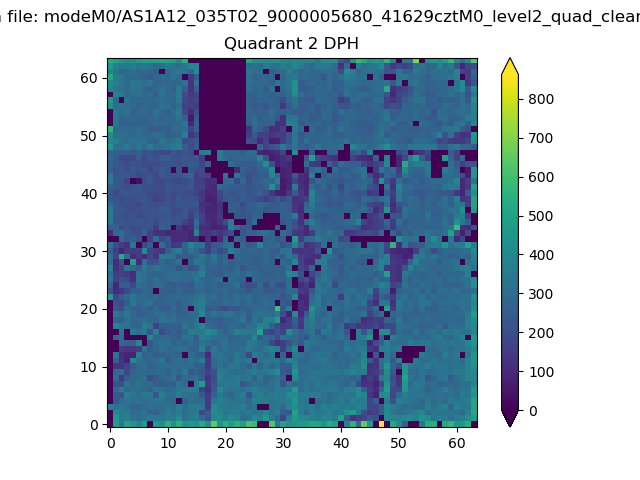 |
Quadrant C |
| Plot type | Count rate plots | Images |
|---|---|---|
| Comparison with Poisson distribution Blue bars denote a histogram of data divided into 1 sec bins. Red curve is a Poisson curve with rate = median count rate of data. |
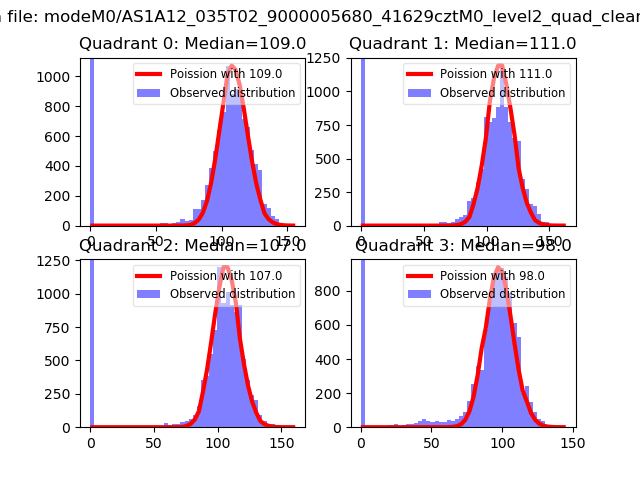 |
 |
| Quadrant-wise count rates Data is divided into 100 sec bins |
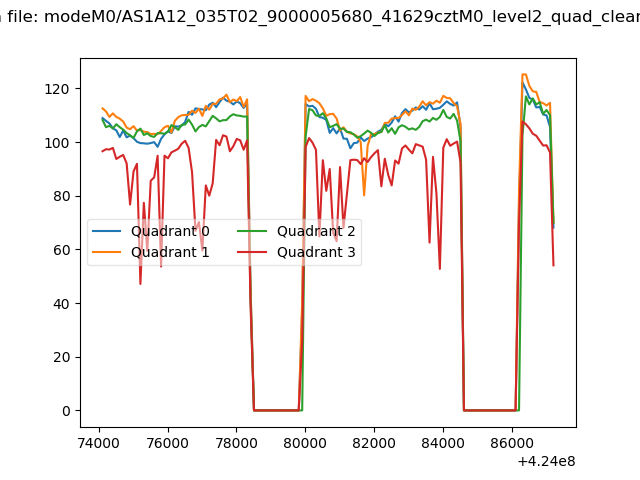 |
|
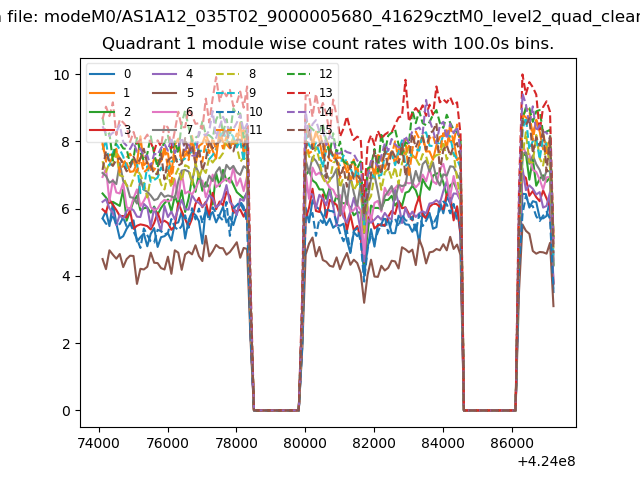
| Module-wise count rates for Quadrant A Data is divided into 100 sec bins |
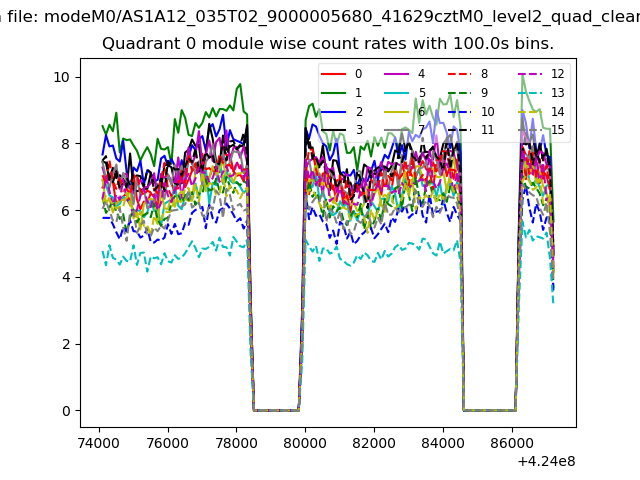 |
 |
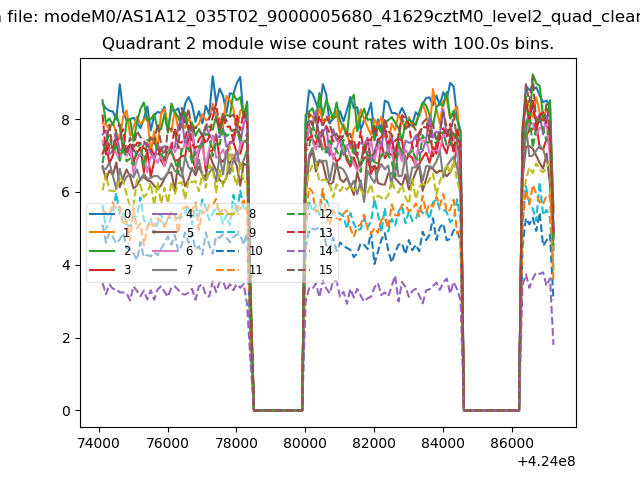
| Module-wise count rates for Quadrant B Data is divided into 100 sec bins |
 |
 |
| Module-wise count rates for Quadrant C Data is divided into 100 sec bins |
 |
 |
| Module-wise count rates for Quadrant D Data is divided into 100 sec bins |
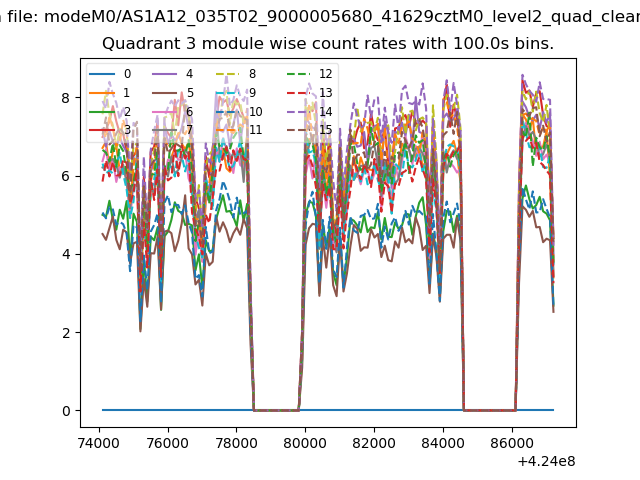 |
 |
| Parameter | Plot |
|---|---|
| CZT HV Monitor | 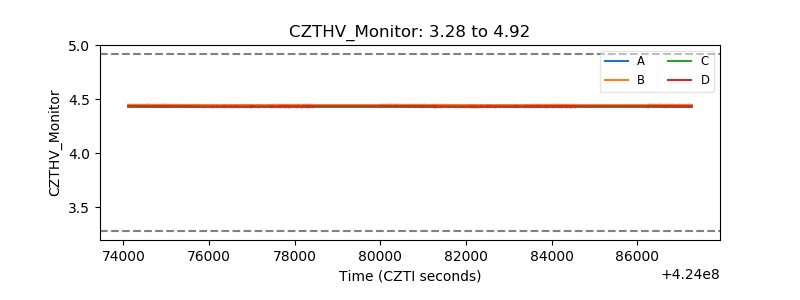 |
| D_VDD | 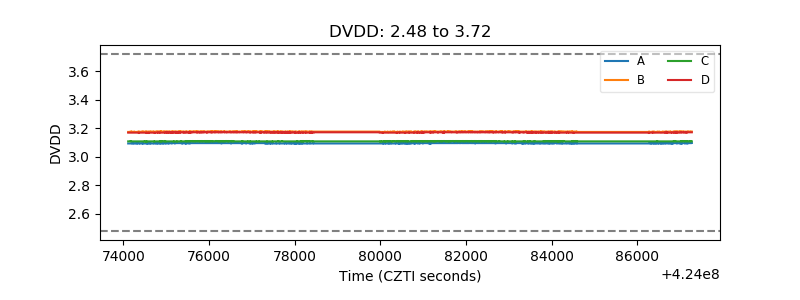 |
| Temperature 1 | 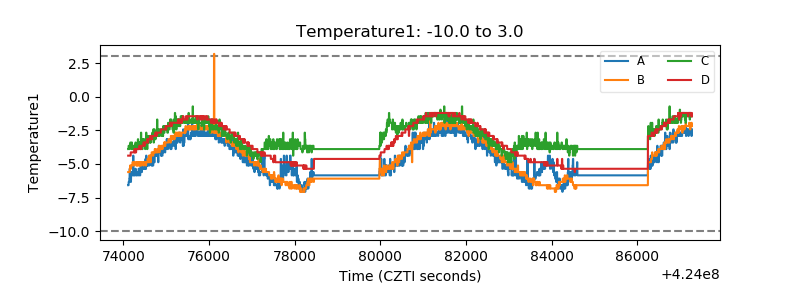 |
| Veto HV Monitor | 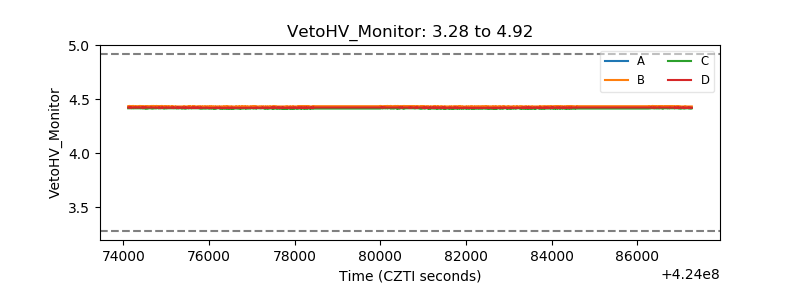 |
| Veto LLD | 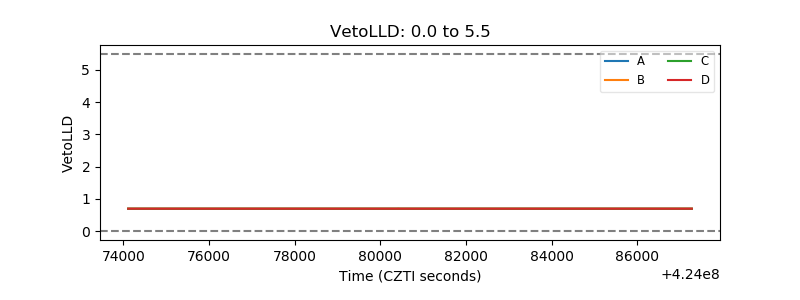 |
| Alpha Counter | 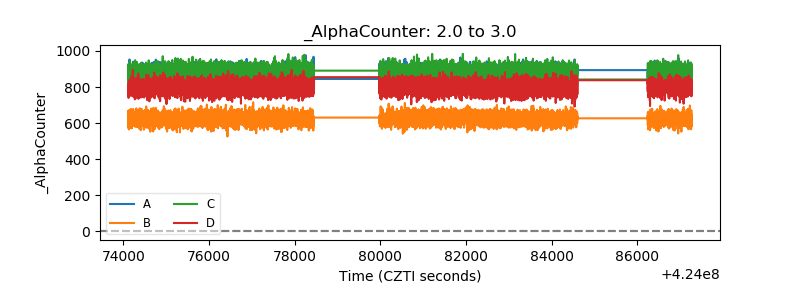 |
| _CPM_Rate | 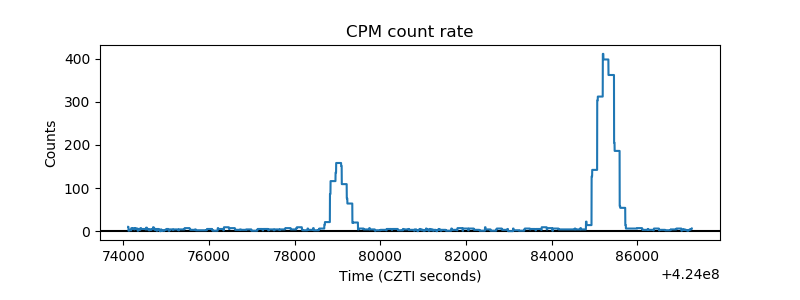 |
| CZT Counter | 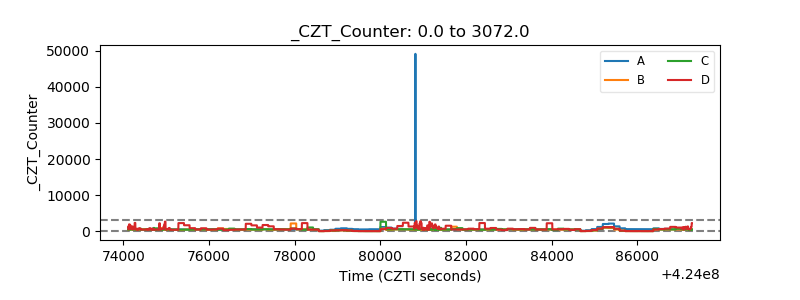 |
| +2.5 Volts monitor | 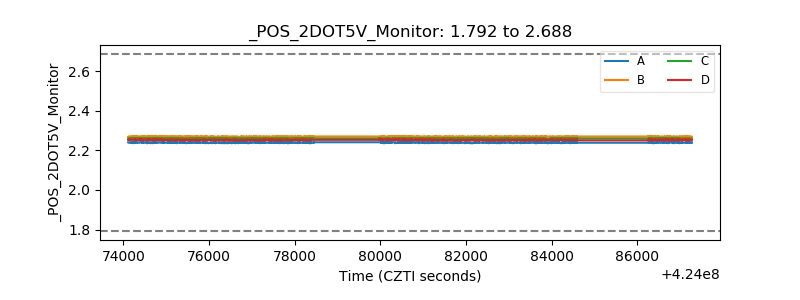 |
| +5 Volts monitor | 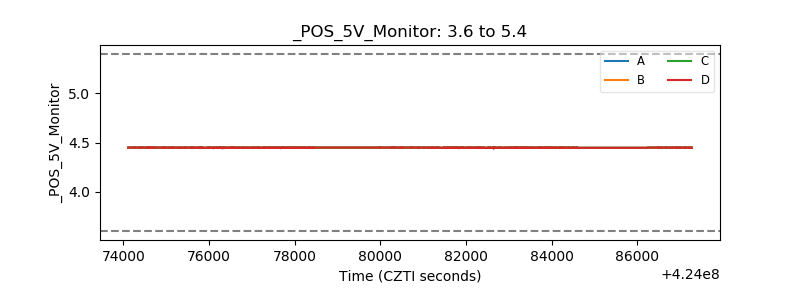 |
| _ROLL_ROT | 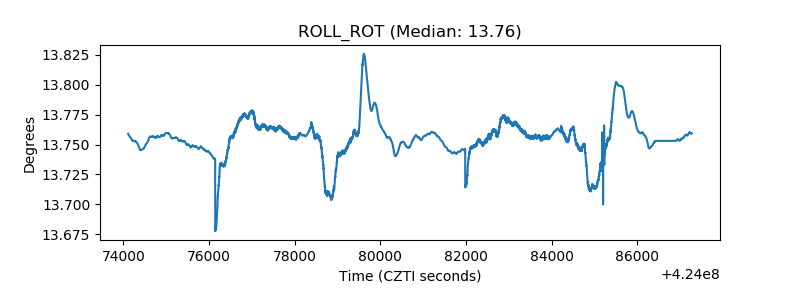 |
| _Roll_DEC | 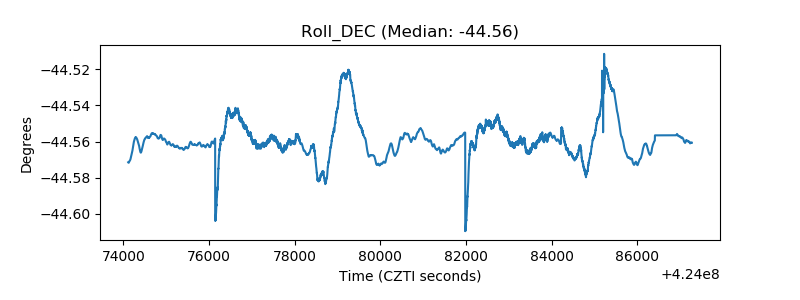 |
| _Roll_RA | 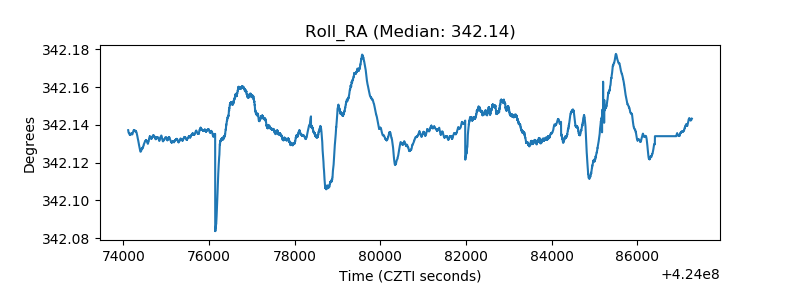 |
| Veto Counter | 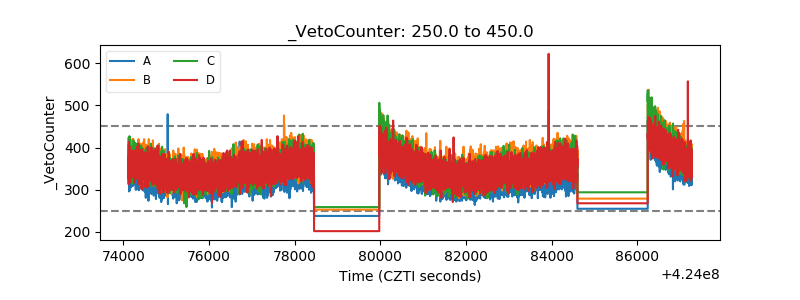 |