| Param | Original file | Final file |
|---|---|---|
| Filename | modeM0/AS1A12_035T02_9000005680_41631cztM0_level2.fits | modeM0/AS1A12_035T02_9000005680_41631cztM0_level2_quad_clean.evt |
| Size (bytes) | 410,068,800 | 91,523,520 |
| Size | 391.1 MB | 87.3 MB |
| Events in quadrant A | 3,024,899 | 634,036 |
| Events in quadrant B | 3,017,580 | 644,247 |
| Events in quadrant C | 3,259,587 | 598,628 |
| Events in quadrant D | 5,445,099 | 505,800 |
| Mode SS | |||
|---|---|---|---|
| Quadrant | BADHDUFLAG | Total packets | Discarded packets |
| A | 0 | 112 | 0 |
| B | 0 | 112 | 0 |
| C | 0 | 112 | 0 |
| D | 0 | 112 | 0 |
| Mode M0 | |||
|---|---|---|---|
| Quadrant | BADHDUFLAG | Total packets | Discarded packets |
| A | 0 | 12225 | 2 |
| B | 0 | 12676 | 5 |
| C | 0 | 13137 | 2 |
| D | 0 | 19942 | 2 |
| Mode M9 | |||
|---|---|---|---|
| Quadrant | BADHDUFLAG | Total packets | Discarded packets |
| A | 0 | 22 | 0 |
| B | 0 | 23 | 0 |
| C | 0 | 23 | 0 |
| D | 0 | 23 | 0 |
| Quadrant | Total seconds | Saturated seconds | Saturation percentage |
|---|---|---|---|
| A | 5559 | 18 | 0.323799% |
| B | 5558 | 59 | 1.061533% |
| C | 5558 | 177 | 3.184599% |
| D | 5558 | 795 | 14.303706% |
Noise dominated data is calculated using 1-second bins in cleaned event files. If a bin has >2000 counts, and if more than 50% of those come from <1% of pixels, then it is considered to be noise-dominated and hence unusable.
| Quadrant | # 1 sec bins | Bins with >0 counts | Bins with >2000 counts | High rate bins dominated by noise | Noise dominated (total time) | Noise dominated (detector-on time) | Marked lightcurve |
|---|---|---|---|---|---|---|---|
| A | 7352 | 5560 | 2 | 2 | 0.03% | 0.04% | 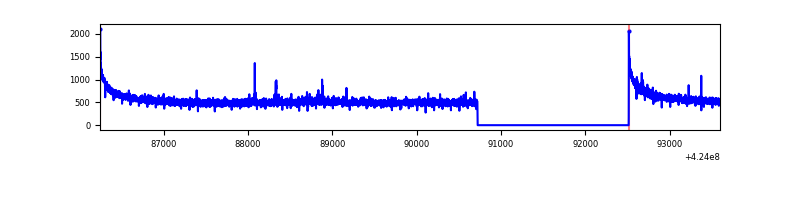 |
| B | 7351 | 5559 | 30 | 30 | 0.41% | 0.54% | 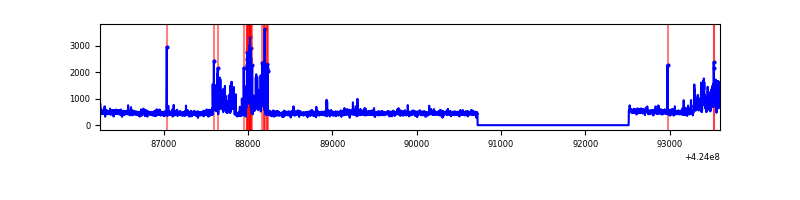 |
| C | 7351 | 5559 | 163 | 163 | 2.22% | 2.93% | 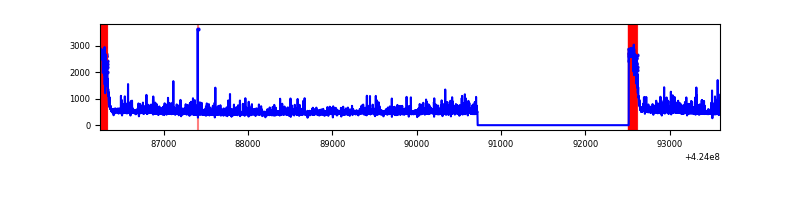 |
| D | 7350 | 5558 | 708 | 708 | 9.63% | 12.74% | 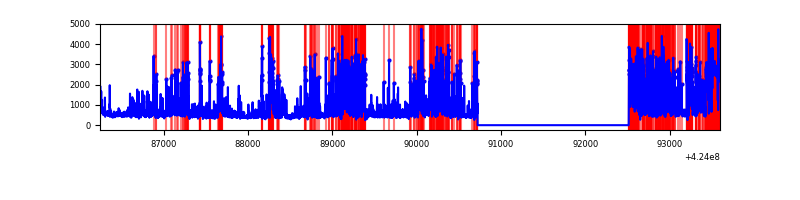 |
Top three noisy pixels from each quadrant. If the there are fewer than three noisy pixels in the level2.evt file, extra rows are filled as -1
| Pixel properties | Quadrant properties | ||||||
|---|---|---|---|---|---|---|---|
| Quadrant | DetID | PixID | Counts | Sigma | Mean | Median | Sigma |
| A | 10 | 83 | 549680 | 4261.93 | 631 | 618 | 128.8 |
| A | 2 | 79 | 12356 | 91.11 | 631 | 618 | 128.8 |
| A | 13 | 254 | 9420 | 68.32 | 631 | 618 | 128.8 |
| B | 0 | 186 | 498343 | 4157.89 | 621 | 604 | 119.7 |
| B | 5 | 255 | 28043 | 229.21 | 621 | 604 | 119.7 |
| B | 0 | 190 | 25013 | 203.9 | 621 | 604 | 119.7 |
| C | 0 | 10 | 457504 | 3268.8 | 599 | 602 | 139.8 |
| C | 15 | 214 | 241836 | 1725.86 | 599 | 602 | 139.8 |
| C | 0 | 15 | 220204 | 1571.09 | 599 | 602 | 139.8 |
| D | 12 | 79 | 1695770 | 12007.8 | 575 | 557 | 141.2 |
| D | 13 | 249 | 633727 | 4484.97 | 575 | 557 | 141.2 |
| D | 1 | 47 | 348898 | 2467.42 | 575 | 557 | 141.2 |
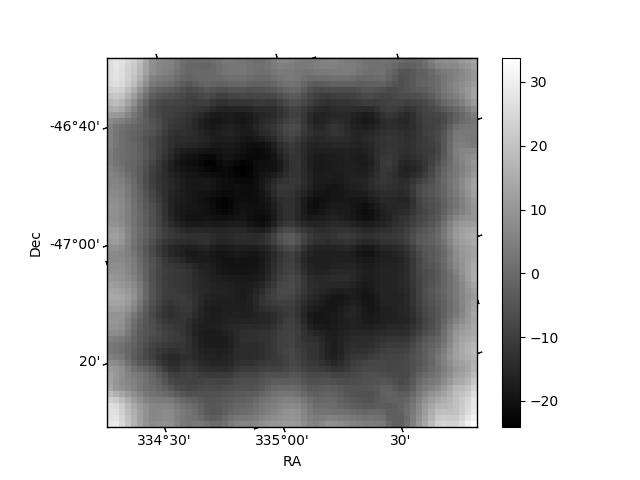
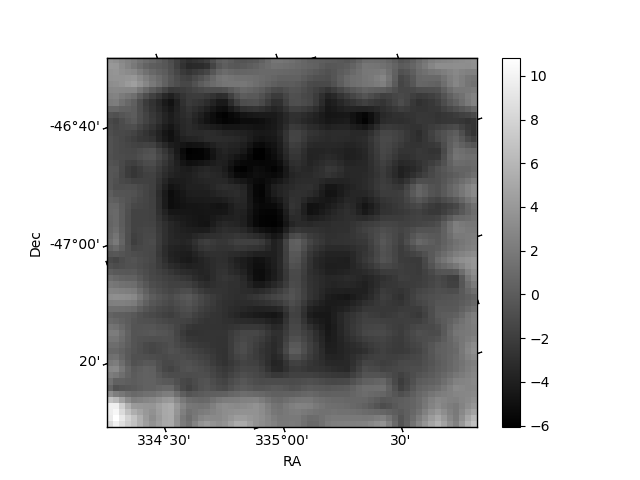
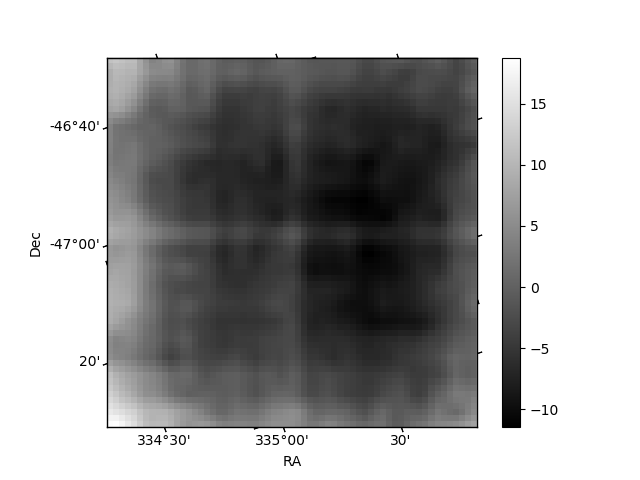
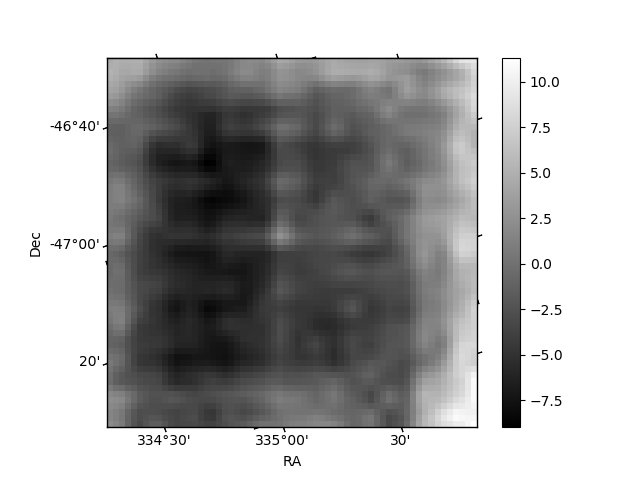
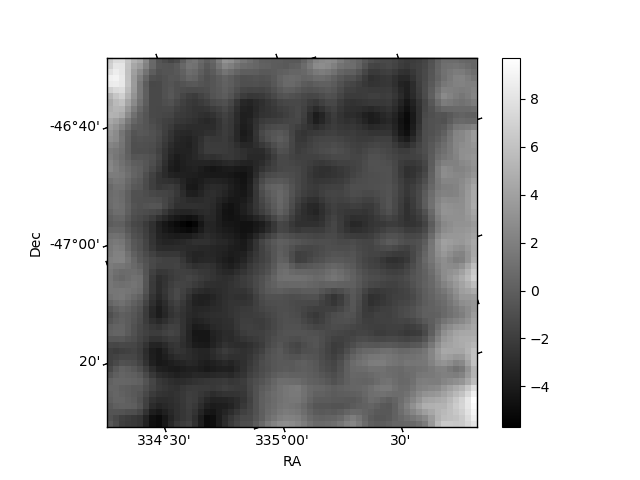
Histogram calculated using DETX and DETY for each event in the final _common_clean file
| Quadrant A | 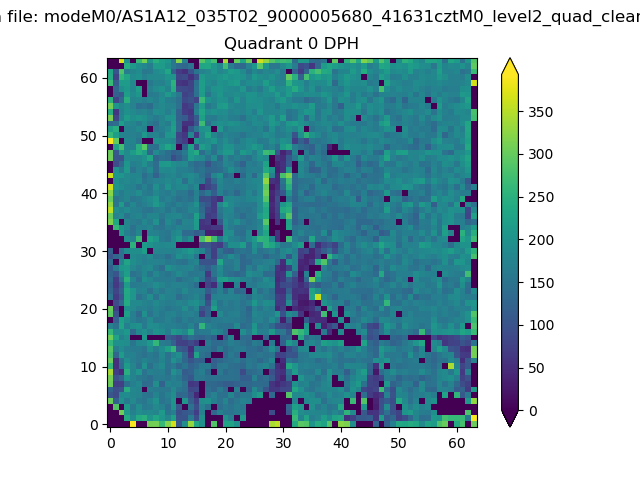 |
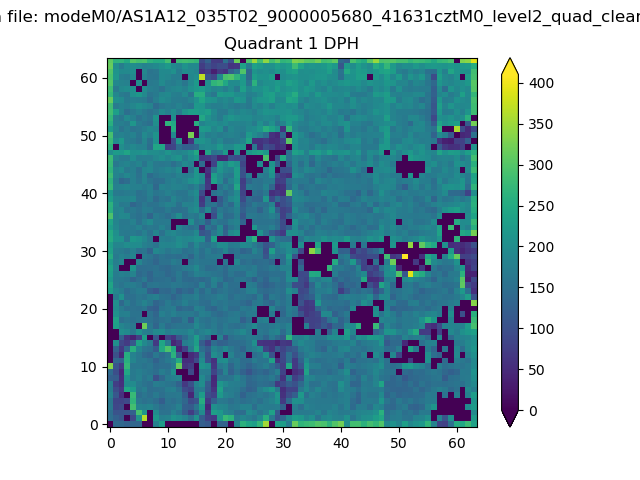 |
Quadrant B |
|---|---|---|---|
| Quadrant D | 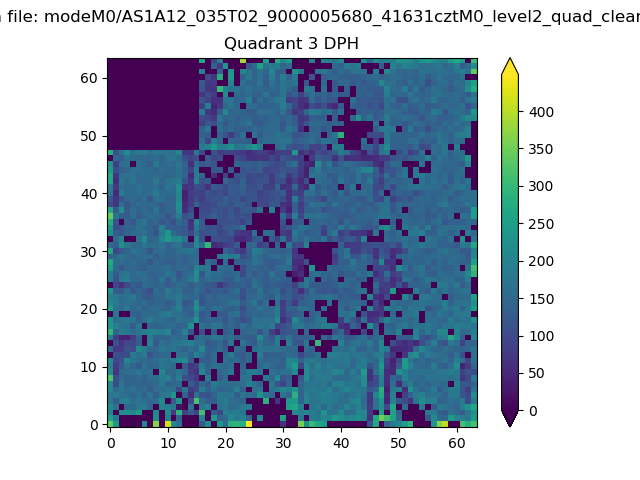 |
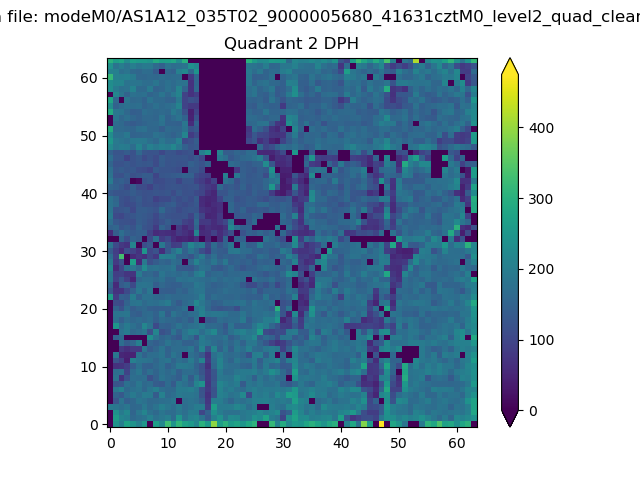 |
Quadrant C |
| Plot type | Count rate plots | Images |
|---|---|---|
| Comparison with Poisson distribution Blue bars denote a histogram of data divided into 1 sec bins. Red curve is a Poisson curve with rate = median count rate of data. |
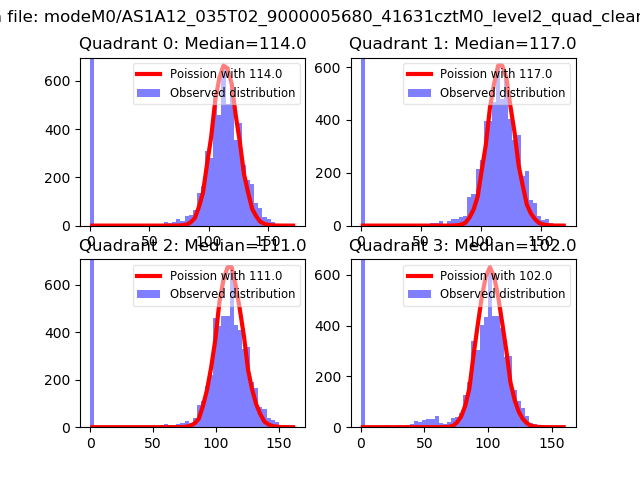 |
 |
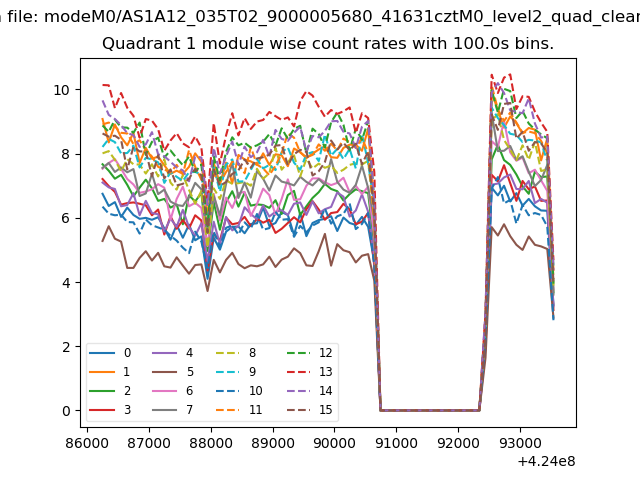
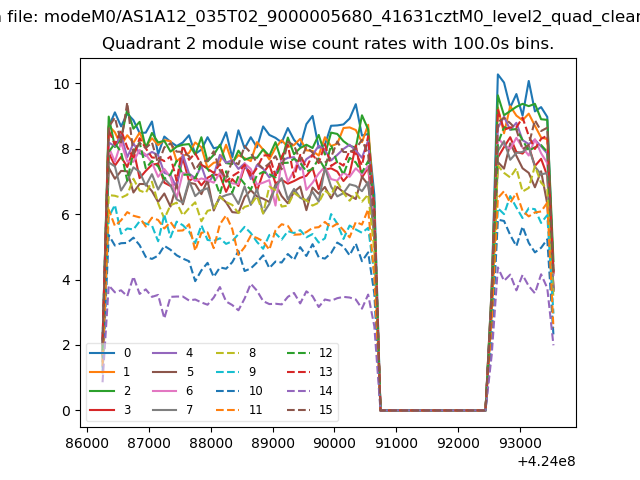
| Quadrant-wise count rates Data is divided into 100 sec bins |
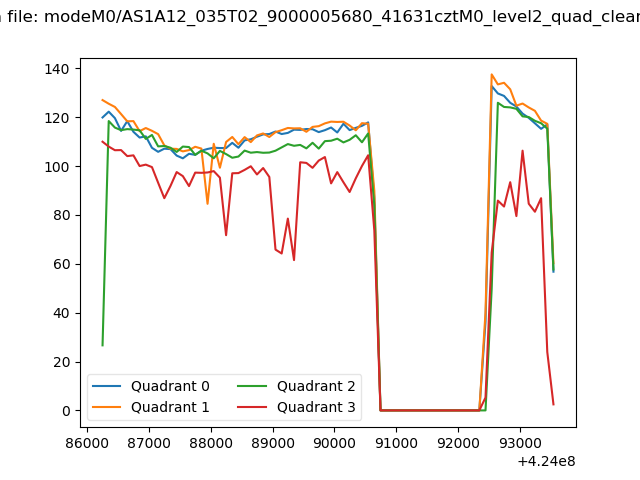 |
|
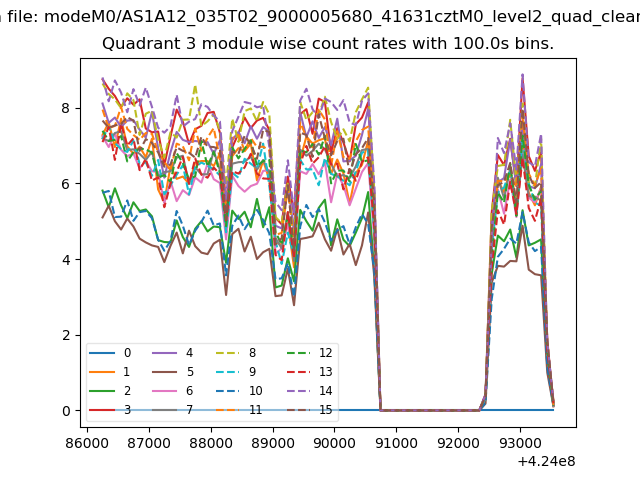
| Module-wise count rates for Quadrant A Data is divided into 100 sec bins |
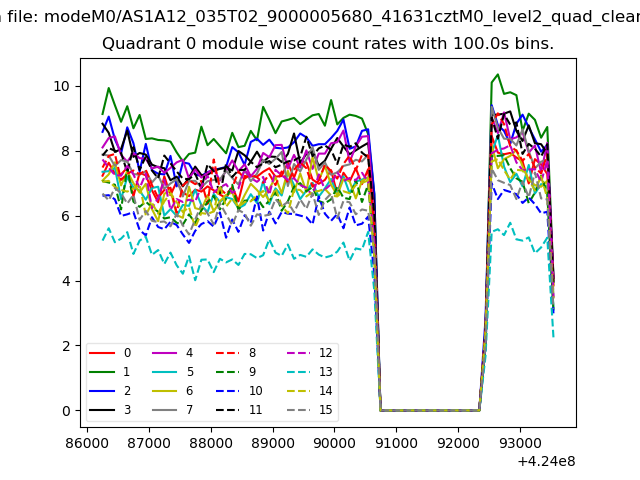 |
 |
| Module-wise count rates for Quadrant B Data is divided into 100 sec bins |
 |
 |
| Module-wise count rates for Quadrant C Data is divided into 100 sec bins |
 |
 |
| Module-wise count rates for Quadrant D Data is divided into 100 sec bins |
 |
 |
| Parameter | Plot |
|---|---|
| CZT HV Monitor | 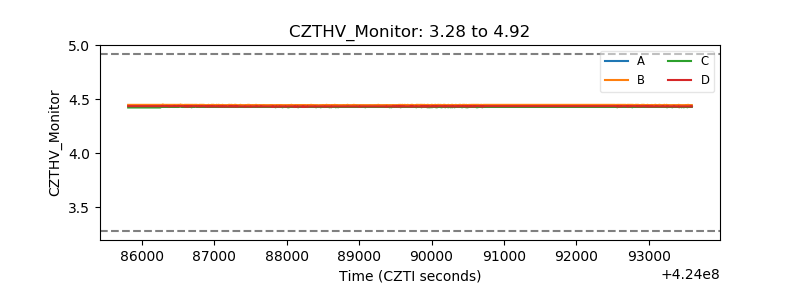 |
| D_VDD | 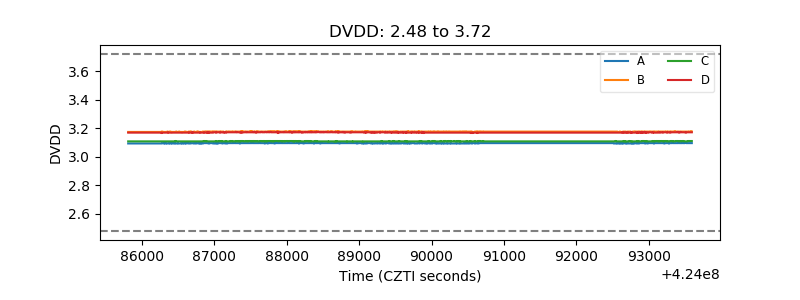 |
| Temperature 1 | 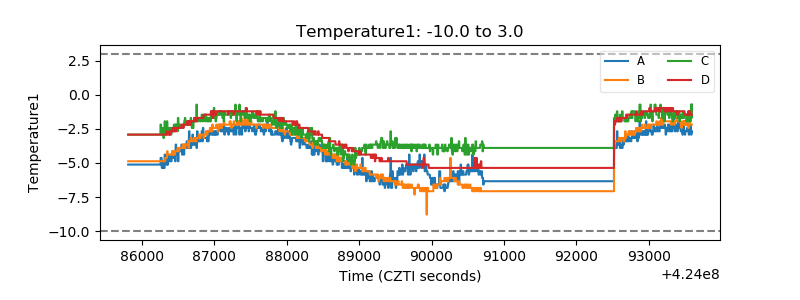 |
| Veto HV Monitor |  |
| Veto LLD | 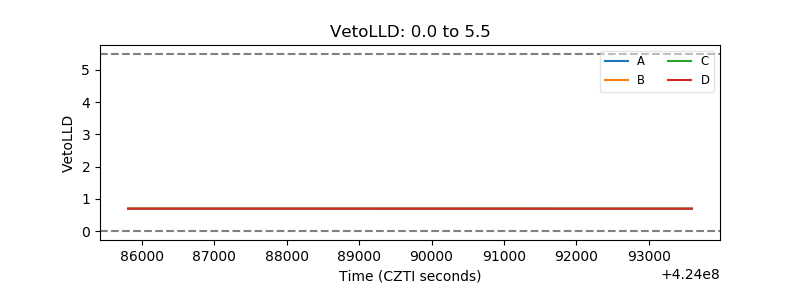 |
| Alpha Counter | 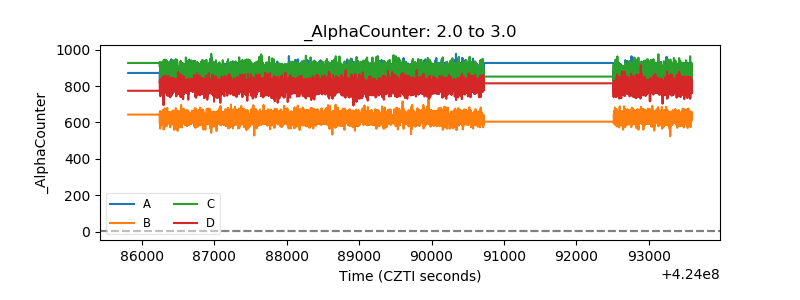 |
| _CPM_Rate | 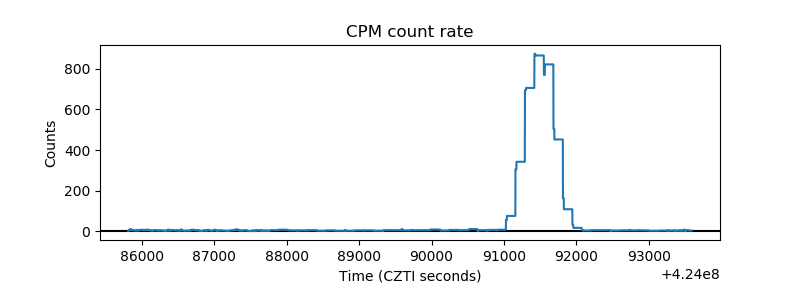 |
| CZT Counter | 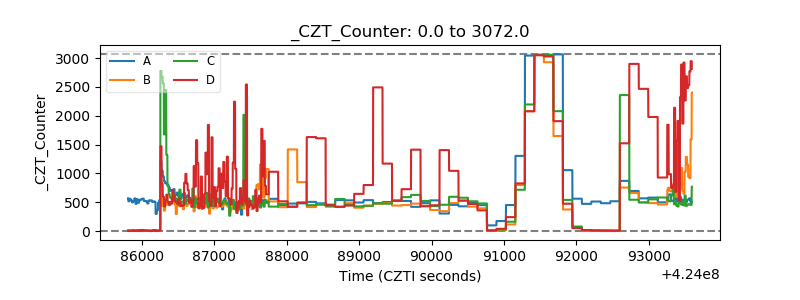 |
| +2.5 Volts monitor | 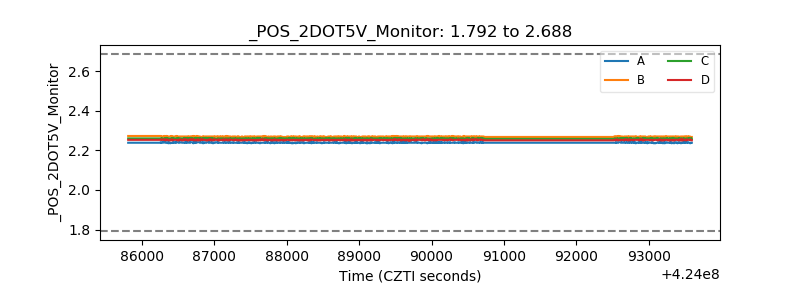 |
| +5 Volts monitor | 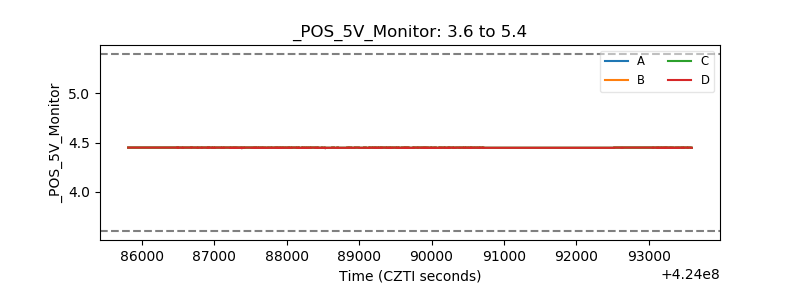 |
| _ROLL_ROT | 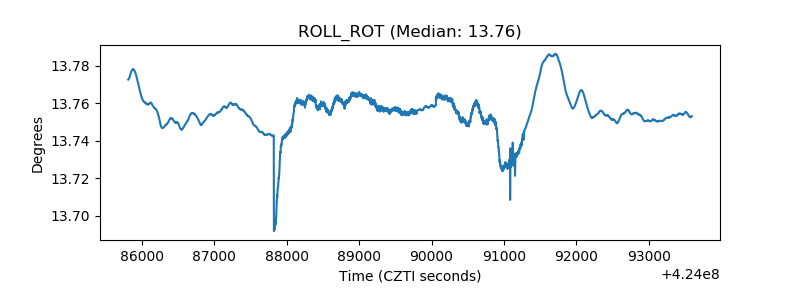 |
| _Roll_DEC | 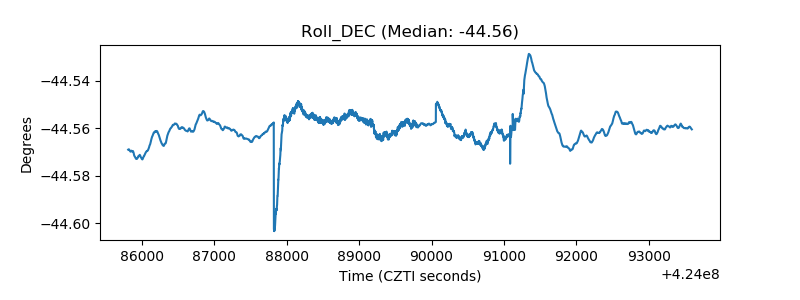 |
| _Roll_RA | 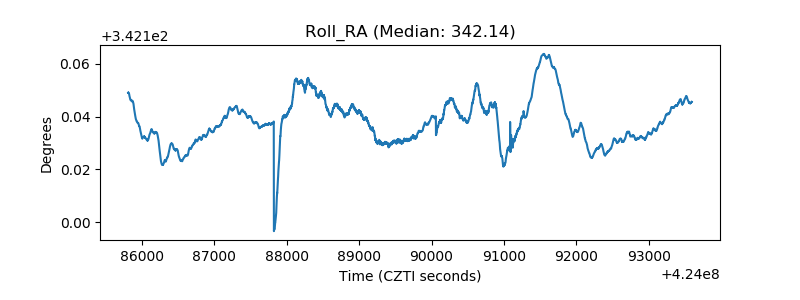 |
| Veto Counter | 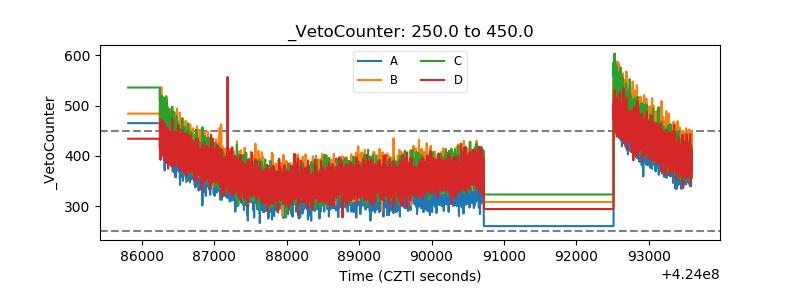 |