| Param | Original file | Final file |
|---|---|---|
| Filename | modeM0/AS1A12_035T02_9000005680_41632cztM0_level2.fits | modeM0/AS1A12_035T02_9000005680_41632cztM0_level2_quad_clean.evt |
| Size (bytes) | 512,962,560 | 88,508,160 |
| Size | 489.2 MB | 84.4 MB |
| Events in quadrant A | 2,983,753 | 653,412 |
| Events in quadrant B | 3,805,481 | 641,489 |
| Events in quadrant C | 3,749,175 | 592,334 |
| Events in quadrant D | 8,031,508 | 415,563 |
| Mode SS | |||
|---|---|---|---|
| Quadrant | BADHDUFLAG | Total packets | Discarded packets |
| A | 0 | 110 | 0 |
| B | 0 | 110 | 0 |
| C | 0 | 110 | 0 |
| D | 0 | 110 | 0 |
| Mode M0 | |||
|---|---|---|---|
| Quadrant | BADHDUFLAG | Total packets | Discarded packets |
| A | 0 | 12052 | 2 |
| B | 0 | 14816 | 2 |
| C | 0 | 14485 | 2 |
| D | 0 | 27519 | 2 |
| Mode M9 | |||
|---|---|---|---|
| Quadrant | BADHDUFLAG | Total packets | Discarded packets |
| A | 0 | 19 | 0 |
| B | 0 | 19 | 0 |
| C | 0 | 19 | 0 |
| D | 0 | 19 | 0 |
| Quadrant | Total seconds | Saturated seconds | Saturation percentage |
|---|---|---|---|
| A | 5385 | 15 | 0.278552% |
| B | 5385 | 306 | 5.682451% |
| C | 5385 | 360 | 6.685237% |
| D | 5385 | 1890 | 35.097493% |
Noise dominated data is calculated using 1-second bins in cleaned event files. If a bin has >2000 counts, and if more than 50% of those come from <1% of pixels, then it is considered to be noise-dominated and hence unusable.
| Quadrant | # 1 sec bins | Bins with >0 counts | Bins with >2000 counts | High rate bins dominated by noise | Noise dominated (total time) | Noise dominated (detector-on time) | Marked lightcurve |
|---|---|---|---|---|---|---|---|
| A | 7267 | 5386 | 1 | 1 | 0.01% | 0.02% | 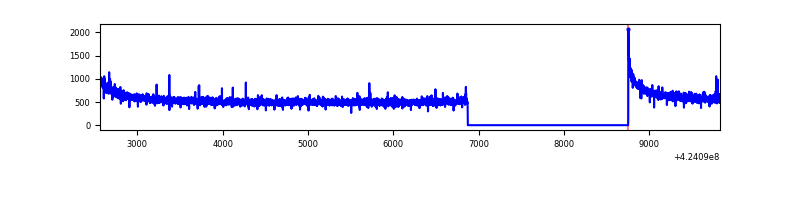 |
| B | 7267 | 5386 | 183 | 183 | 2.52% | 3.40% | 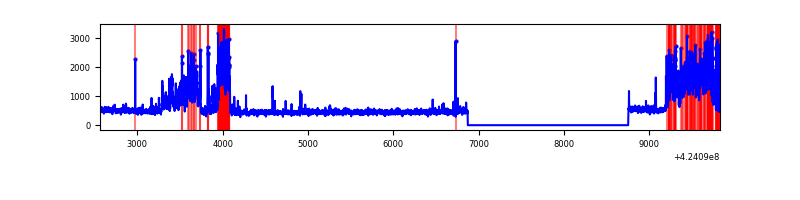 |
| C | 7267 | 5386 | 327 | 327 | 4.50% | 6.07% | 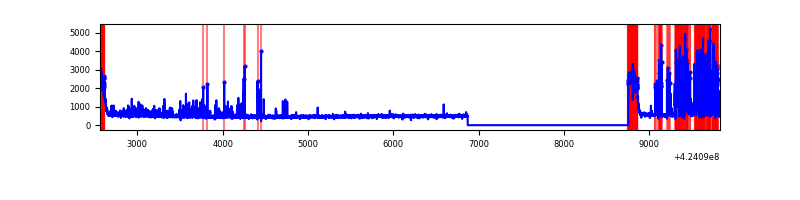 |
| D | 7267 | 5386 | 1688 | 1688 | 23.23% | 31.34% | 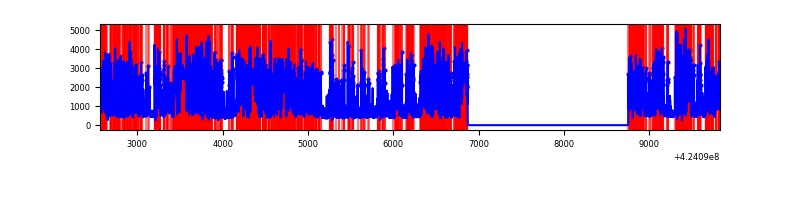 |
Top three noisy pixels from each quadrant. If the there are fewer than three noisy pixels in the level2.evt file, extra rows are filled as -1
| Pixel properties | Quadrant properties | ||||||
|---|---|---|---|---|---|---|---|
| Quadrant | DetID | PixID | Counts | Sigma | Mean | Median | Sigma |
| A | 10 | 83 | 516796 | 4020.88 | 631 | 619 | 128.4 |
| A | 13 | 248 | 13479 | 100.18 | 631 | 619 | 128.4 |
| A | 13 | 254 | 9753 | 71.15 | 631 | 619 | 128.4 |
| B | 0 | 186 | 1289864 | 10948.06 | 617 | 601 | 117.8 |
| B | 5 | 255 | 35235 | 294.1 | 617 | 601 | 117.8 |
| B | 15 | 35 | 26557 | 220.41 | 617 | 601 | 117.8 |
| C | 0 | 15 | 838427 | 6120.68 | 588 | 593 | 136.9 |
| C | 0 | 10 | 391148 | 2853.14 | 588 | 593 | 136.9 |
| C | 15 | 214 | 229796 | 1674.41 | 588 | 593 | 136.9 |
| D | 12 | 79 | 5178905 | 40024.04 | 525 | 510 | 129.4 |
| D | 13 | 249 | 393481 | 3037.29 | 525 | 510 | 129.4 |
| D | 2 | 249 | 179598 | 1384.18 | 525 | 510 | 129.4 |
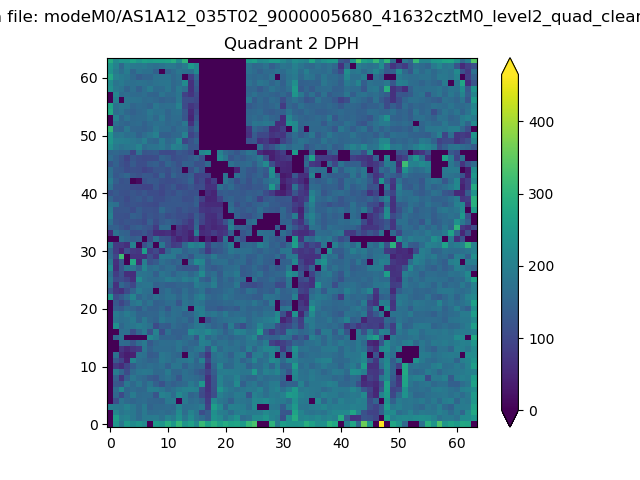
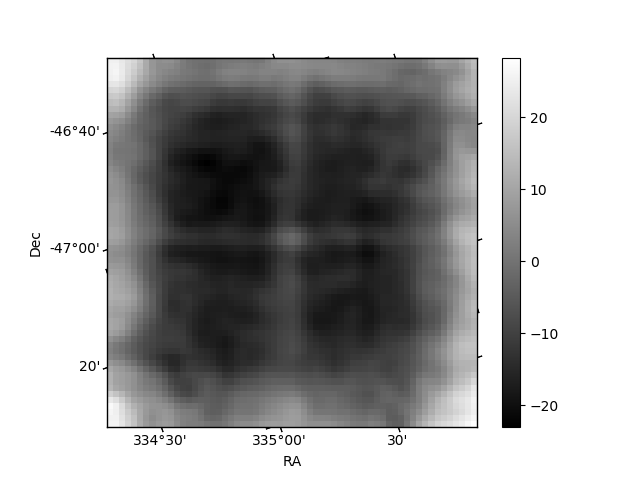
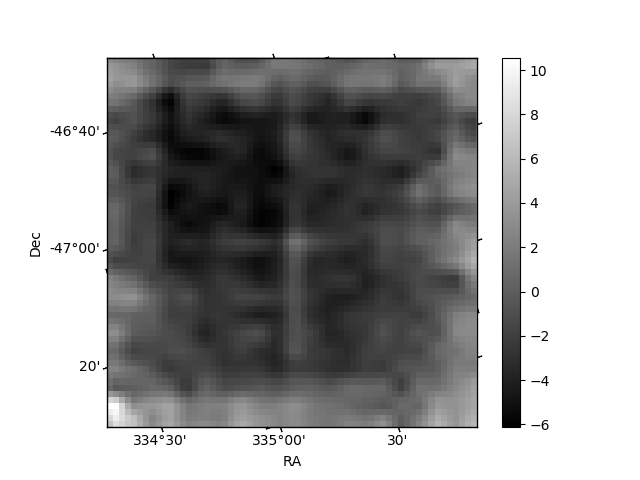
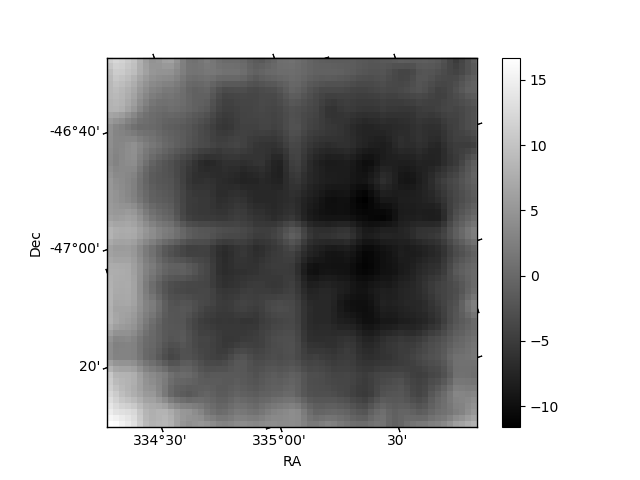
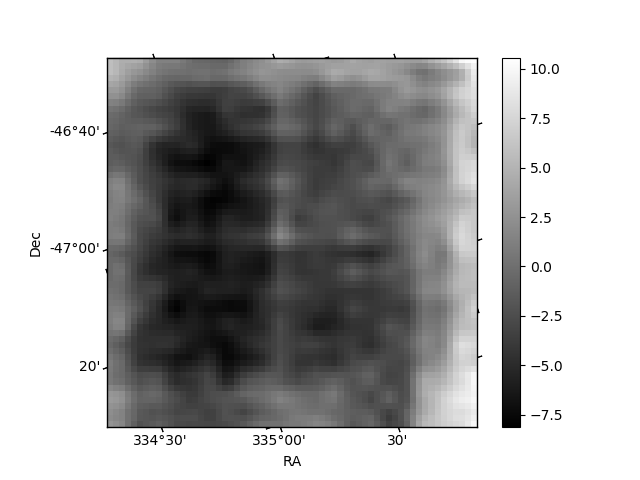
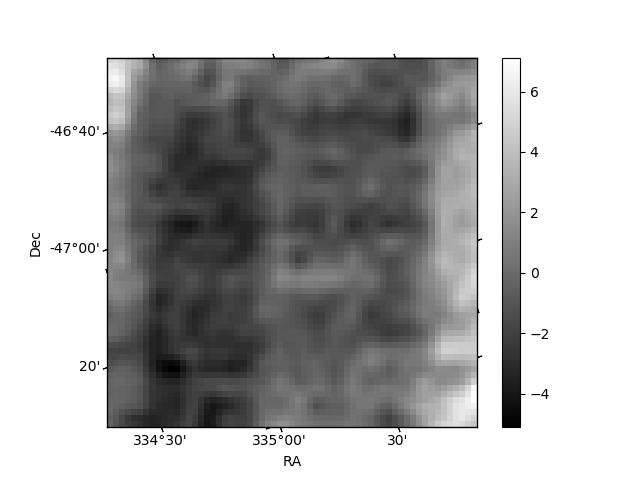
Histogram calculated using DETX and DETY for each event in the final _common_clean file
| Quadrant A | 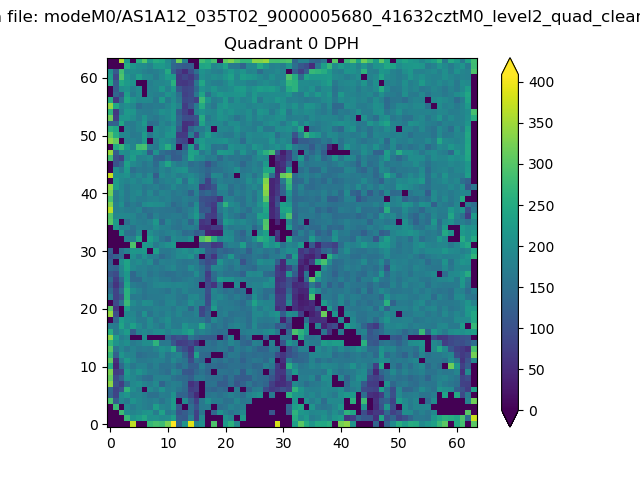 |
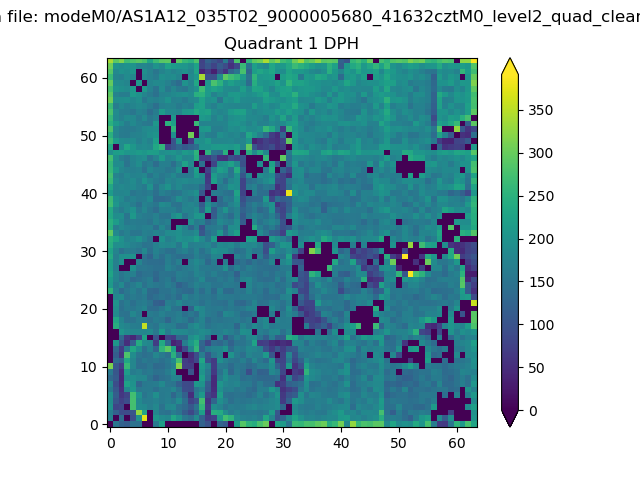 |
Quadrant B |
|---|---|---|---|
| Quadrant D | 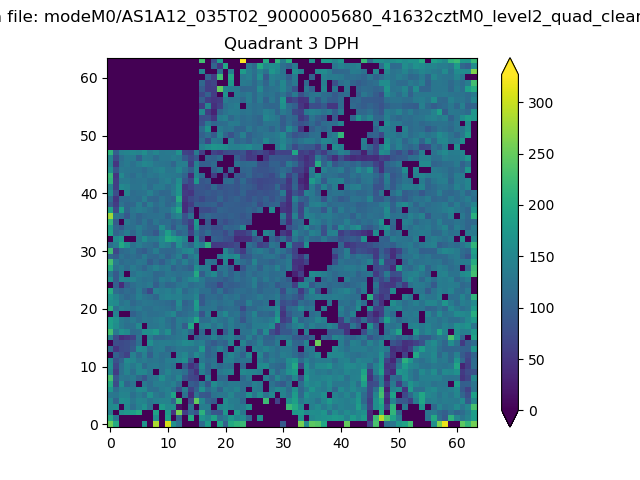 |
 |
Quadrant C |
| Plot type | Count rate plots | Images |
|---|---|---|
| Comparison with Poisson distribution Blue bars denote a histogram of data divided into 1 sec bins. Red curve is a Poisson curve with rate = median count rate of data. |
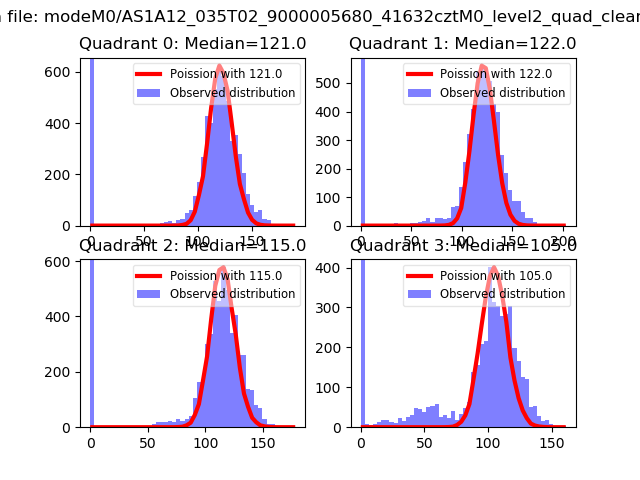 |
 |
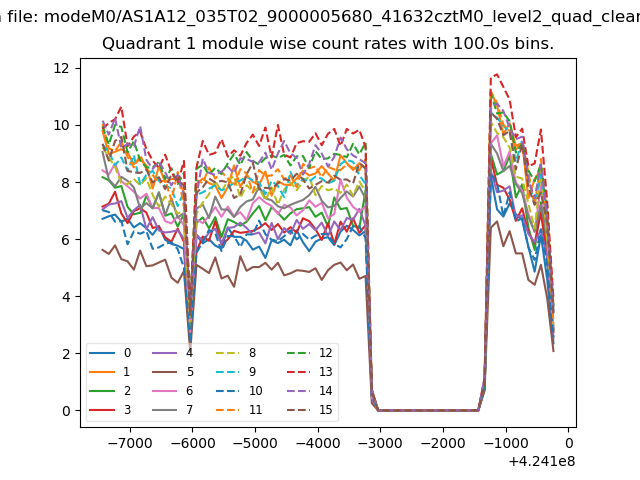
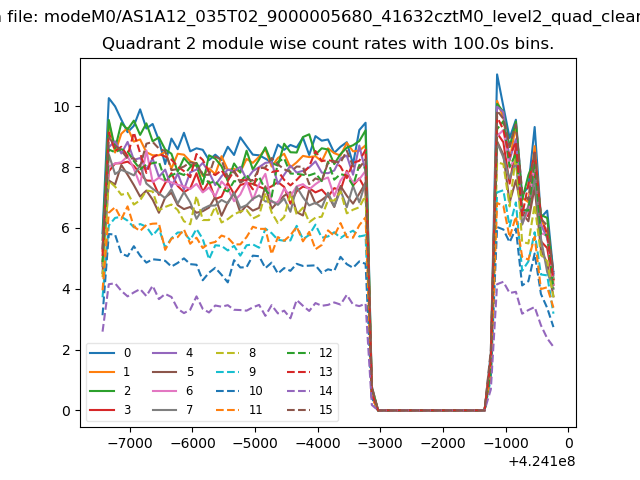
| Quadrant-wise count rates Data is divided into 100 sec bins |
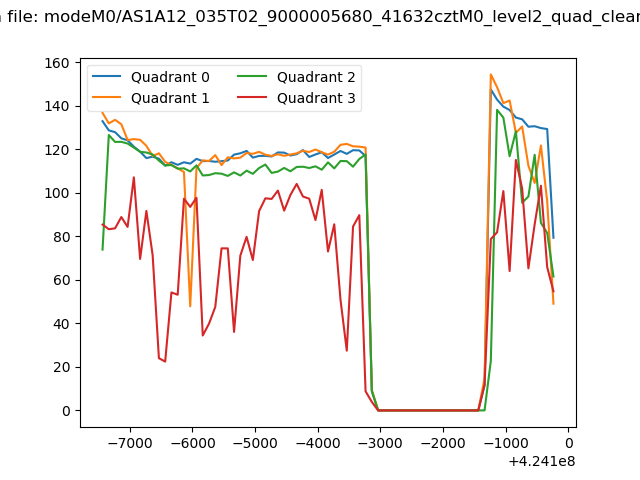 |
|
| Module-wise count rates for Quadrant A Data is divided into 100 sec bins |
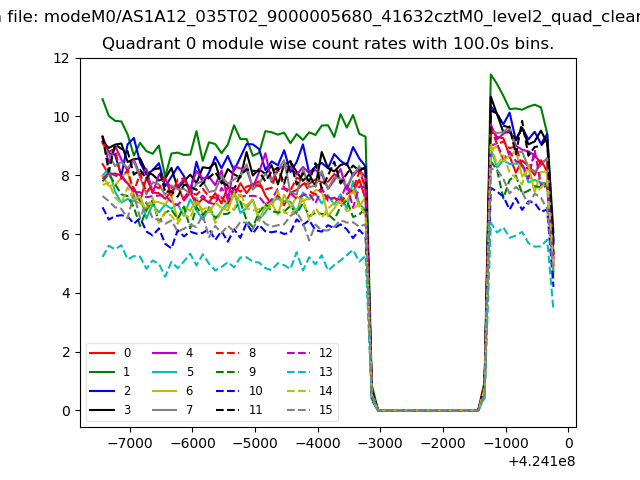 |
 |
| Module-wise count rates for Quadrant B Data is divided into 100 sec bins |
 |
 |
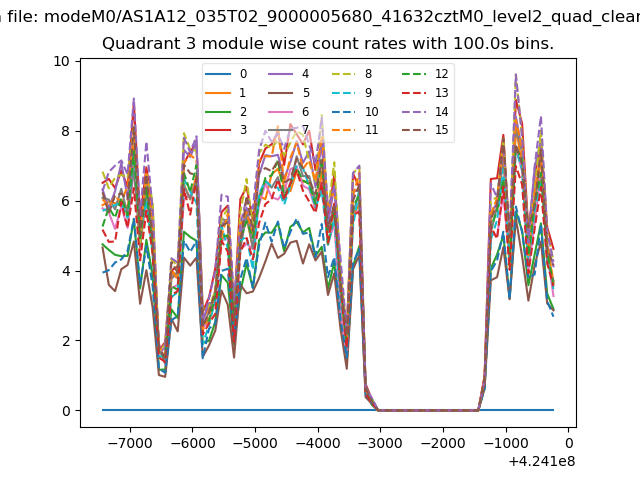
| Module-wise count rates for Quadrant C Data is divided into 100 sec bins |
 |
 |
| Module-wise count rates for Quadrant D Data is divided into 100 sec bins |
 |
 |
| Parameter | Plot |
|---|---|
| CZT HV Monitor | 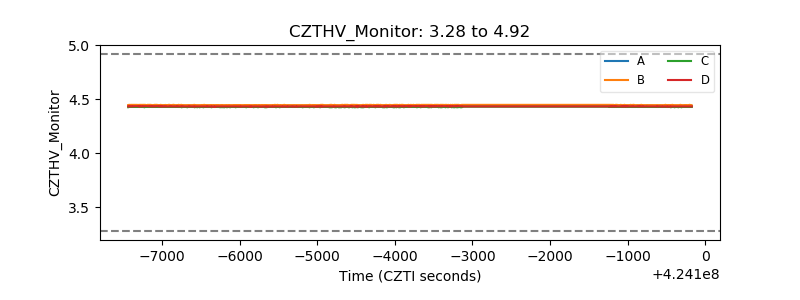 |
| D_VDD | 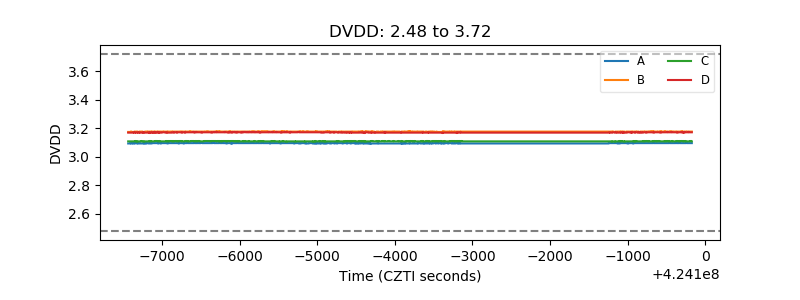 |
| Temperature 1 | 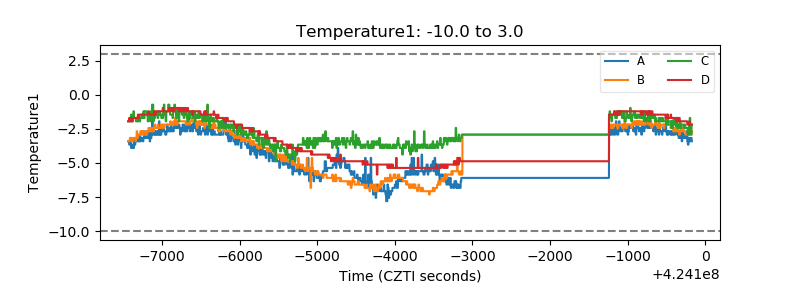 |
| Veto HV Monitor | 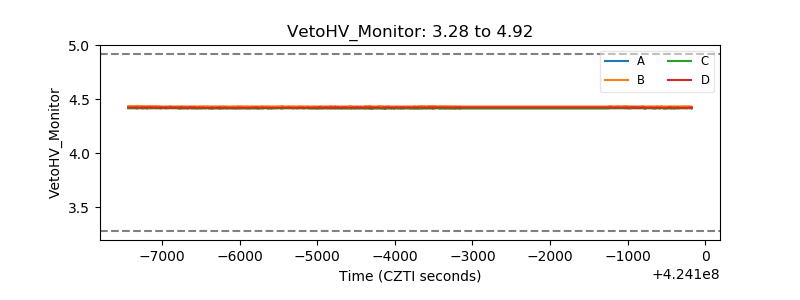 |
| Veto LLD | 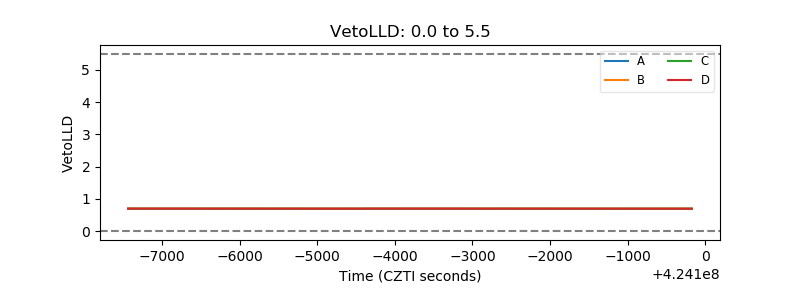 |
| Alpha Counter | 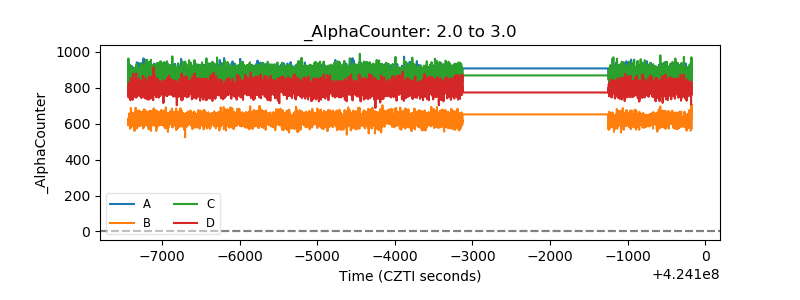 |
| _CPM_Rate | 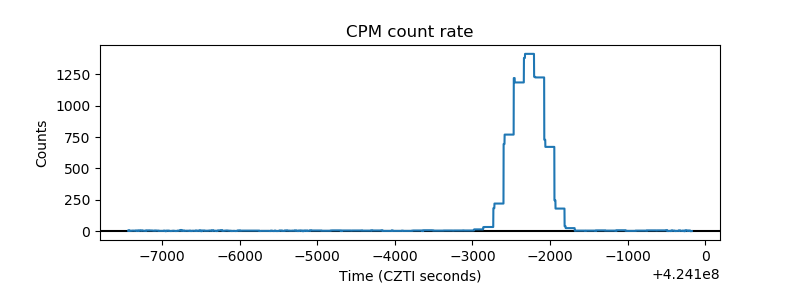 |
| CZT Counter | 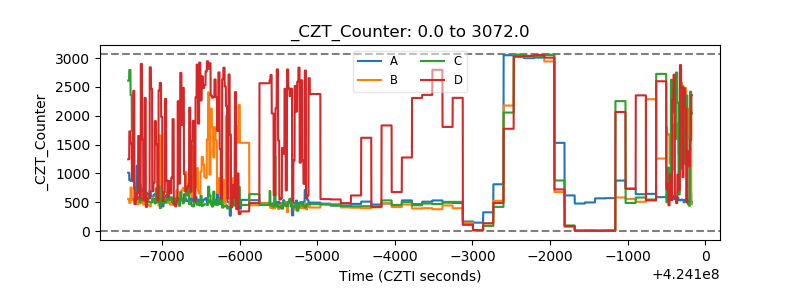 |
| +2.5 Volts monitor | 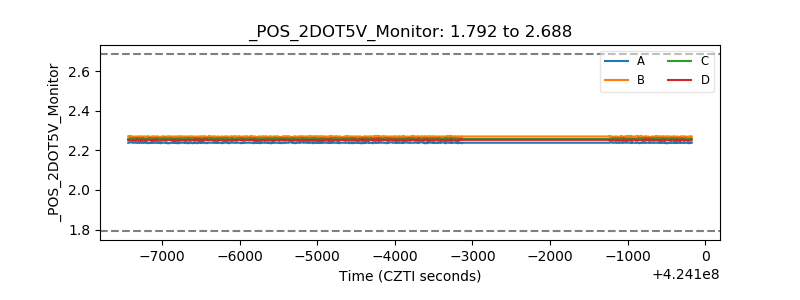 |
| +5 Volts monitor | 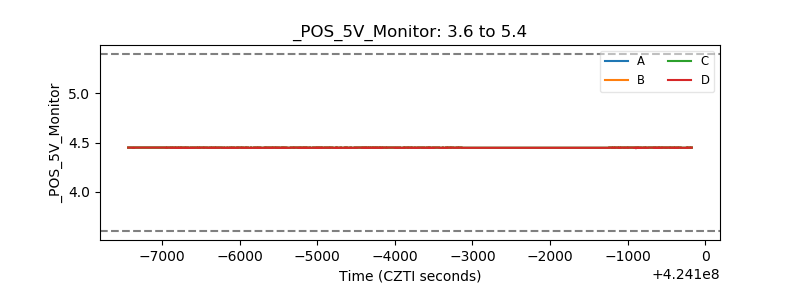 |
| _ROLL_ROT | 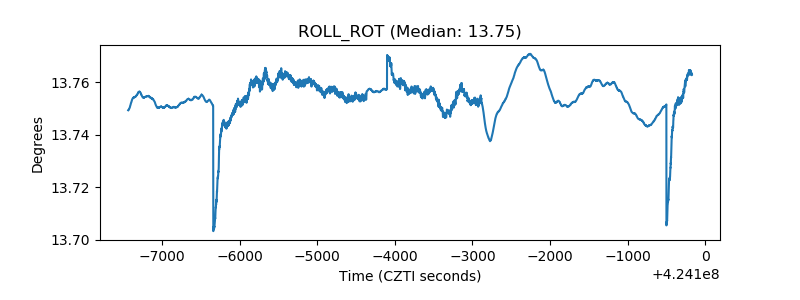 |
| _Roll_DEC | 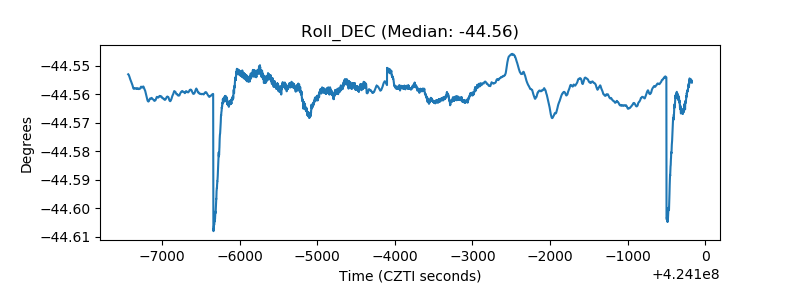 |
| _Roll_RA | 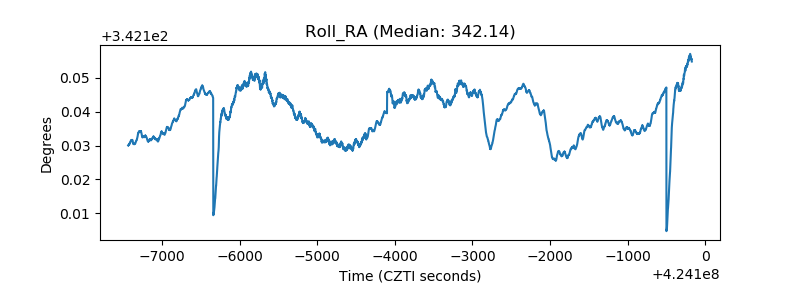 |
| Veto Counter | 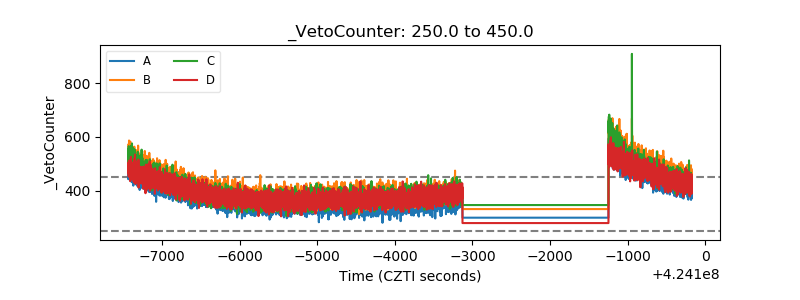 |