| Param | Original file | Final file |
|---|---|---|
| Filename | modeM0/AS1A12_035T02_9000005680_41633cztM0_level2.fits | modeM0/AS1A12_035T02_9000005680_41633cztM0_level2_quad_clean.evt |
| Size (bytes) | 519,053,760 | 88,646,400 |
| Size | 495.0 MB | 84.5 MB |
| Events in quadrant A | 3,004,880 | 665,257 |
| Events in quadrant B | 3,791,204 | 637,747 |
| Events in quadrant C | 4,554,672 | 566,008 |
| Events in quadrant D | 7,461,569 | 452,713 |
| Mode SS | |||
|---|---|---|---|
| Quadrant | BADHDUFLAG | Total packets | Discarded packets |
| A | 0 | 106 | 0 |
| B | 0 | 106 | 0 |
| C | 0 | 106 | 0 |
| D | 0 | 106 | 0 |
| Mode M0 | |||
|---|---|---|---|
| Quadrant | BADHDUFLAG | Total packets | Discarded packets |
| A | 0 | 12041 | 2 |
| B | 0 | 14618 | 2 |
| C | 0 | 16719 | 2 |
| D | 0 | 25714 | 2 |
| Mode M9 | |||
|---|---|---|---|
| Quadrant | BADHDUFLAG | Total packets | Discarded packets |
| A | 0 | 25 | 0 |
| B | 0 | 26 | 0 |
| C | 0 | 26 | 0 |
| D | 0 | 26 | 0 |
| Quadrant | Total seconds | Saturated seconds | Saturation percentage |
|---|---|---|---|
| A | 5172 | 17 | 0.328693% |
| B | 5172 | 420 | 8.120650% |
| C | 5172 | 623 | 12.045630% |
| D | 5172 | 1508 | 29.156999% |
Noise dominated data is calculated using 1-second bins in cleaned event files. If a bin has >2000 counts, and if more than 50% of those come from <1% of pixels, then it is considered to be noise-dominated and hence unusable.
| Quadrant | # 1 sec bins | Bins with >0 counts | Bins with >2000 counts | High rate bins dominated by noise | Noise dominated (total time) | Noise dominated (detector-on time) | Marked lightcurve |
|---|---|---|---|---|---|---|---|
| A | 7175 | 5173 | 2 | 2 | 0.03% | 0.04% | 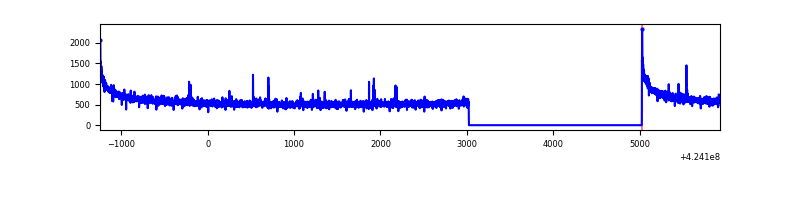 |
| B | 7175 | 5173 | 254 | 254 | 3.54% | 4.91% | 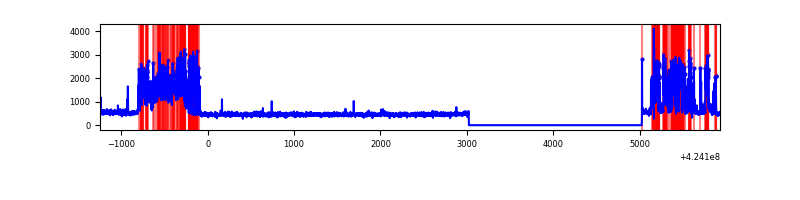 |
| C | 7175 | 5173 | 561 | 561 | 7.82% | 10.84% | 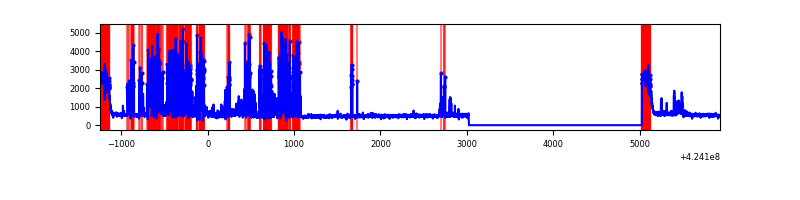 |
| D | 7175 | 5173 | 1525 | 1525 | 21.25% | 29.48% | 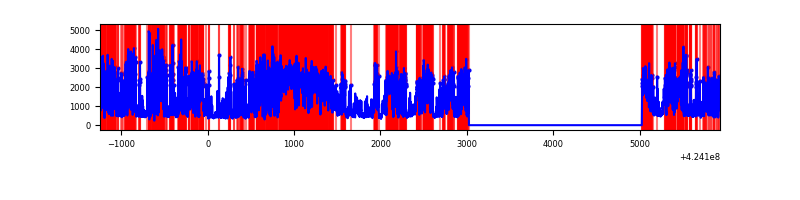 |
Top three noisy pixels from each quadrant. If the there are fewer than three noisy pixels in the level2.evt file, extra rows are filled as -1
| Pixel properties | Quadrant properties | ||||||
|---|---|---|---|---|---|---|---|
| Quadrant | DetID | PixID | Counts | Sigma | Mean | Median | Sigma |
| A | 10 | 83 | 539586 | 4257.77 | 626 | 614 | 126.6 |
| A | 2 | 79 | 25046 | 193.01 | 626 | 614 | 126.6 |
| A | 13 | 254 | 9867 | 73.1 | 626 | 614 | 126.6 |
| B | 0 | 186 | 1326274 | 11501.45 | 607 | 593 | 115.3 |
| B | 5 | 255 | 41163 | 351.98 | 607 | 593 | 115.3 |
| B | 0 | 190 | 24624 | 208.49 | 607 | 593 | 115.3 |
| C | 0 | 15 | 1525279 | 11640.77 | 563 | 567 | 131.0 |
| C | 0 | 10 | 518842 | 3956.89 | 563 | 567 | 131.0 |
| C | 15 | 214 | 215098 | 1637.89 | 563 | 567 | 131.0 |
| D | 12 | 79 | 4692642 | 34629.16 | 553 | 537 | 135.5 |
| D | 13 | 249 | 387482 | 2855.77 | 553 | 537 | 135.5 |
| D | 10 | 255 | 72754 | 532.98 | 553 | 537 | 135.5 |
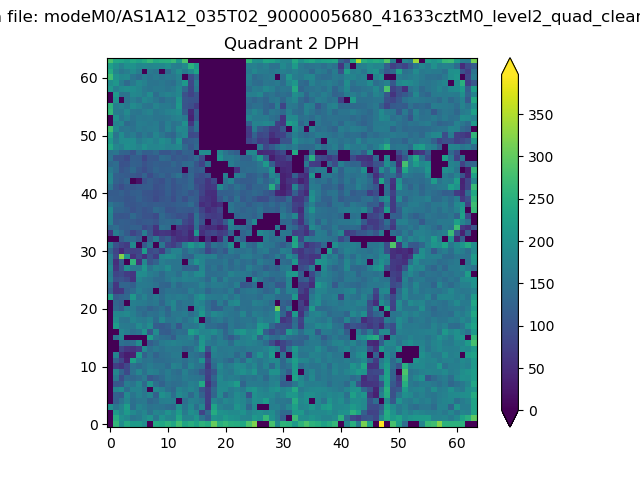
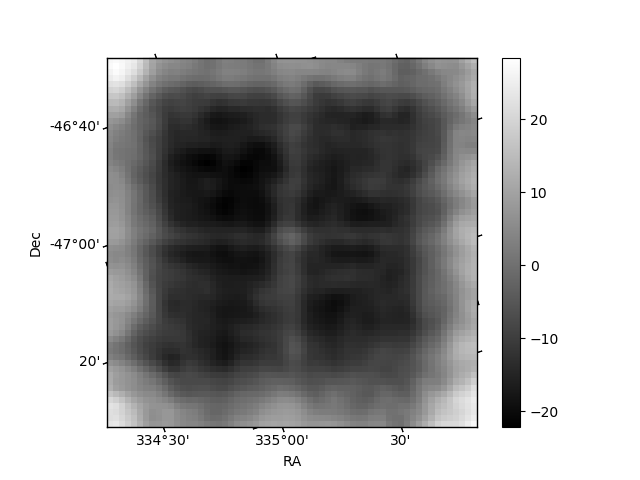
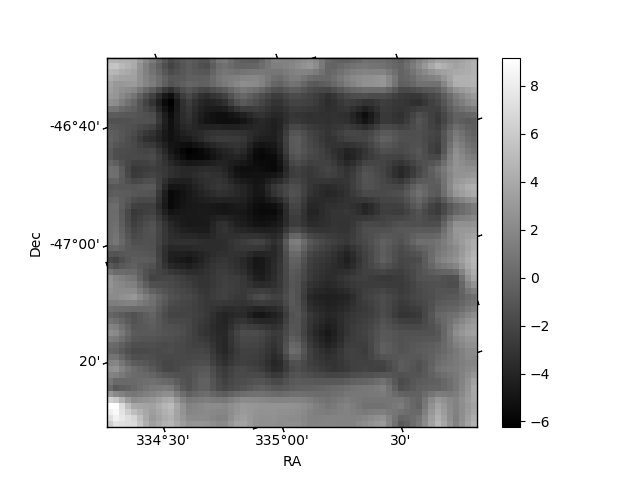
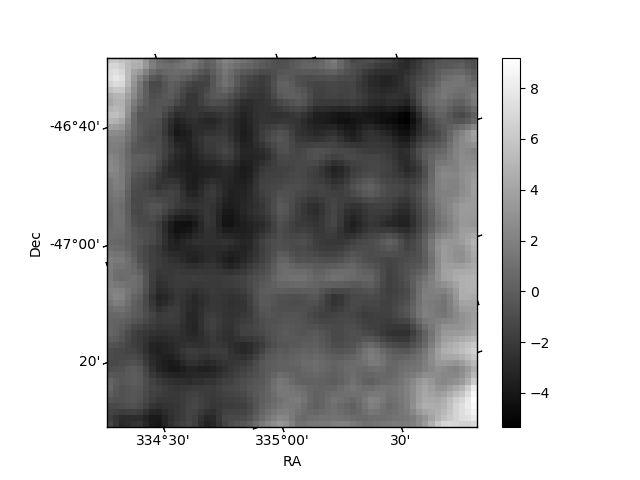
Histogram calculated using DETX and DETY for each event in the final _common_clean file
| Quadrant A | 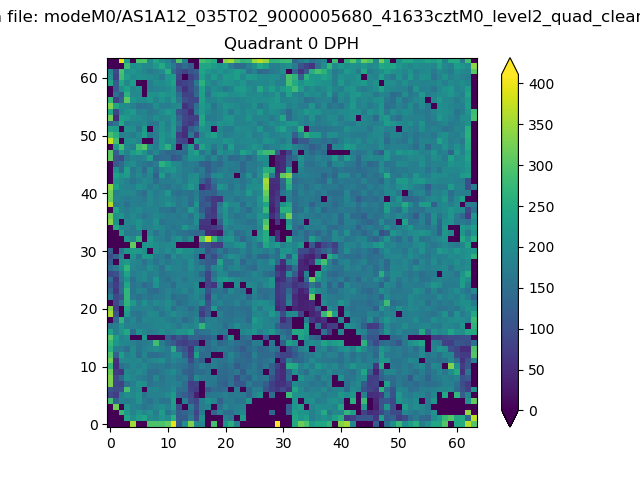 |
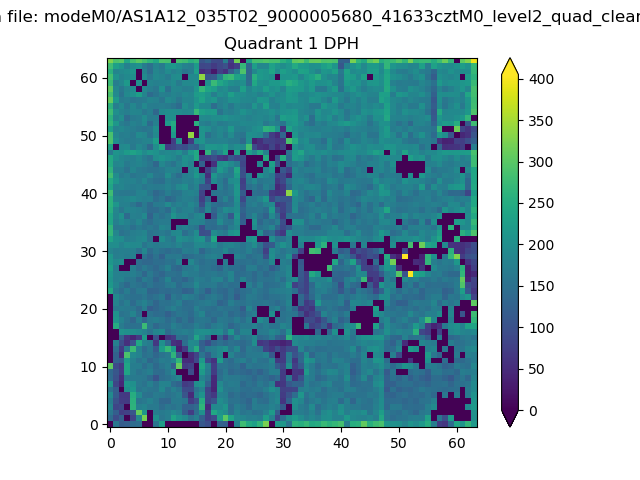 |
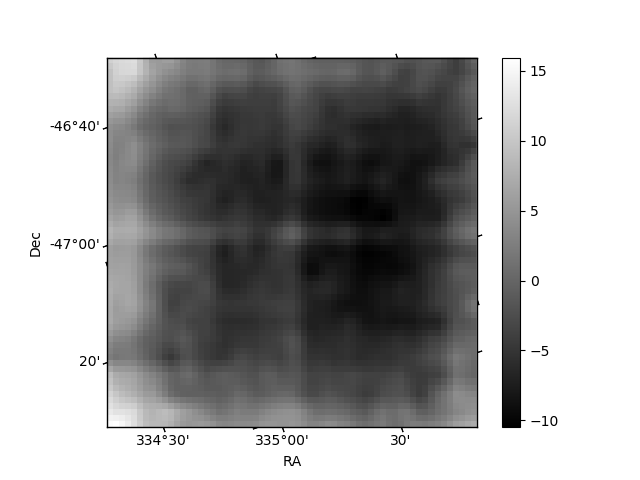
Quadrant B |
|---|---|---|---|
| Quadrant D | 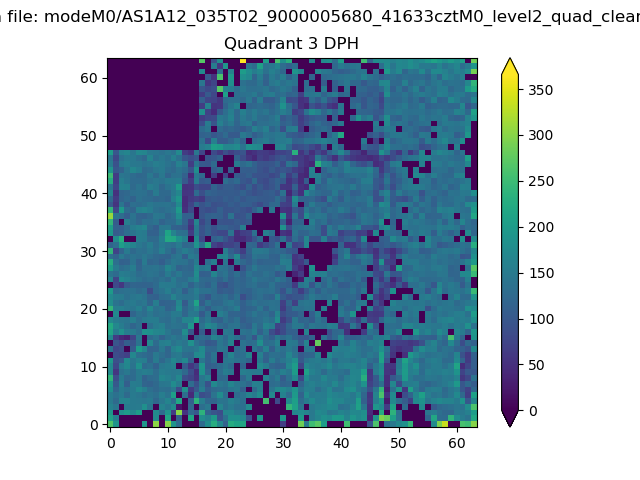 |
 |
Quadrant C |
| Plot type | Count rate plots | Images |
|---|---|---|
| Comparison with Poisson distribution Blue bars denote a histogram of data divided into 1 sec bins. Red curve is a Poisson curve with rate = median count rate of data. |
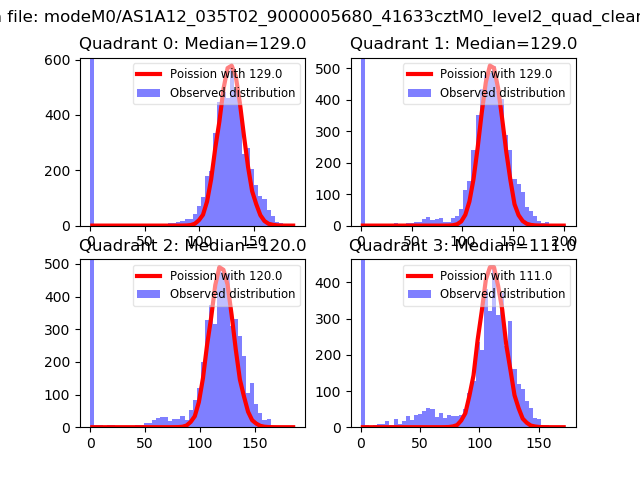 |
 |
| Quadrant-wise count rates Data is divided into 100 sec bins |
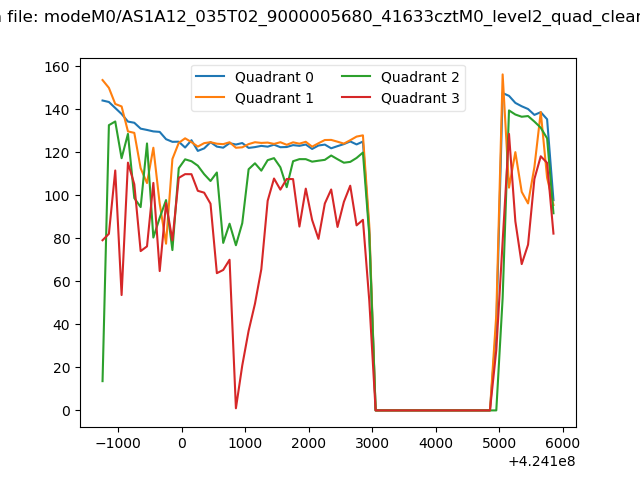 |
|
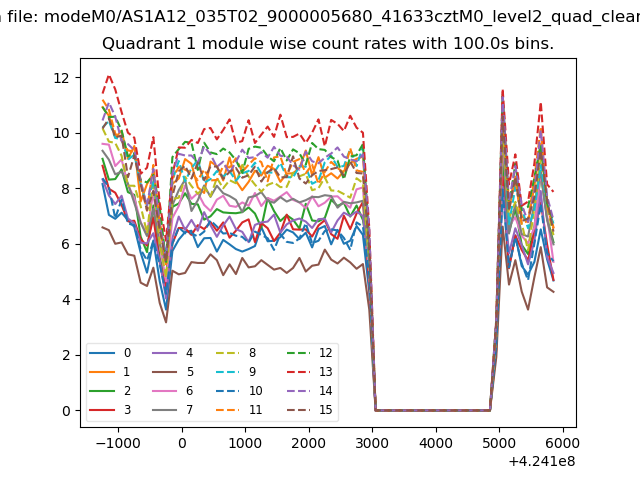
| Module-wise count rates for Quadrant A Data is divided into 100 sec bins |
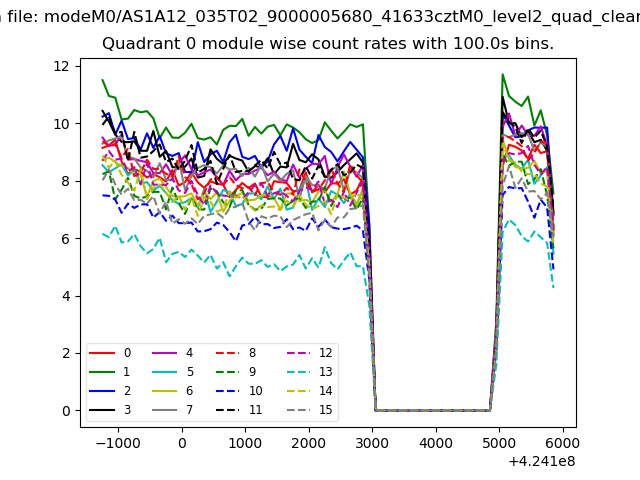 |
 |
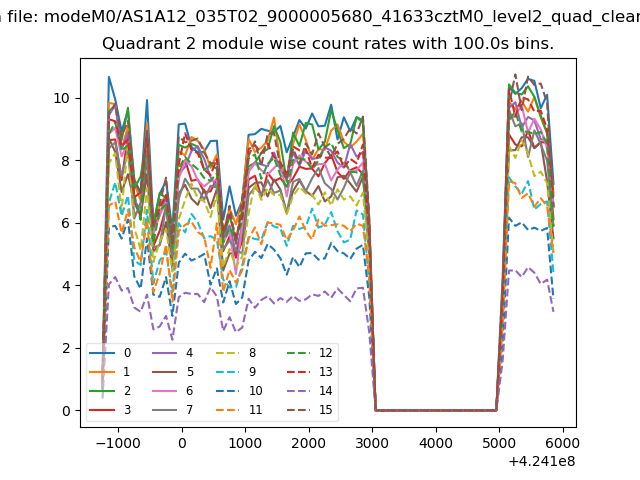
| Module-wise count rates for Quadrant B Data is divided into 100 sec bins |
 |
 |
| Module-wise count rates for Quadrant C Data is divided into 100 sec bins |
 |
 |
| Module-wise count rates for Quadrant D Data is divided into 100 sec bins |
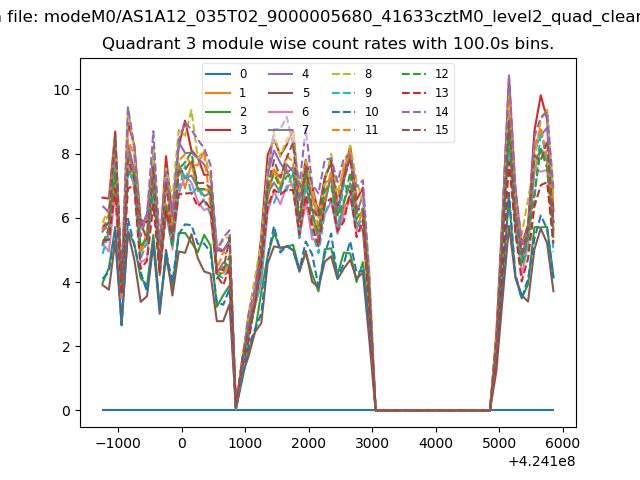 |
 |
| Parameter | Plot |
|---|---|
| CZT HV Monitor | 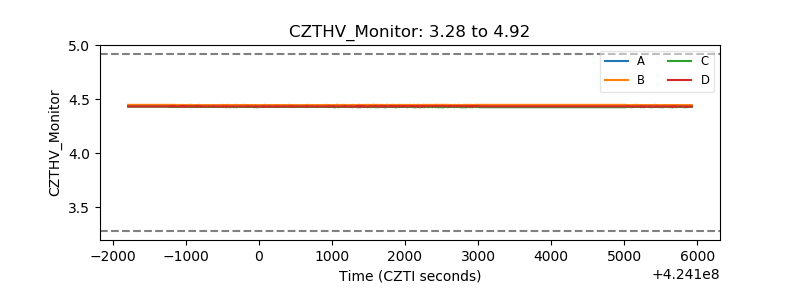 |
| D_VDD | 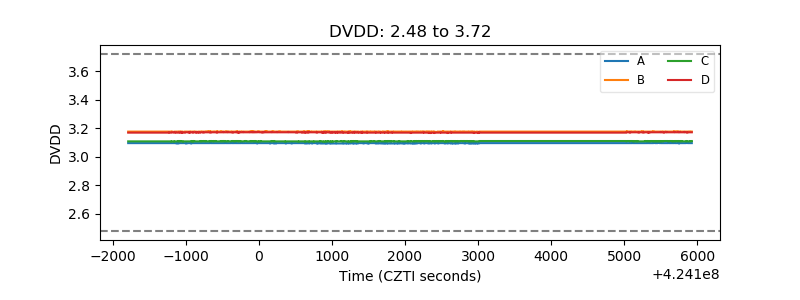 |
| Temperature 1 | 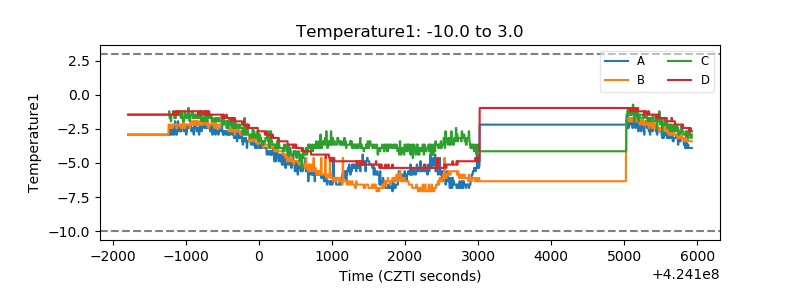 |
| Veto HV Monitor | 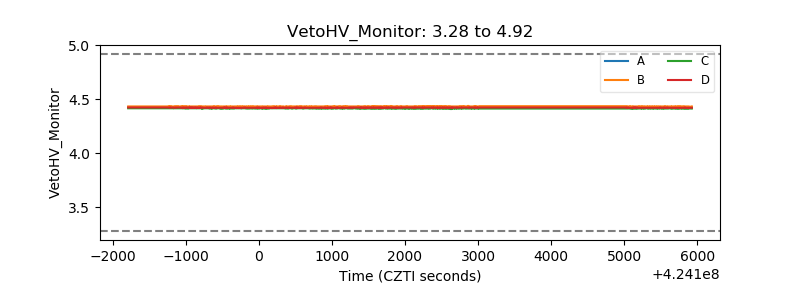 |
| Veto LLD | 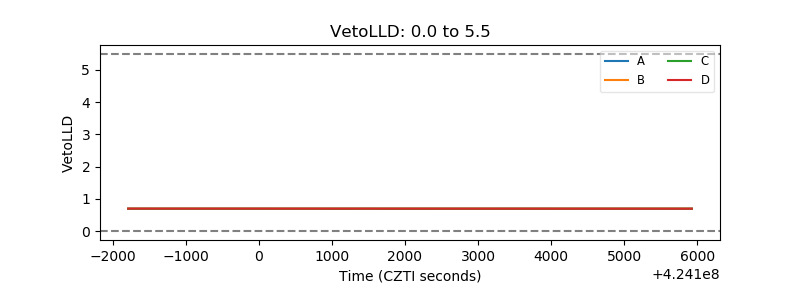 |
| Alpha Counter | 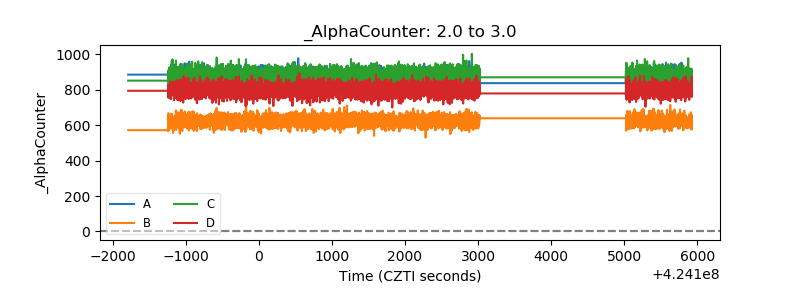 |
| _CPM_Rate | 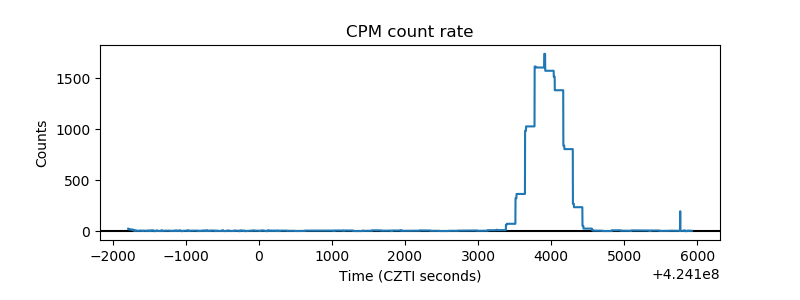 |
| CZT Counter | 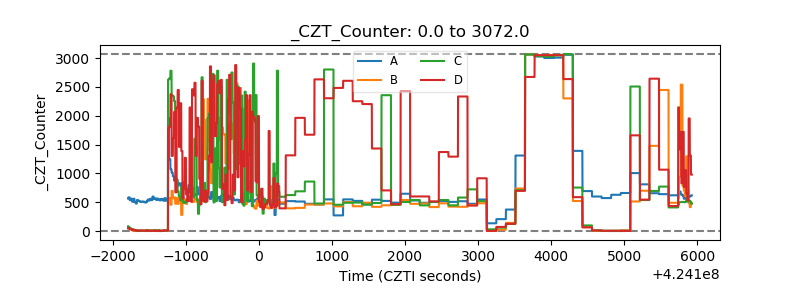 |
| +2.5 Volts monitor | 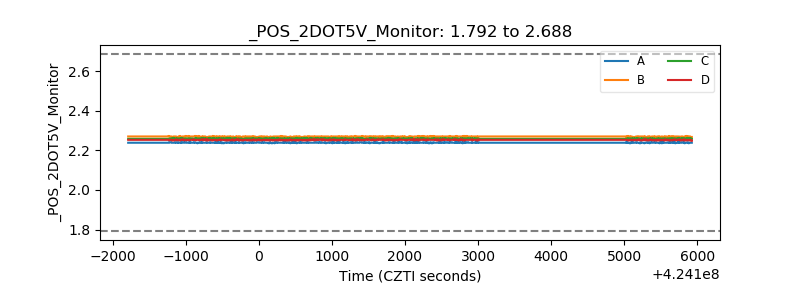 |
| +5 Volts monitor | 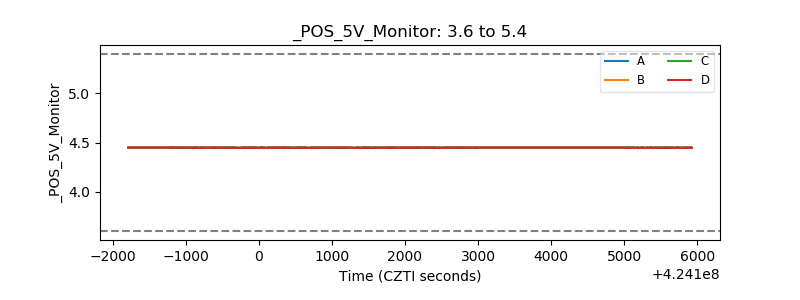 |
| _ROLL_ROT | 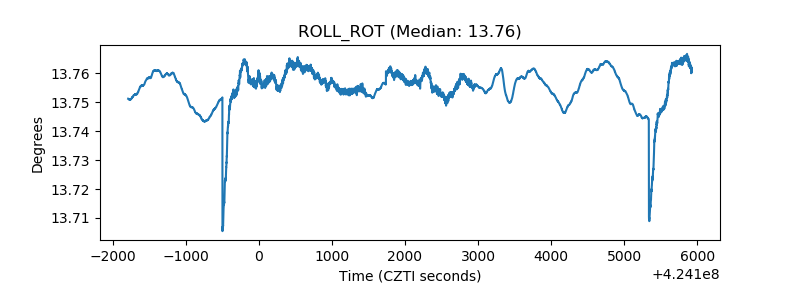 |
| _Roll_DEC |  |
| _Roll_RA | 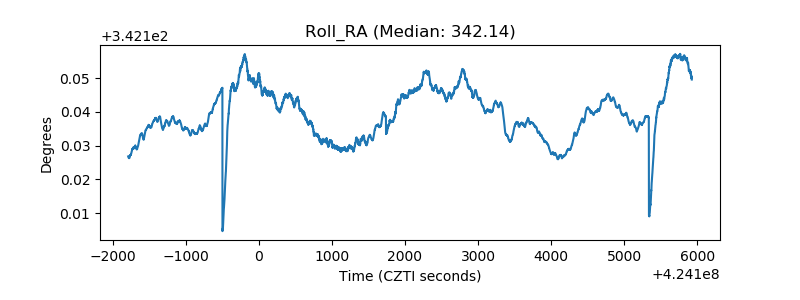 |
| Veto Counter | 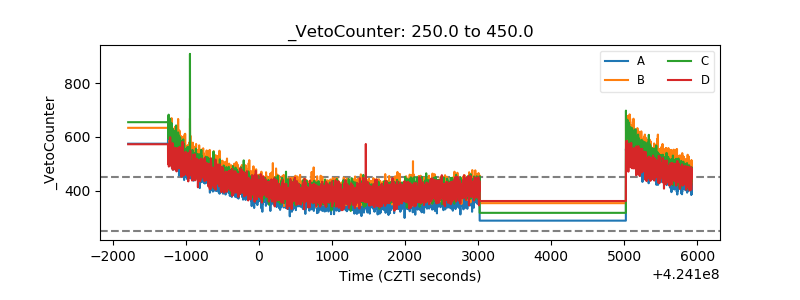 |