| Param | Original file | Final file |
|---|---|---|
| Filename | modeM0/AS1A12_035T02_9000005680_41634cztM0_level2.fits | modeM0/AS1A12_035T02_9000005680_41634cztM0_level2_quad_clean.evt |
| Size (bytes) | 444,424,320 | 86,319,360 |
| Size | 423.8 MB | 82.3 MB |
| Events in quadrant A | 2,851,167 | 637,463 |
| Events in quadrant B | 3,056,290 | 628,700 |
| Events in quadrant C | 3,568,211 | 560,139 |
| Events in quadrant D | 6,594,691 | 443,847 |
| Mode SS | |||
|---|---|---|---|
| Quadrant | BADHDUFLAG | Total packets | Discarded packets |
| A | 0 | 100 | 0 |
| B | 0 | 100 | 0 |
| C | 0 | 100 | 0 |
| D | 0 | 100 | 0 |
| Mode M0 | |||
|---|---|---|---|
| Quadrant | BADHDUFLAG | Total packets | Discarded packets |
| A | 0 | 11414 | 2 |
| B | 0 | 12207 | 2 |
| C | 0 | 13485 | 2 |
| D | 0 | 22927 | 3 |
| Mode M9 | |||
|---|---|---|---|
| Quadrant | BADHDUFLAG | Total packets | Discarded packets |
| A | 0 | 21 | 0 |
| B | 0 | 22 | 0 |
| C | 0 | 22 | 0 |
| D | 0 | 22 | 0 |
| Quadrant | Total seconds | Saturated seconds | Saturation percentage |
|---|---|---|---|
| A | 4898 | 16 | 0.326664% |
| B | 4898 | 216 | 4.409963% |
| C | 4898 | 392 | 8.003267% |
| D | 4897 | 1316 | 26.873596% |
Noise dominated data is calculated using 1-second bins in cleaned event files. If a bin has >2000 counts, and if more than 50% of those come from <1% of pixels, then it is considered to be noise-dominated and hence unusable.
| Quadrant | # 1 sec bins | Bins with >0 counts | Bins with >2000 counts | High rate bins dominated by noise | Noise dominated (total time) | Noise dominated (detector-on time) | Marked lightcurve |
|---|---|---|---|---|---|---|---|
| A | 6991 | 4899 | 2 | 2 | 0.03% | 0.04% | 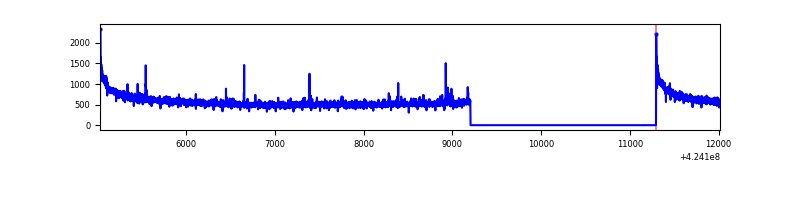 |
| B | 6991 | 4899 | 132 | 132 | 1.89% | 2.69% | 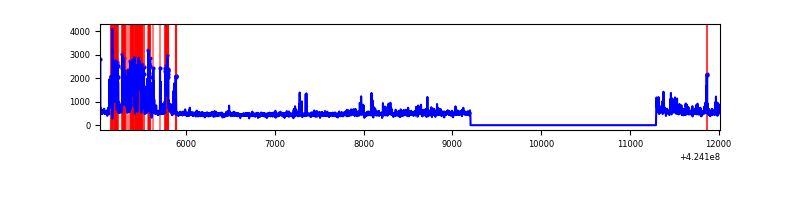 |
| C | 6991 | 4899 | 349 | 349 | 4.99% | 7.12% | 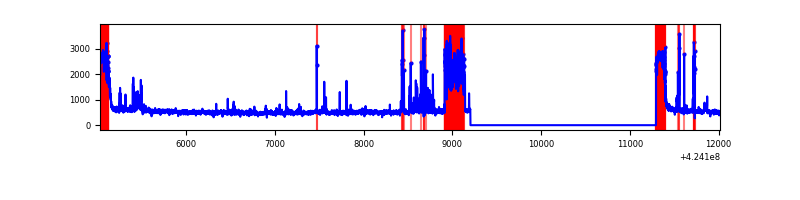 |
| D | 6990 | 4898 | 1363 | 1363 | 19.50% | 27.83% | 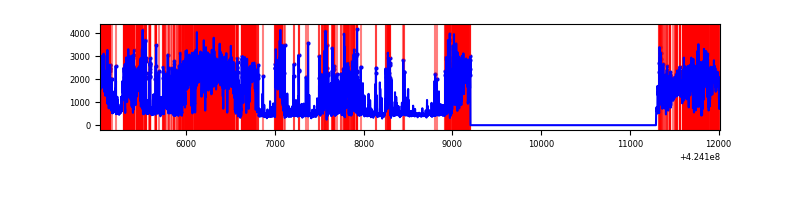 |
Top three noisy pixels from each quadrant. If the there are fewer than three noisy pixels in the level2.evt file, extra rows are filled as -1
| Pixel properties | Quadrant properties | ||||||
|---|---|---|---|---|---|---|---|
| Quadrant | DetID | PixID | Counts | Sigma | Mean | Median | Sigma |
| A | 10 | 83 | 522125 | 4301.68 | 592 | 581 | 121.2 |
| A | 2 | 79 | 22775 | 183.06 | 592 | 581 | 121.2 |
| A | 13 | 254 | 9096 | 70.23 | 592 | 581 | 121.2 |
| B | 0 | 186 | 535680 | 4800.63 | 583 | 568 | 111.5 |
| B | 0 | 189 | 119829 | 1069.92 | 583 | 568 | 111.5 |
| B | 5 | 255 | 75886 | 675.7 | 583 | 568 | 111.5 |
| C | 0 | 10 | 531830 | 4180.47 | 547 | 551 | 127.1 |
| C | 0 | 15 | 447048 | 3513.34 | 547 | 551 | 127.1 |
| C | 14 | 254 | 239050 | 1876.67 | 547 | 551 | 127.1 |
| D | 12 | 79 | 4186918 | 32118.15 | 531 | 515 | 130.3 |
| D | 13 | 249 | 158828 | 1214.58 | 531 | 515 | 130.3 |
| D | 1 | 47 | 79709 | 607.57 | 531 | 515 | 130.3 |
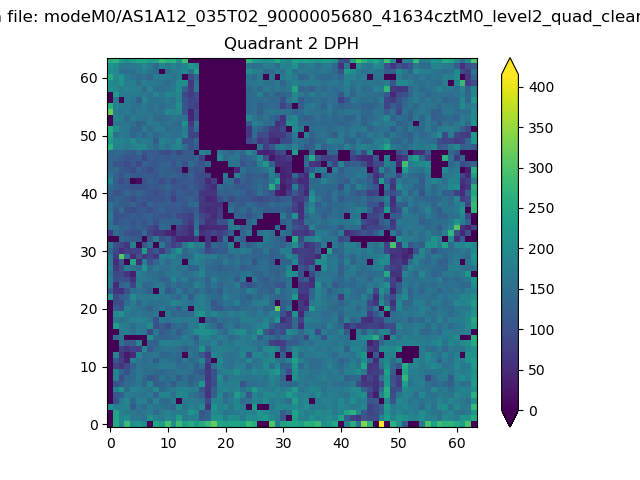
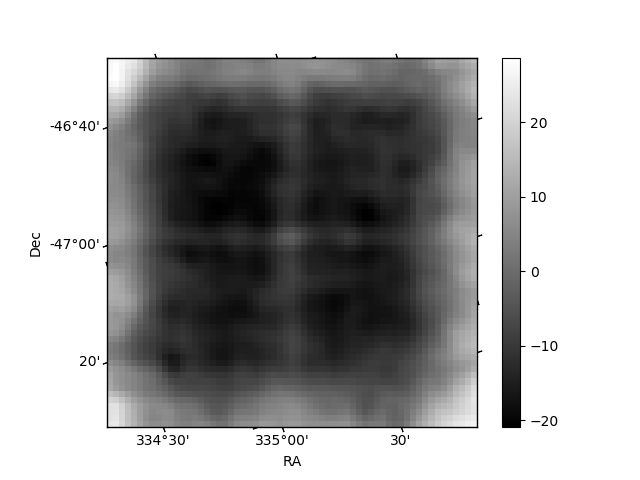
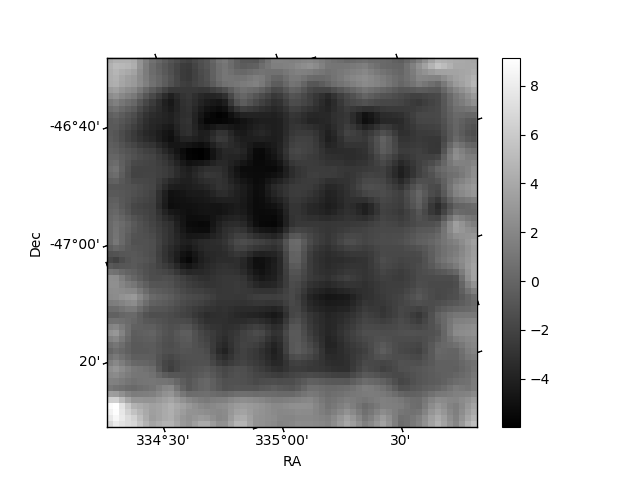
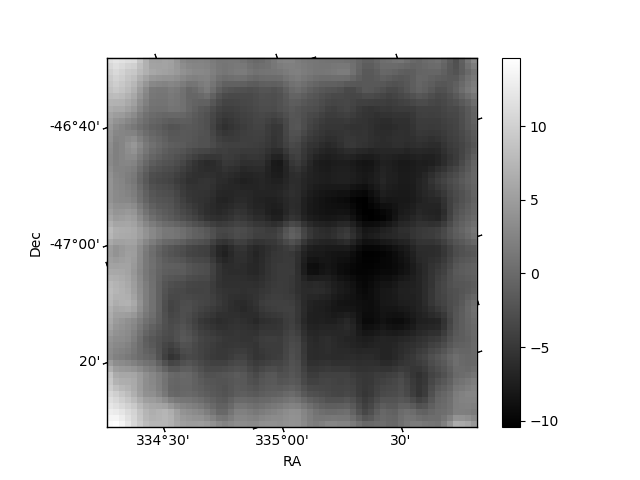
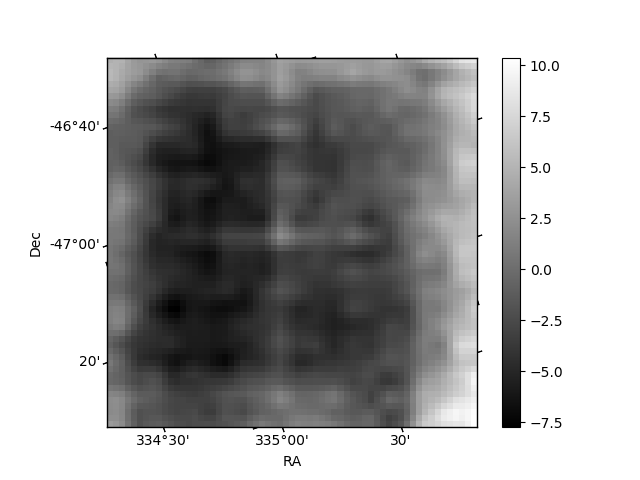
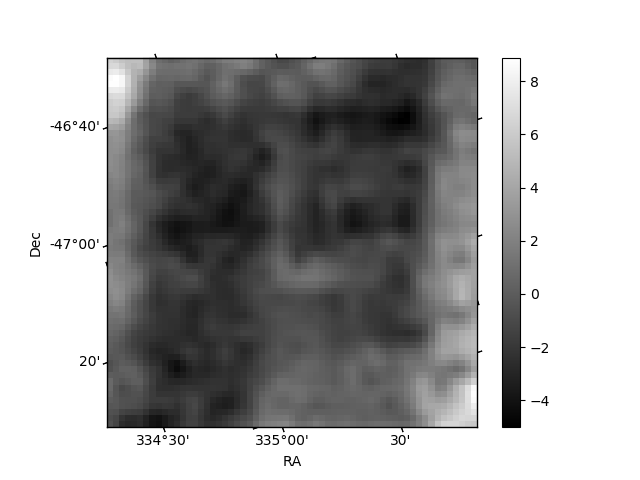
Histogram calculated using DETX and DETY for each event in the final _common_clean file
| Quadrant A | 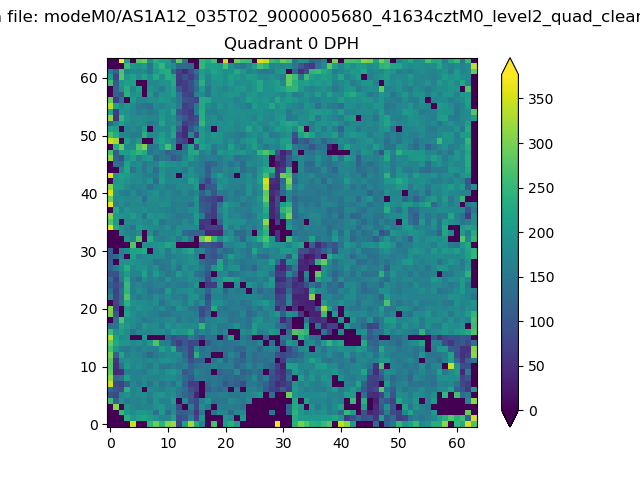 |
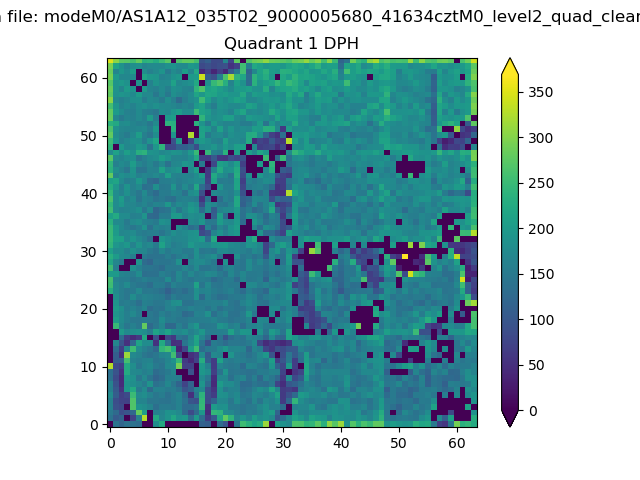 |
Quadrant B |
|---|---|---|---|
| Quadrant D | 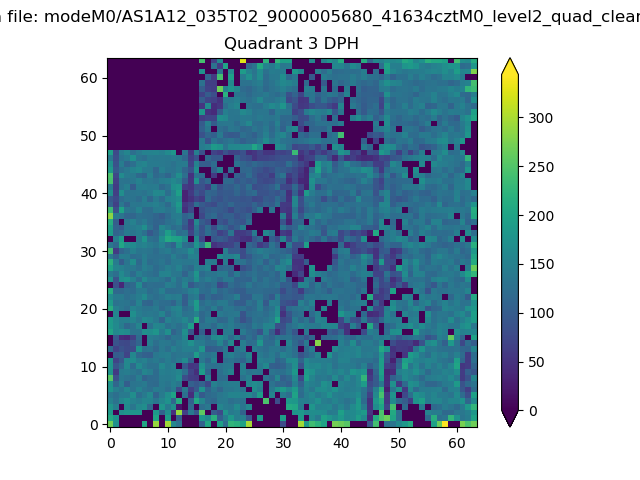 |
 |
Quadrant C |
| Plot type | Count rate plots | Images |
|---|---|---|
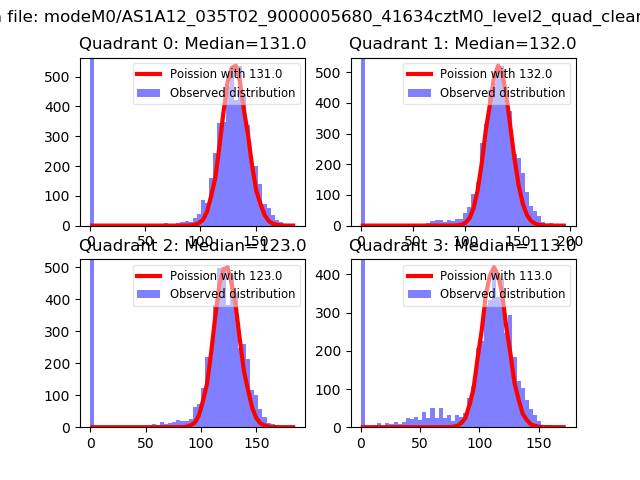
| Comparison with Poisson distribution Blue bars denote a histogram of data divided into 1 sec bins. Red curve is a Poisson curve with rate = median count rate of data. |
 |
 |
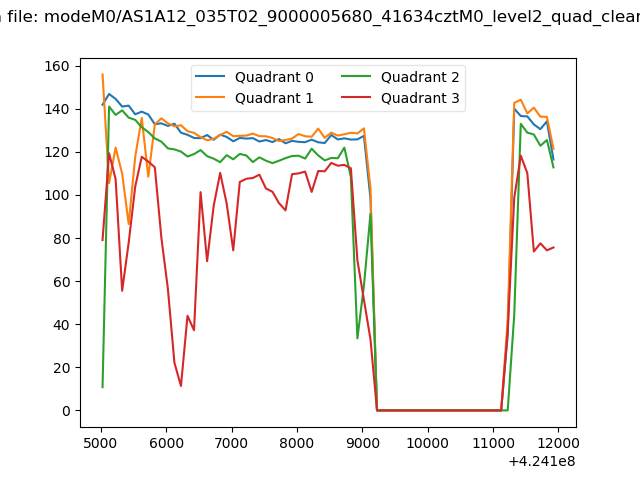
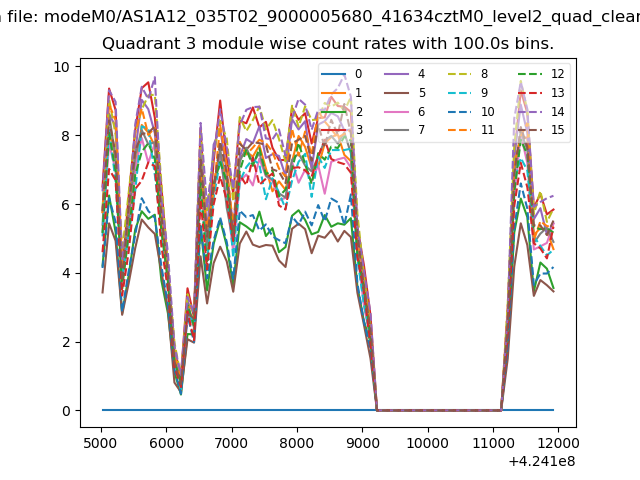
| Quadrant-wise count rates Data is divided into 100 sec bins |
 |
|
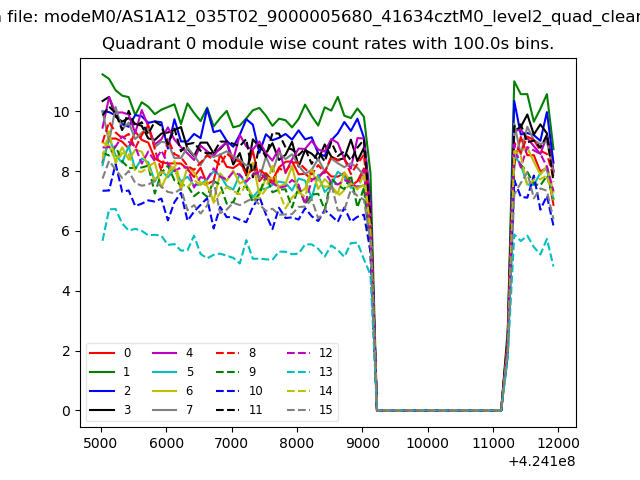
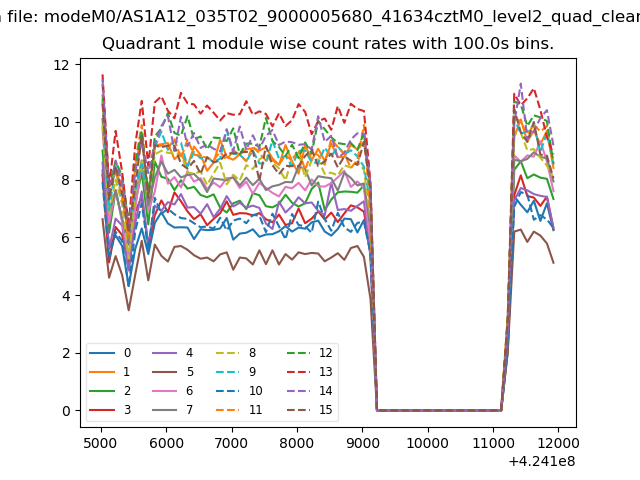
| Module-wise count rates for Quadrant A Data is divided into 100 sec bins |
 |
 |
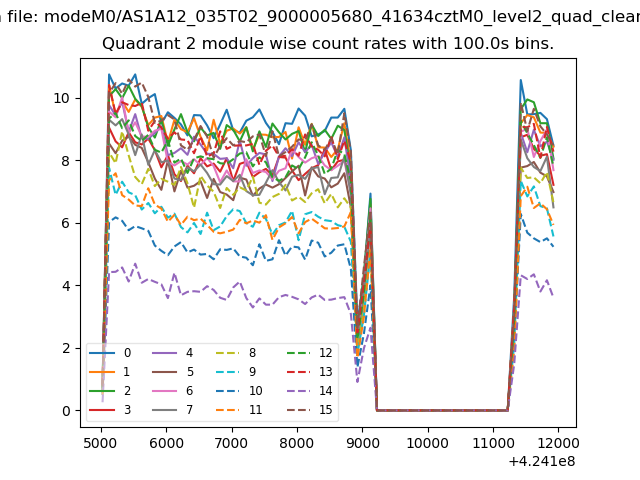
| Module-wise count rates for Quadrant B Data is divided into 100 sec bins |
 |
 |
| Module-wise count rates for Quadrant C Data is divided into 100 sec bins |
 |
 |
| Module-wise count rates for Quadrant D Data is divided into 100 sec bins |
 |
 |
| Parameter | Plot |
|---|---|
| CZT HV Monitor | 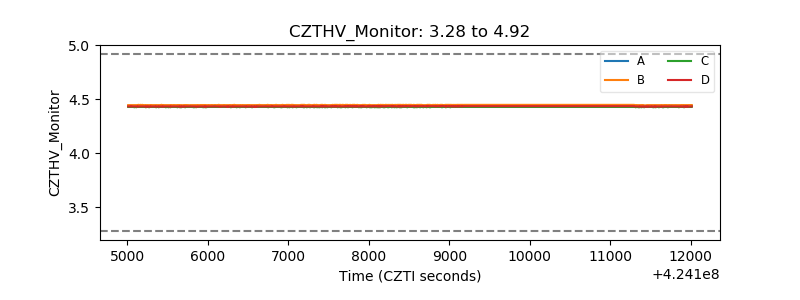 |
| D_VDD | 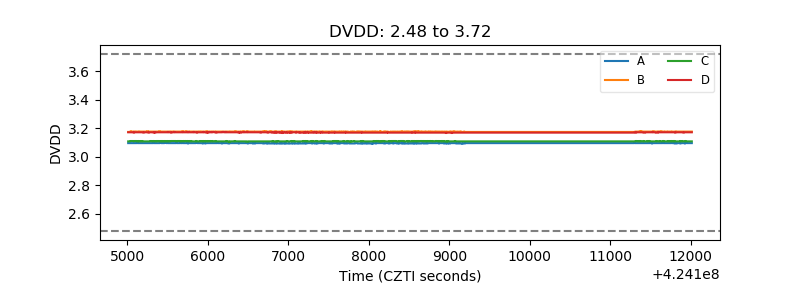 |
| Temperature 1 | 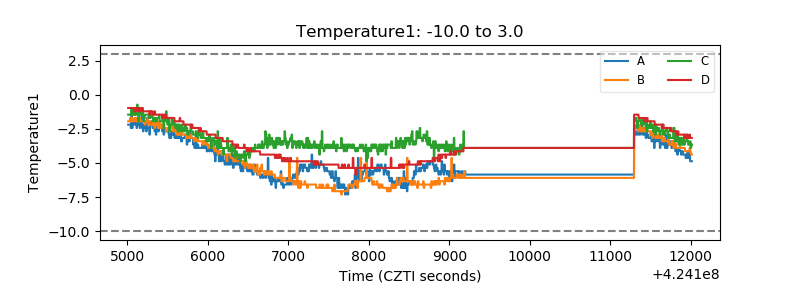 |
| Veto HV Monitor | 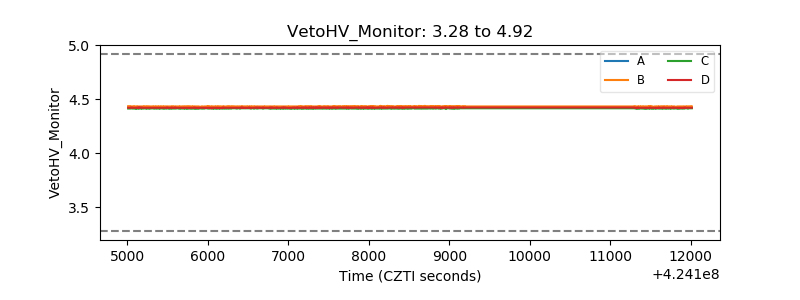 |
| Veto LLD | 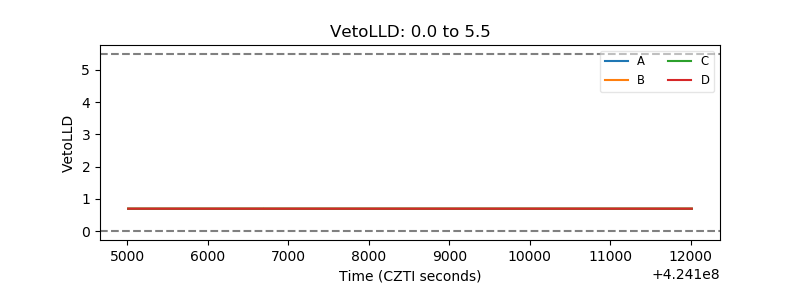 |
| Alpha Counter | 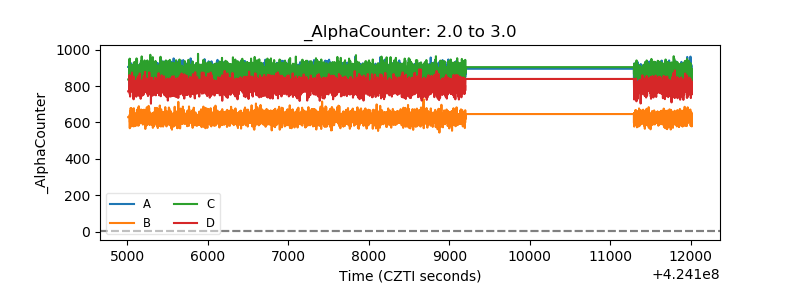 |
| _CPM_Rate | 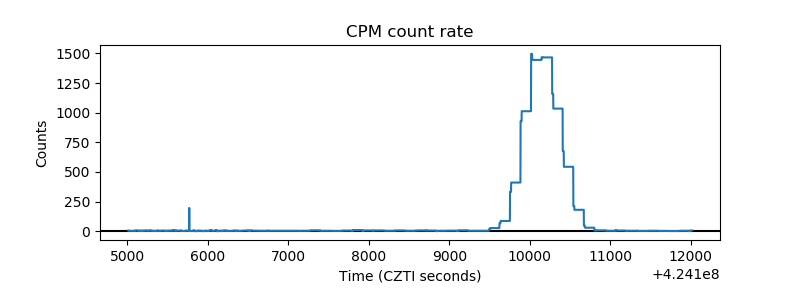 |
| CZT Counter | 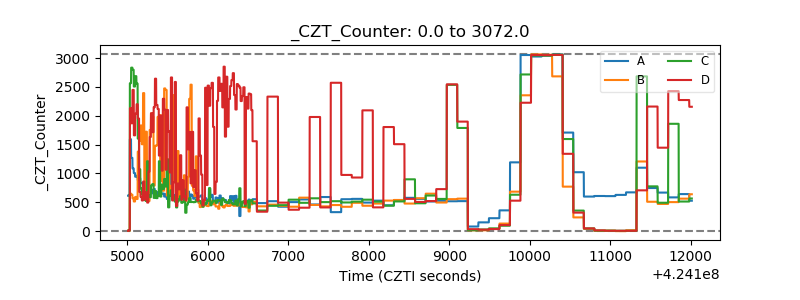 |
| +2.5 Volts monitor |  |
| +5 Volts monitor | 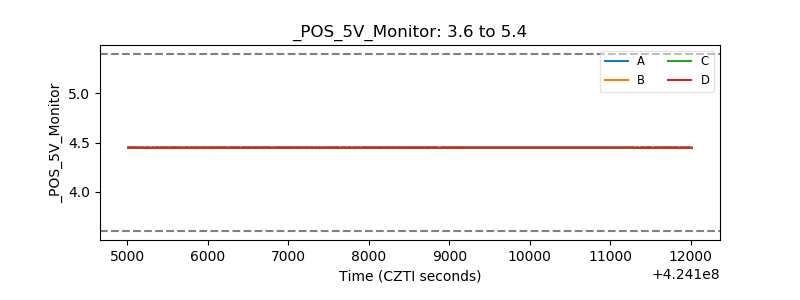 |
| _ROLL_ROT | 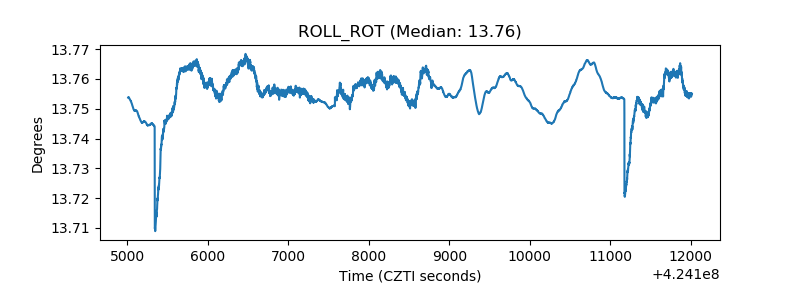 |
| _Roll_DEC | 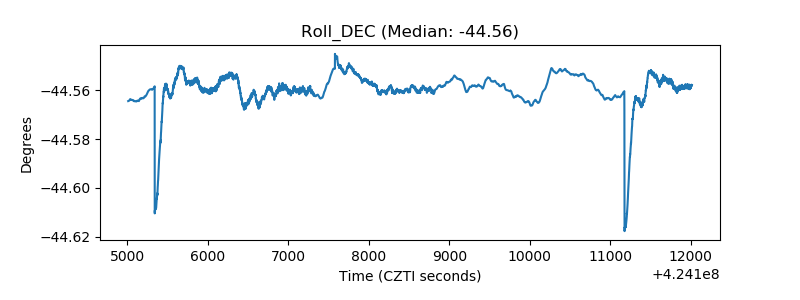 |
| _Roll_RA | 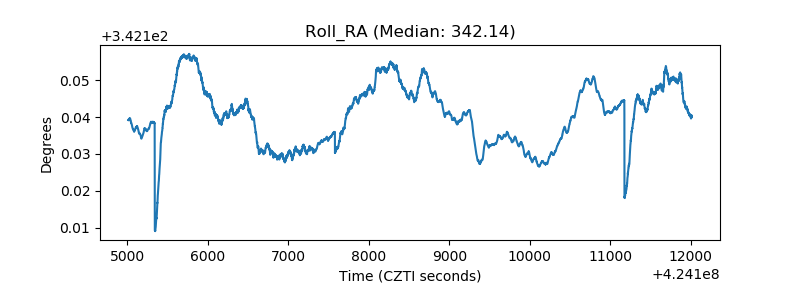 |
| Veto Counter | 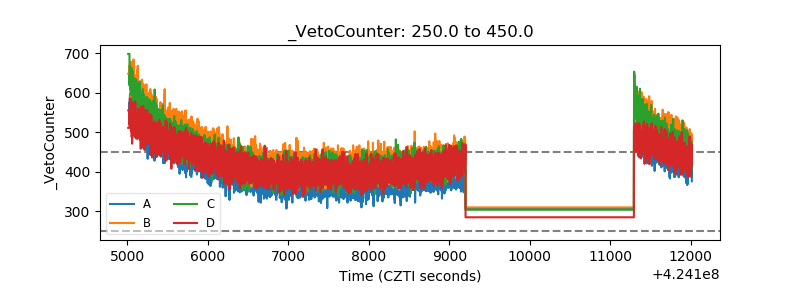 |