| Param | Original file | Final file |
|---|---|---|
| Filename | modeM0/AS1A12_035T02_9000005680_41636cztM0_level2.fits | modeM0/AS1A12_035T02_9000005680_41636cztM0_level2_quad_clean.evt |
| Size (bytes) | 487,520,640 | 78,387,840 |
| Size | 464.9 MB | 74.8 MB |
| Events in quadrant A | 2,673,465 | 590,378 |
| Events in quadrant B | 2,343,958 | 598,920 |
| Events in quadrant C | 3,118,955 | 536,586 |
| Events in quadrant D | 9,526,035 | 301,460 |
| Mode SS | |||
|---|---|---|---|
| Quadrant | BADHDUFLAG | Total packets | Discarded packets |
| A | 0 | 100 | 0 |
| B | 0 | 100 | 0 |
| C | 0 | 100 | 0 |
| D | 0 | 100 | 0 |
| Mode M0 | |||
|---|---|---|---|
| Quadrant | BADHDUFLAG | Total packets | Discarded packets |
| A | 0 | 10866 | 3 |
| B | 0 | 10325 | 2 |
| C | 0 | 12063 | 2 |
| D | 0 | 31678 | 2 |
| Mode M9 | |||
|---|---|---|---|
| Quadrant | BADHDUFLAG | Total packets | Discarded packets |
| A | 0 | 37 | 0 |
| B | 0 | 38 | 0 |
| C | 0 | 38 | 0 |
| D | 0 | 38 | 0 |
| Quadrant | Total seconds | Saturated seconds | Saturation percentage |
|---|---|---|---|
| A | 4938 | 9 | 0.182260% |
| B | 4938 | 12 | 0.243013% |
| C | 4938 | 235 | 4.759012% |
| D | 4938 | 2381 | 48.217902% |
Noise dominated data is calculated using 1-second bins in cleaned event files. If a bin has >2000 counts, and if more than 50% of those come from <1% of pixels, then it is considered to be noise-dominated and hence unusable.
| Quadrant | # 1 sec bins | Bins with >0 counts | Bins with >2000 counts | High rate bins dominated by noise | Noise dominated (total time) | Noise dominated (detector-on time) | Marked lightcurve |
|---|---|---|---|---|---|---|---|
| A | 7000 | 4939 | 3 | 3 | 0.04% | 0.06% | 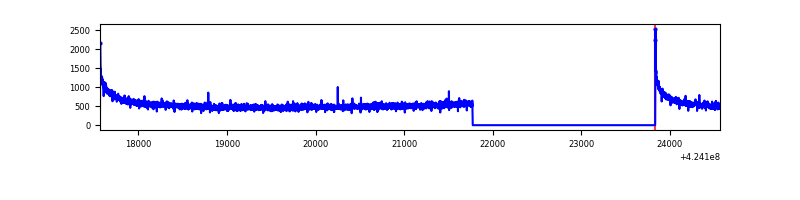 |
| B | 7000 | 4939 | 3 | 3 | 0.04% | 0.06% | 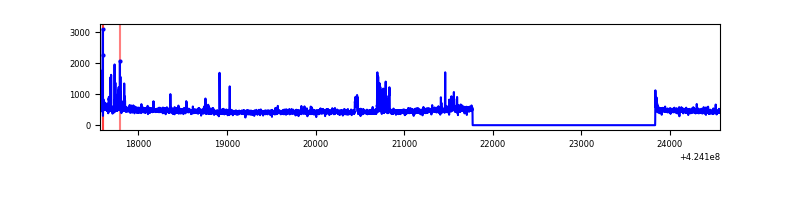 |
| C | 7000 | 4939 | 225 | 225 | 3.21% | 4.56% | 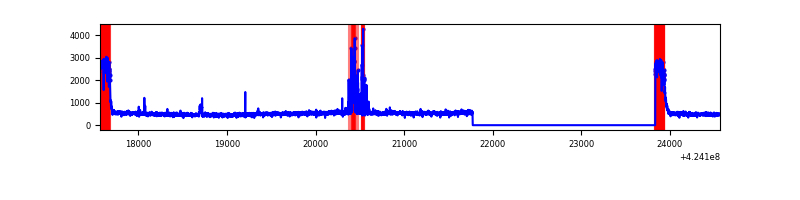 |
| D | 7000 | 4939 | 2479 | 2479 | 35.41% | 50.19% | 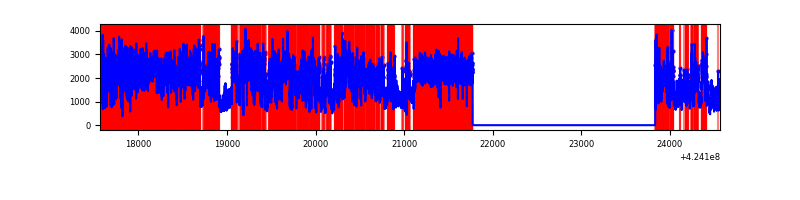 |
Top three noisy pixels from each quadrant. If the there are fewer than three noisy pixels in the level2.evt file, extra rows are filled as -1
| Pixel properties | Quadrant properties | ||||||
|---|---|---|---|---|---|---|---|
| Quadrant | DetID | PixID | Counts | Sigma | Mean | Median | Sigma |
| A | 10 | 83 | 498313 | 4386.75 | 556 | 546 | 113.5 |
| A | 13 | 254 | 9287 | 77.03 | 556 | 546 | 113.5 |
| A | 3 | 1 | 6331 | 50.98 | 556 | 546 | 113.5 |
| B | 4 | 171 | 85656 | 798.61 | 553 | 538 | 106.6 |
| B | 4 | 141 | 43042 | 398.79 | 553 | 538 | 106.6 |
| B | 0 | 189 | 20022 | 182.81 | 553 | 538 | 106.6 |
| C | 0 | 10 | 544870 | 4388.17 | 529 | 531 | 124.0 |
| C | 15 | 214 | 206733 | 1662.29 | 529 | 531 | 124.0 |
| C | 14 | 254 | 147600 | 1185.59 | 529 | 531 | 124.0 |
| D | 12 | 79 | 6507465 | 57639.24 | 462 | 449 | 112.9 |
| D | 2 | 249 | 563566 | 4988.1 | 462 | 449 | 112.9 |
| D | 13 | 249 | 448220 | 3966.36 | 462 | 449 | 112.9 |
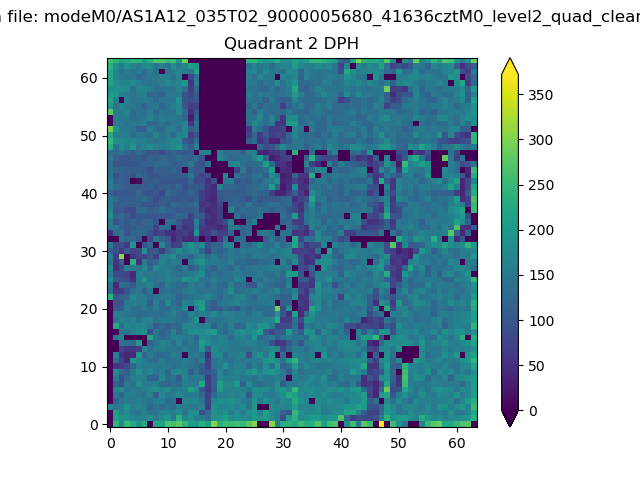
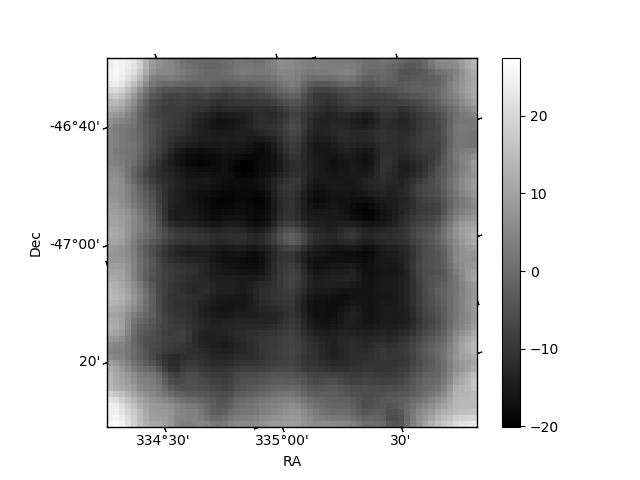
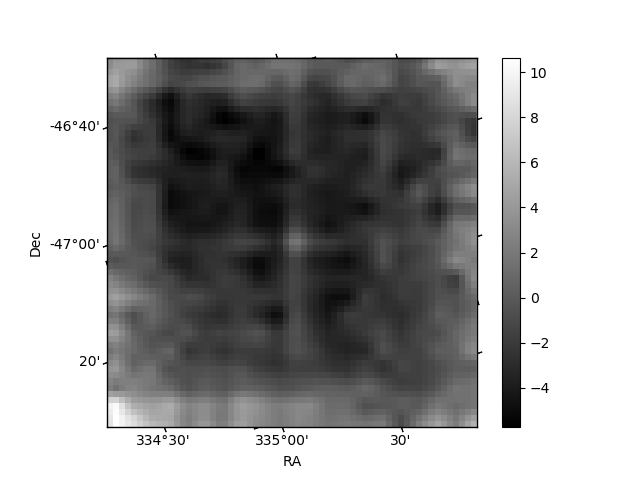
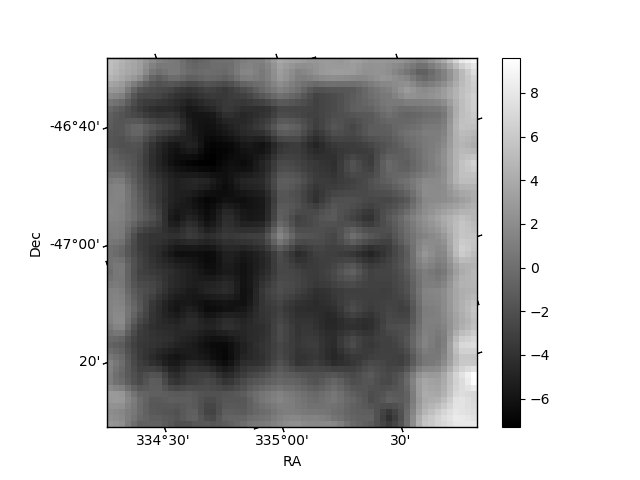
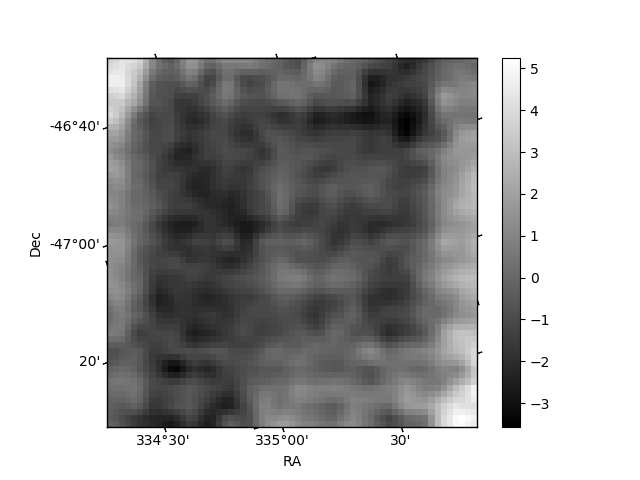
Histogram calculated using DETX and DETY for each event in the final _common_clean file
| Quadrant A | 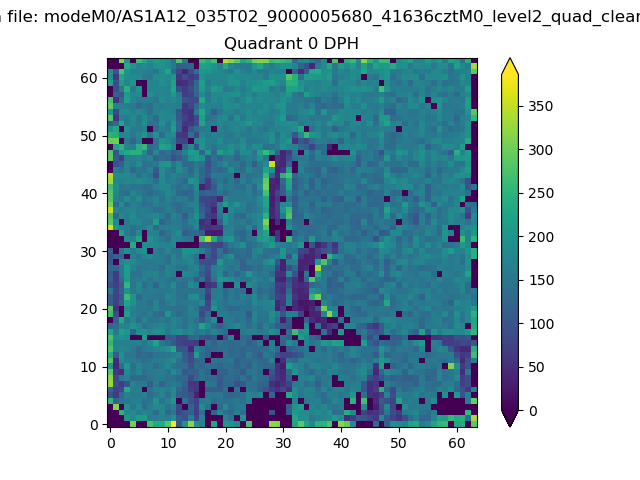 |
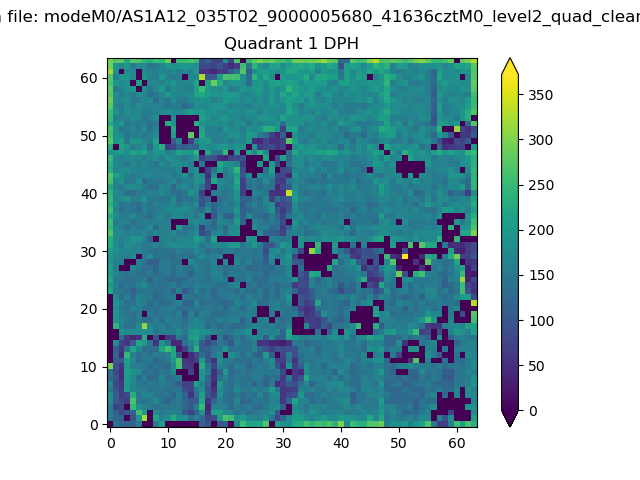 |
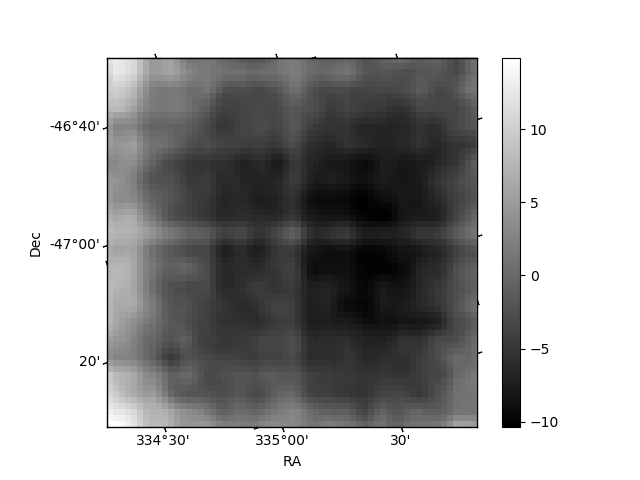
Quadrant B |
|---|---|---|---|
| Quadrant D | 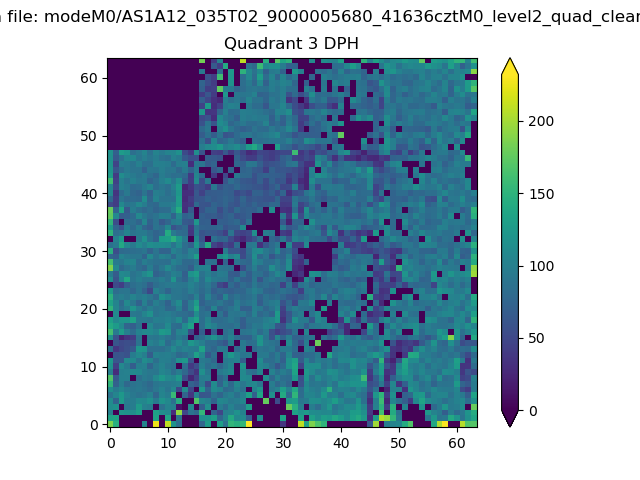 |
 |
Quadrant C |
| Plot type | Count rate plots | Images |
|---|---|---|
| Comparison with Poisson distribution Blue bars denote a histogram of data divided into 1 sec bins. Red curve is a Poisson curve with rate = median count rate of data. |
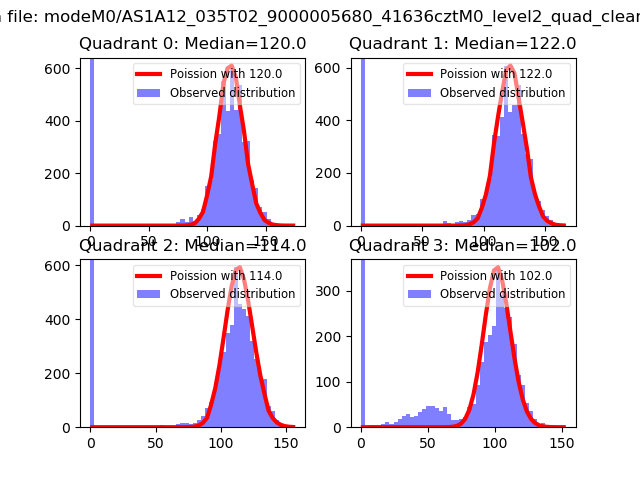 |
 |
| Quadrant-wise count rates Data is divided into 100 sec bins |
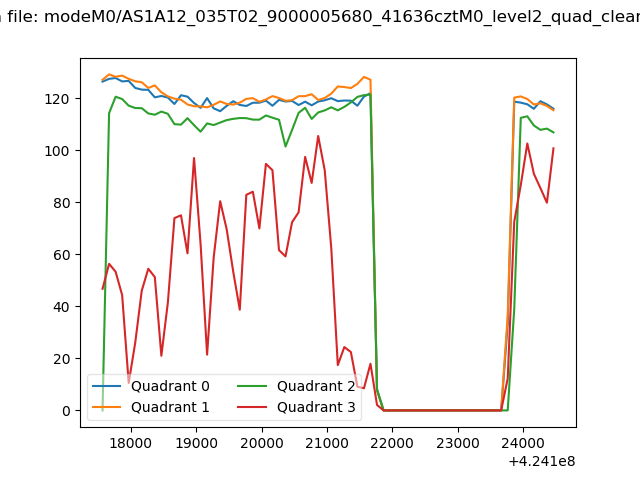 |
|
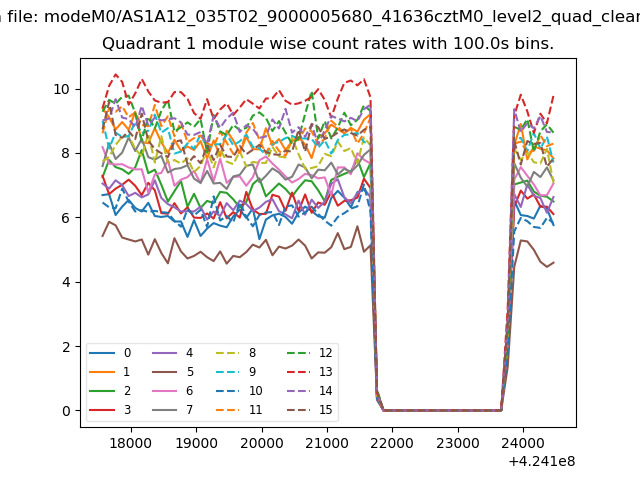
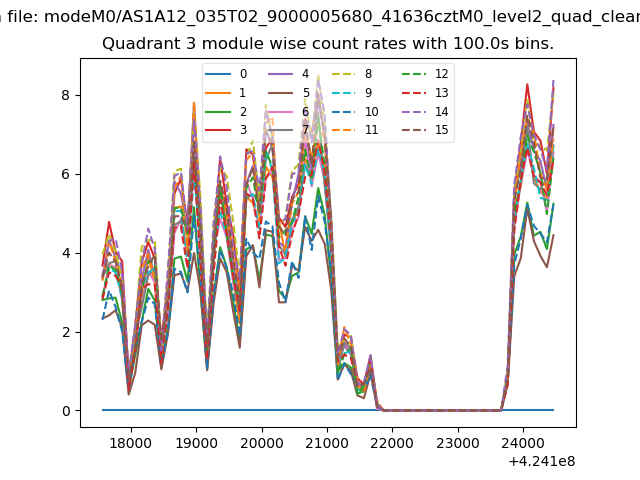
| Module-wise count rates for Quadrant A Data is divided into 100 sec bins |
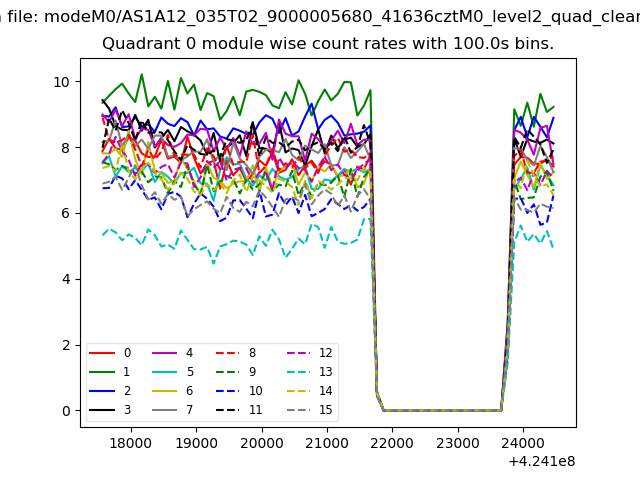 |
 |
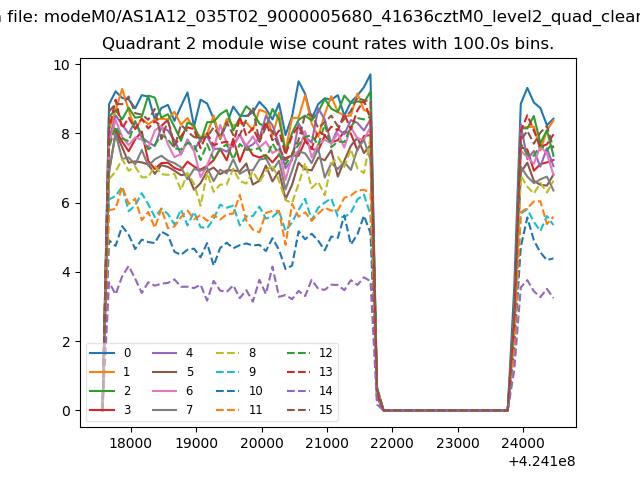
| Module-wise count rates for Quadrant B Data is divided into 100 sec bins |
 |
 |
| Module-wise count rates for Quadrant C Data is divided into 100 sec bins |
 |
 |
| Module-wise count rates for Quadrant D Data is divided into 100 sec bins |
 |
 |
| Parameter | Plot |
|---|---|
| CZT HV Monitor | 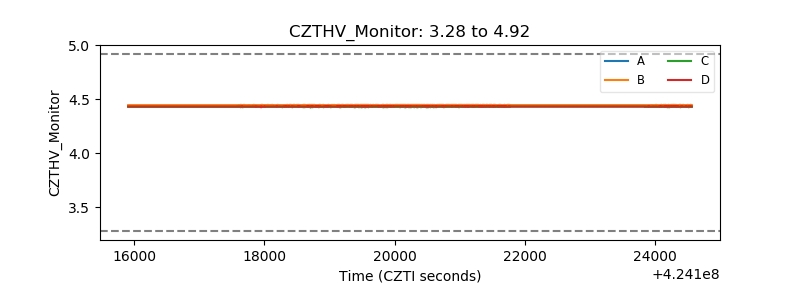 |
| D_VDD | 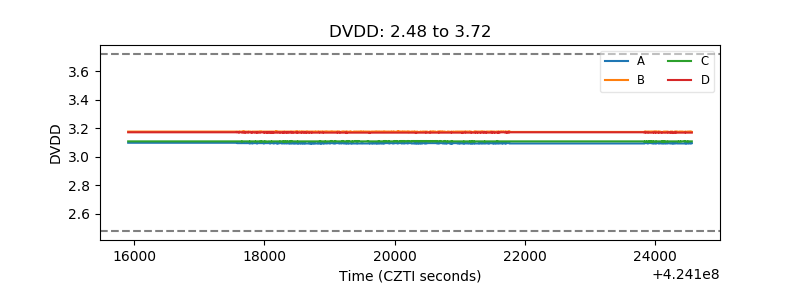 |
| Temperature 1 | 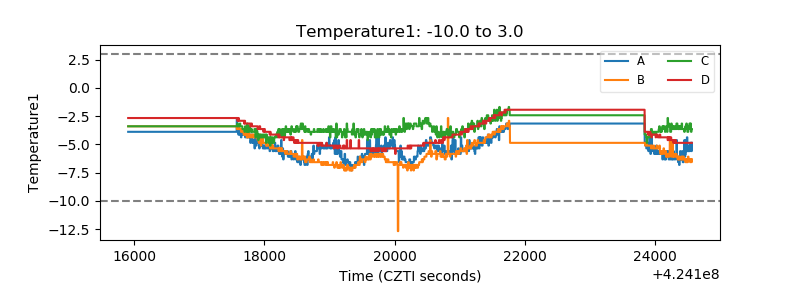 |
| Veto HV Monitor | 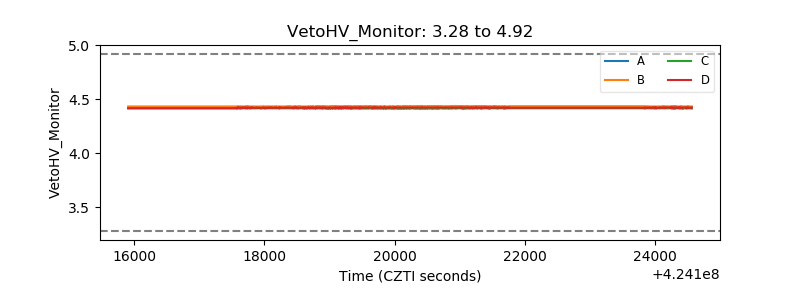 |
| Veto LLD | 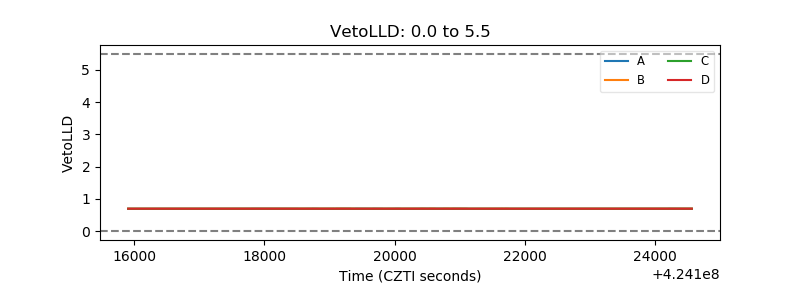 |
| Alpha Counter | 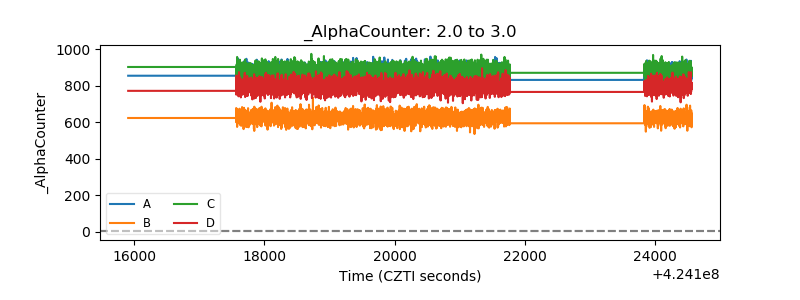 |
| _CPM_Rate | 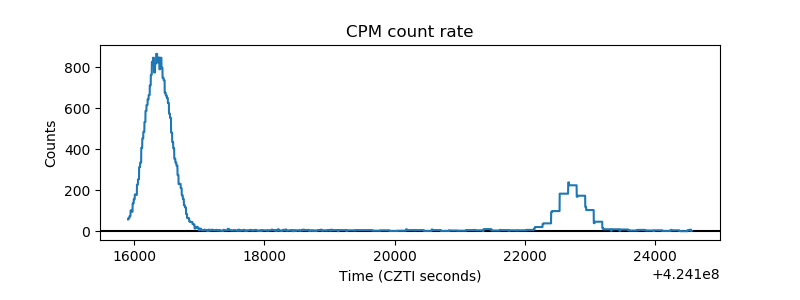 |
| CZT Counter | 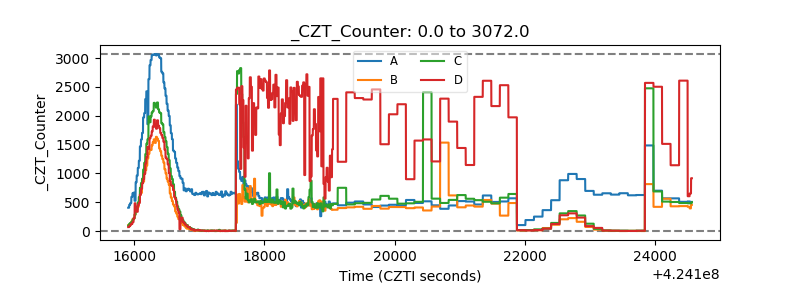 |
| +2.5 Volts monitor | 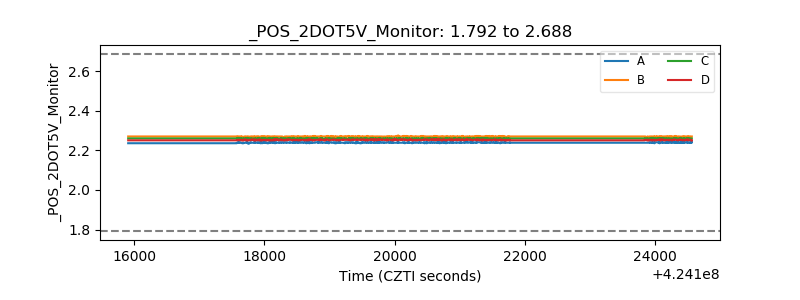 |
| +5 Volts monitor | 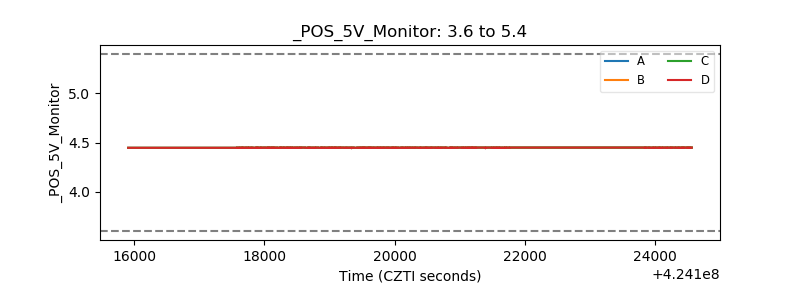 |
| _ROLL_ROT | 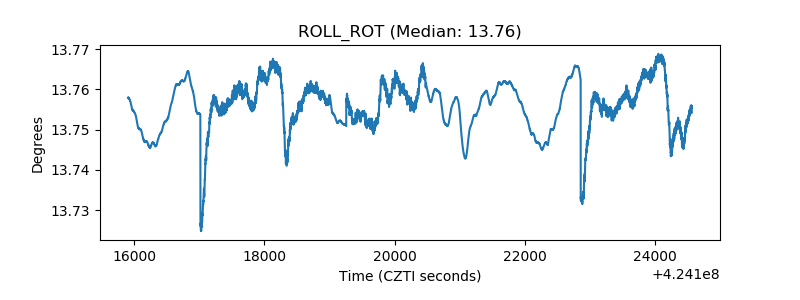 |
| _Roll_DEC |  |
| _Roll_RA | 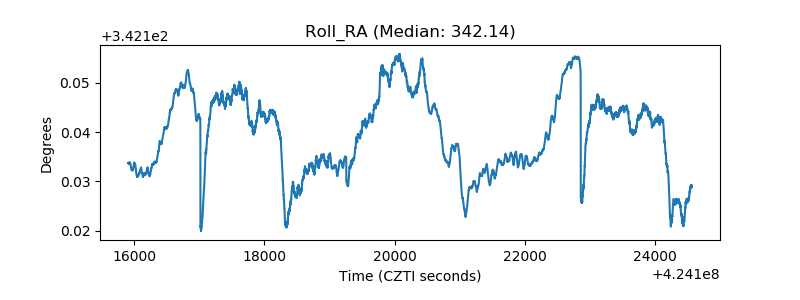 |
| Veto Counter | 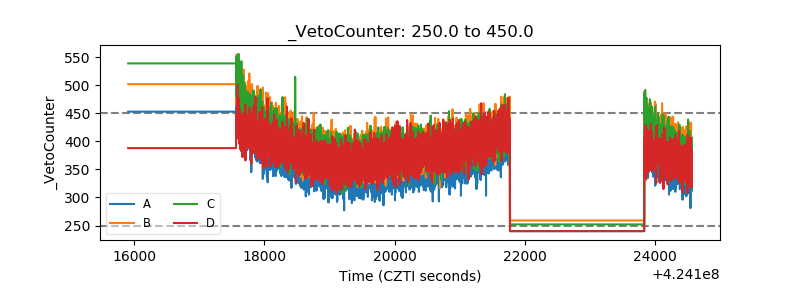 |