| Param | Original file | Final file |
|---|---|---|
| Filename | modeM0/AS1A12_035T02_9000005680_41638cztM0_level2.fits | modeM0/AS1A12_035T02_9000005680_41638cztM0_level2_quad_clean.evt |
| Size (bytes) | 553,841,280 | 92,908,800 |
| Size | 528.2 MB | 88.6 MB |
| Events in quadrant A | 3,222,934 | 671,117 |
| Events in quadrant B | 3,559,027 | 662,574 |
| Events in quadrant C | 3,472,233 | 629,881 |
| Events in quadrant D | 9,782,047 | 430,915 |
| Mode SS | |||
|---|---|---|---|
| Quadrant | BADHDUFLAG | Total packets | Discarded packets |
| A | 0 | 124 | 0 |
| B | 0 | 124 | 0 |
| C | 0 | 124 | 0 |
| D | 0 | 124 | 0 |
| Mode M0 | |||
|---|---|---|---|
| Quadrant | BADHDUFLAG | Total packets | Discarded packets |
| A | 0 | 13229 | 2 |
| B | 0 | 14670 | 2 |
| C | 0 | 13928 | 2 |
| D | 0 | 33217 | 3 |
| Mode M9 | |||
|---|---|---|---|
| Quadrant | BADHDUFLAG | Total packets | Discarded packets |
| A | 0 | 33 | 0 |
| B | 0 | 33 | 0 |
| C | 0 | 33 | 0 |
| D | 0 | 33 | 0 |
| Quadrant | Total seconds | Saturated seconds | Saturation percentage |
|---|---|---|---|
| A | 5992 | 15 | 0.250334% |
| B | 5992 | 216 | 3.604806% |
| C | 5992 | 213 | 3.554740% |
| D | 5992 | 2005 | 33.461282% |
Noise dominated data is calculated using 1-second bins in cleaned event files. If a bin has >2000 counts, and if more than 50% of those come from <1% of pixels, then it is considered to be noise-dominated and hence unusable.
| Quadrant | # 1 sec bins | Bins with >0 counts | Bins with >2000 counts | High rate bins dominated by noise | Noise dominated (total time) | Noise dominated (detector-on time) | Marked lightcurve |
|---|---|---|---|---|---|---|---|
| A | 9279 | 5994 | 11 | 11 | 0.12% | 0.18% | 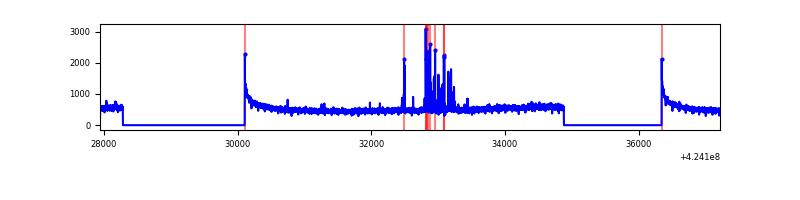 |
| B | 9279 | 5994 | 127 | 127 | 1.37% | 2.12% | 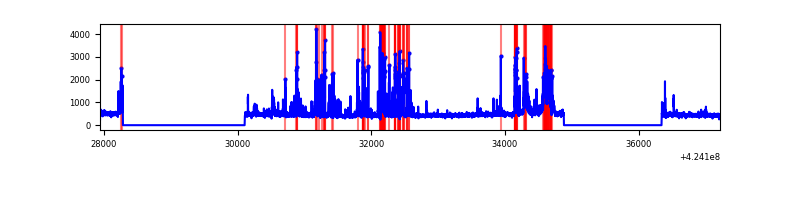 |
| C | 9279 | 5994 | 204 | 204 | 2.20% | 3.40% | 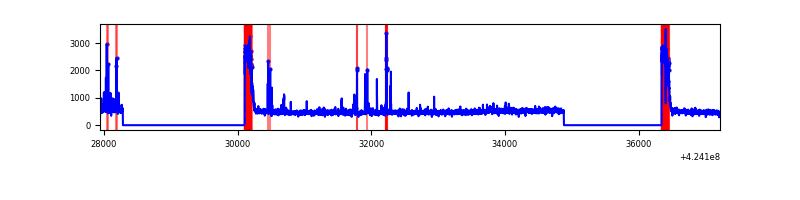 |
| D | 9279 | 5992 | 2021 | 2021 | 21.78% | 33.73% | 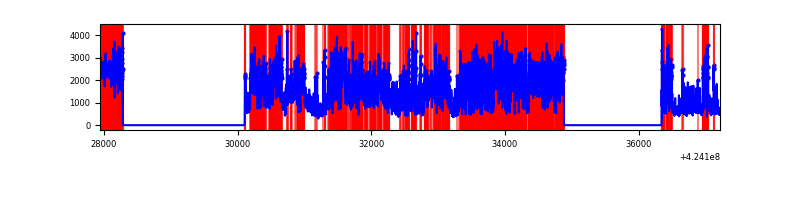 |
Top three noisy pixels from each quadrant. If the there are fewer than three noisy pixels in the level2.evt file, extra rows are filled as -1
| Pixel properties | Quadrant properties | ||||||
|---|---|---|---|---|---|---|---|
| Quadrant | DetID | PixID | Counts | Sigma | Mean | Median | Sigma |
| A | 10 | 83 | 564930 | 4167.63 | 663 | 647 | 135.4 |
| A | 13 | 248 | 86160 | 631.57 | 663 | 647 | 135.4 |
| A | 13 | 254 | 10620 | 73.65 | 663 | 647 | 135.4 |
| B | 4 | 171 | 477118 | 3798.88 | 651 | 631 | 125.4 |
| B | 0 | 186 | 363593 | 2893.78 | 651 | 631 | 125.4 |
| B | 5 | 255 | 101798 | 806.57 | 651 | 631 | 125.4 |
| C | 0 | 10 | 543362 | 3622.72 | 638 | 640 | 149.8 |
| C | 15 | 214 | 239986 | 1597.66 | 638 | 640 | 149.8 |
| C | 14 | 254 | 178012 | 1183.97 | 638 | 640 | 149.8 |
| D | 12 | 79 | 5618355 | 39933.86 | 576 | 559 | 140.7 |
| D | 13 | 249 | 994104 | 7062.57 | 576 | 559 | 140.7 |
| D | 2 | 249 | 562709 | 3996.02 | 576 | 559 | 140.7 |
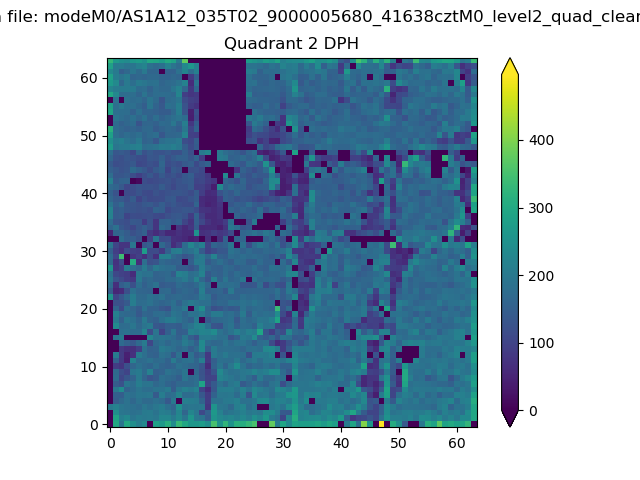
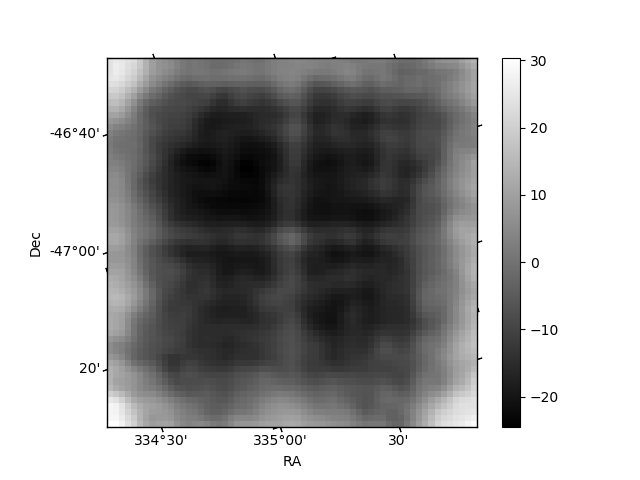
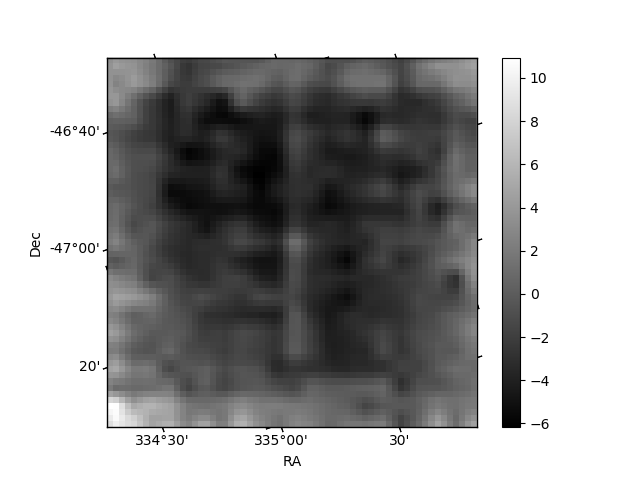
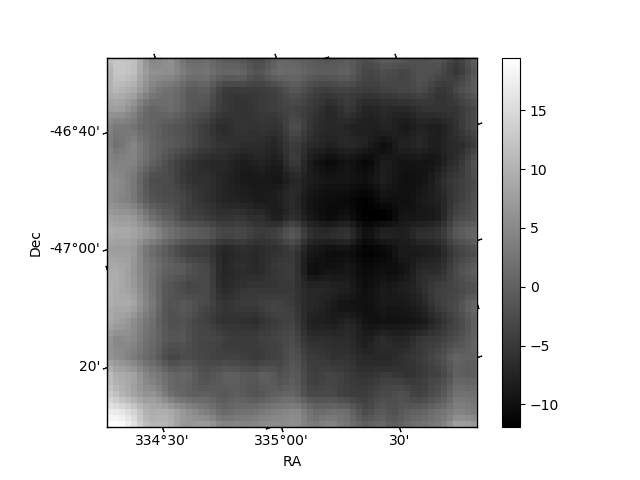
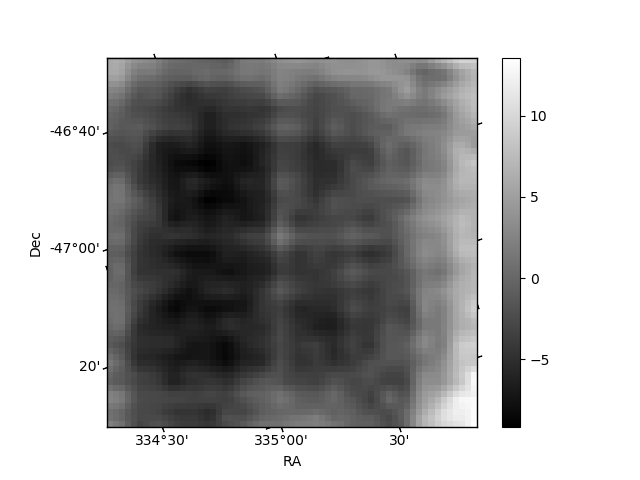
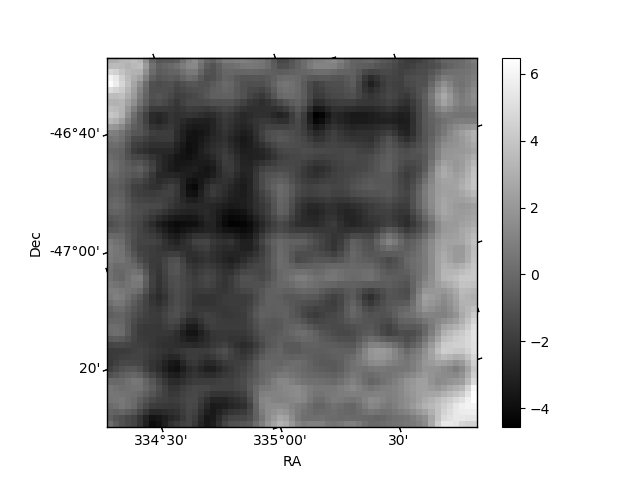
Histogram calculated using DETX and DETY for each event in the final _common_clean file
| Quadrant A | 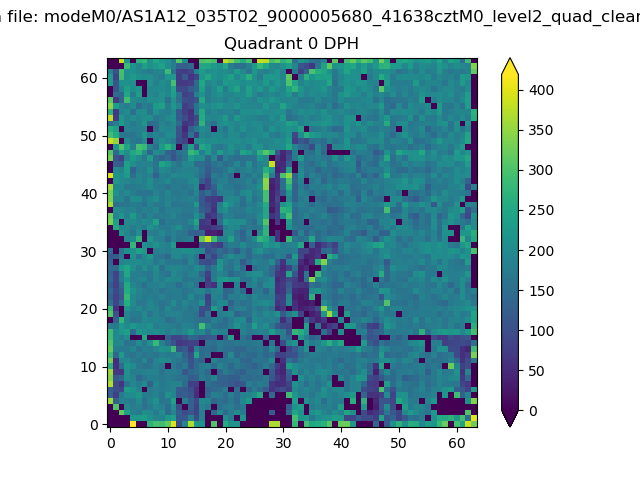 |
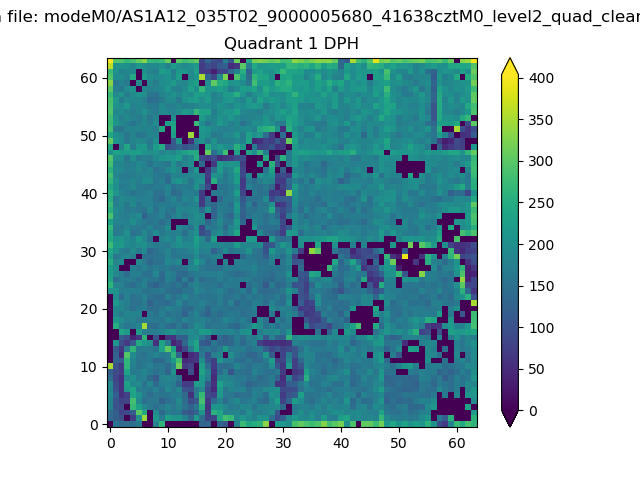 |
Quadrant B |
|---|---|---|---|
| Quadrant D | 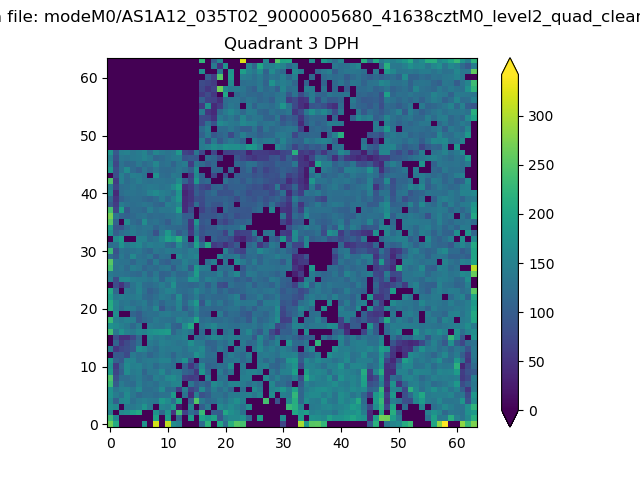 |
 |
Quadrant C |
| Plot type | Count rate plots | Images |
|---|---|---|
| Comparison with Poisson distribution Blue bars denote a histogram of data divided into 1 sec bins. Red curve is a Poisson curve with rate = median count rate of data. |
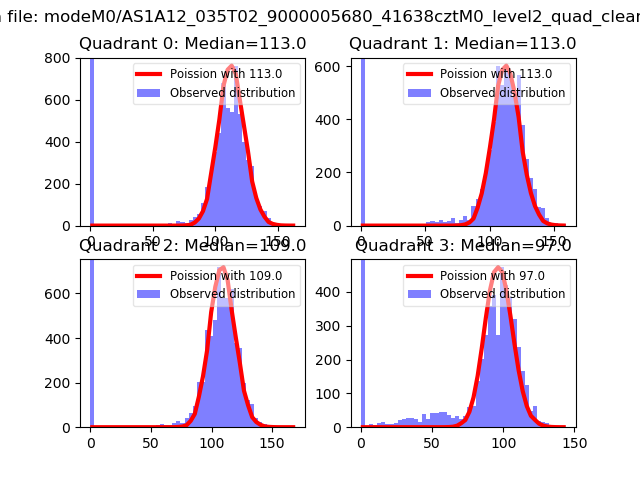 |
 |
| Quadrant-wise count rates Data is divided into 100 sec bins |
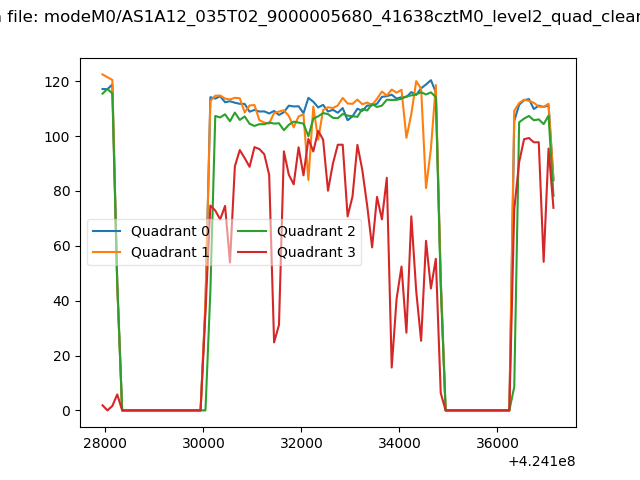 |
|
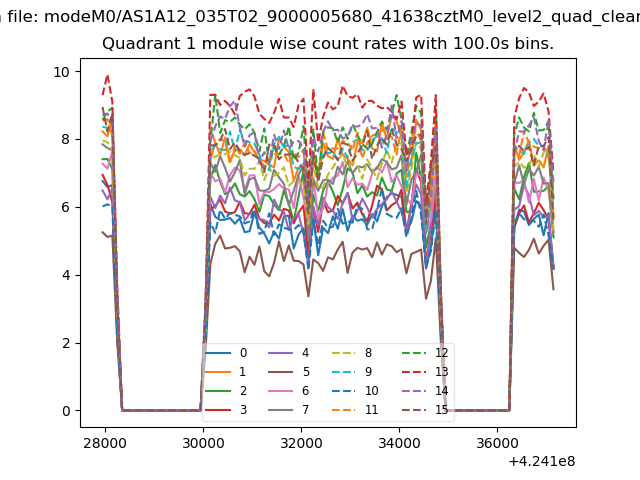
| Module-wise count rates for Quadrant A Data is divided into 100 sec bins |
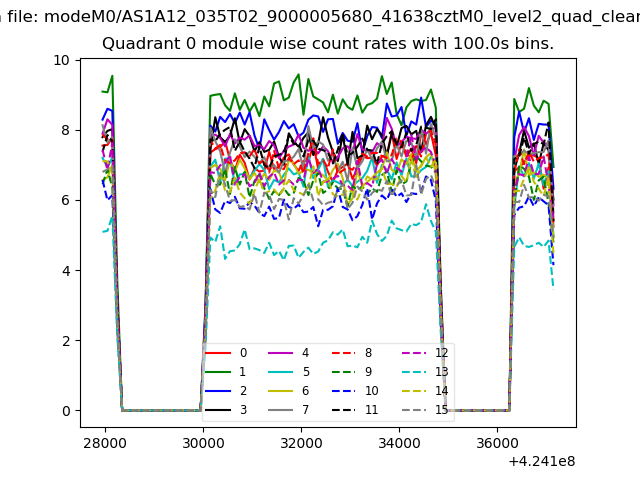 |
 |
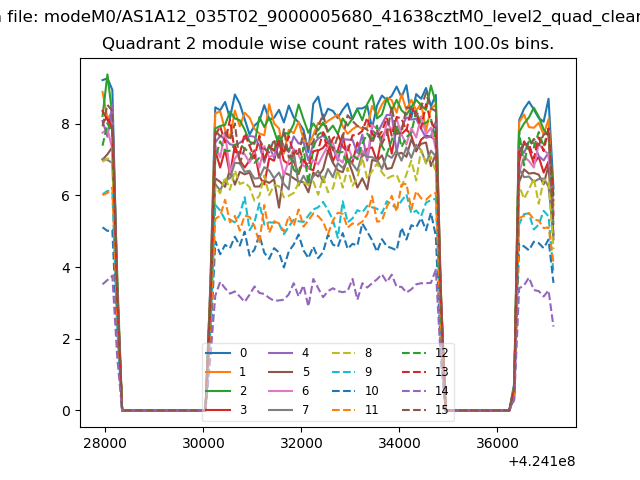
| Module-wise count rates for Quadrant B Data is divided into 100 sec bins |
 |
 |
| Module-wise count rates for Quadrant C Data is divided into 100 sec bins |
 |
 |
| Module-wise count rates for Quadrant D Data is divided into 100 sec bins |
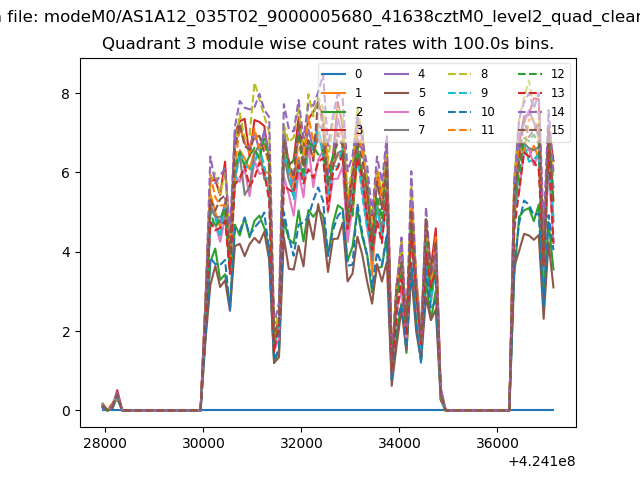 |
 |
| Parameter | Plot |
|---|---|
| CZT HV Monitor | 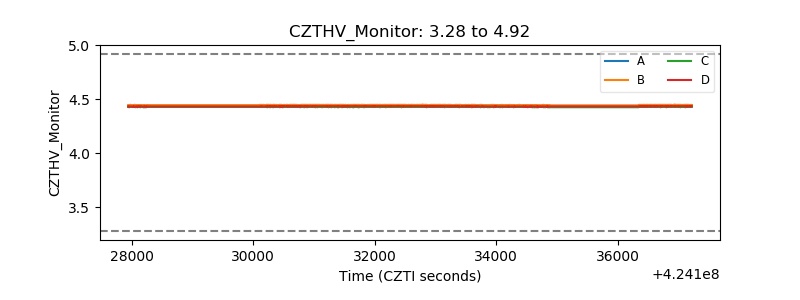 |
| D_VDD |  |
| Temperature 1 | 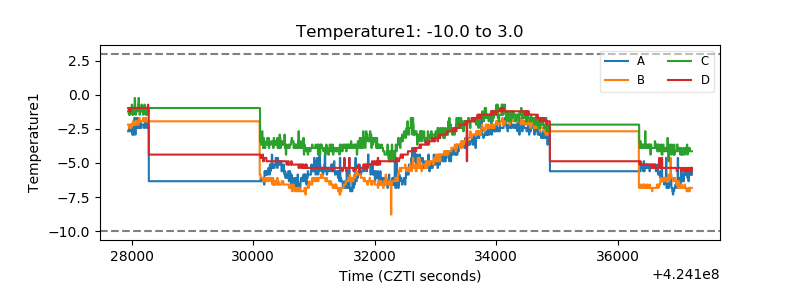 |
| Veto HV Monitor | 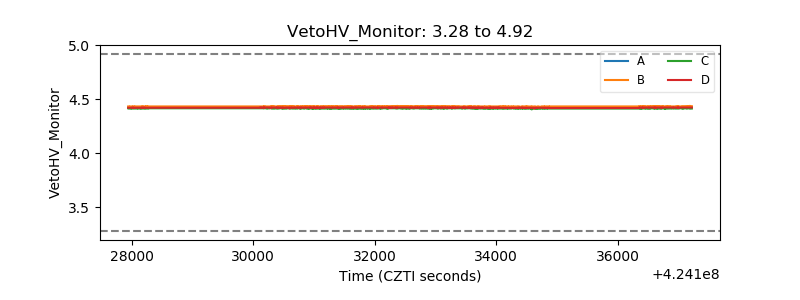 |
| Veto LLD | 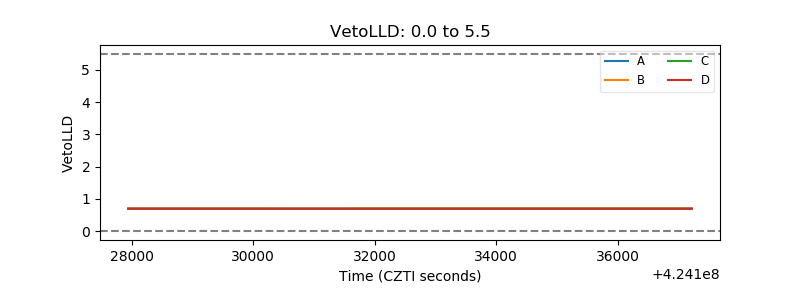 |
| Alpha Counter | 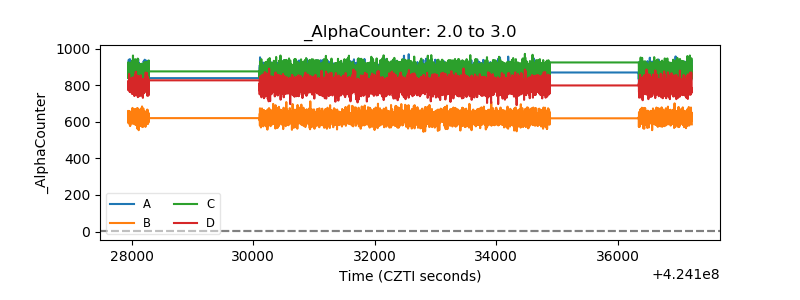 |
| _CPM_Rate | 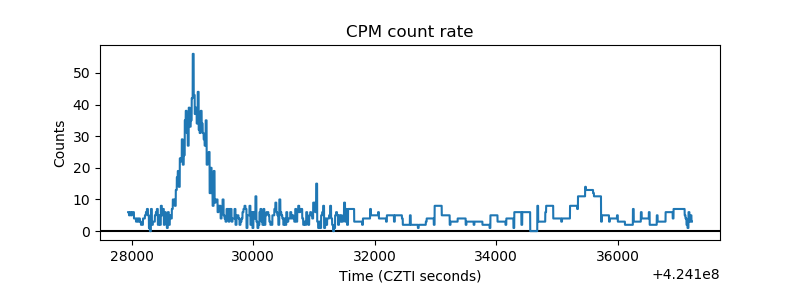 |
| CZT Counter | 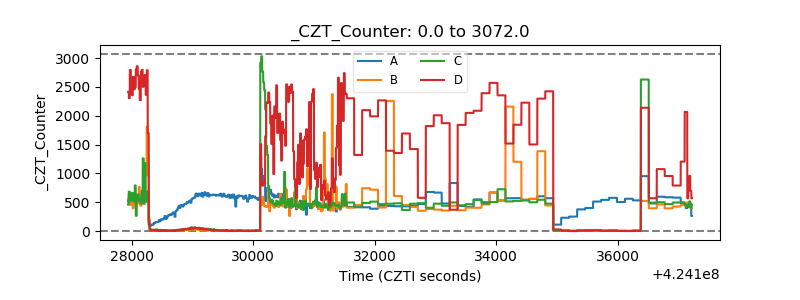 |
| +2.5 Volts monitor |  |
| +5 Volts monitor | 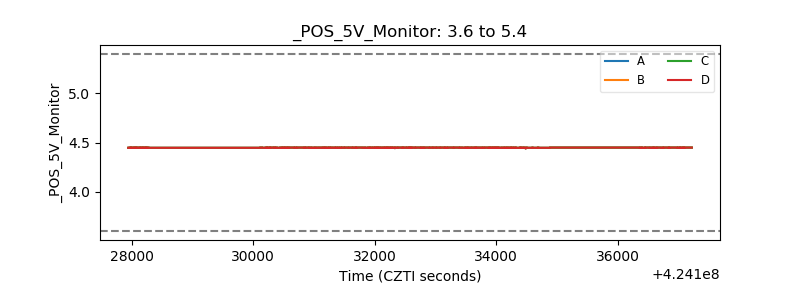 |
| _ROLL_ROT | 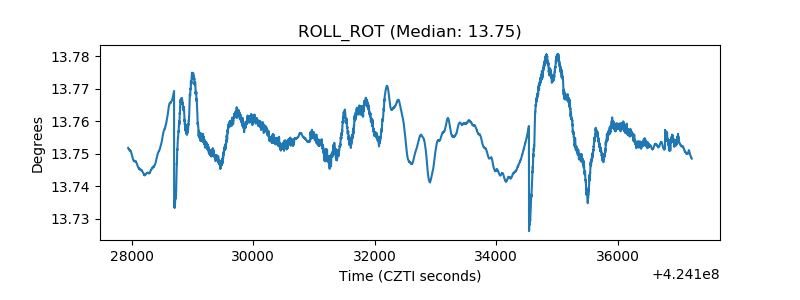 |
| _Roll_DEC | 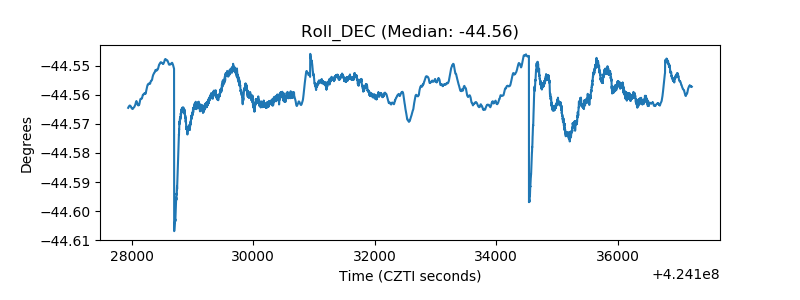 |
| _Roll_RA | 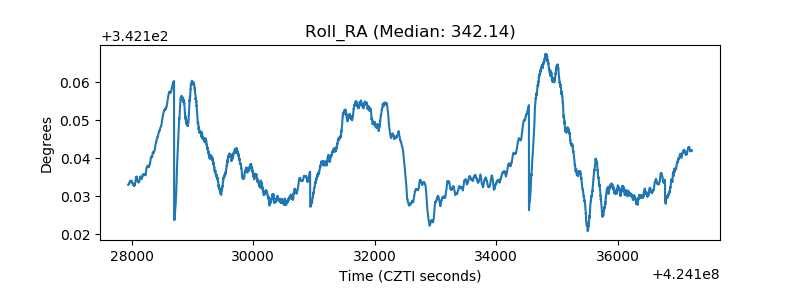 |
| Veto Counter | 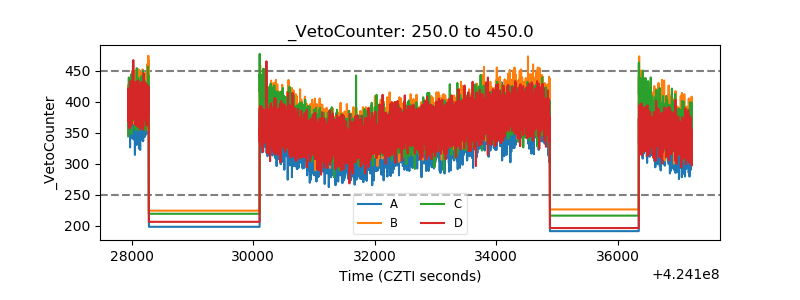 |