| Param | Original file | Final file |
|---|---|---|
| Filename | modeM0/AS1A12_035T02_9000005680_41637cztM0_level2.fits | modeM0/AS1A12_035T02_9000005680_41637cztM0_level2_quad_clean.evt |
| Size (bytes) | 524,139,840 | 79,830,720 |
| Size | 499.9 MB | 76.1 MB |
| Events in quadrant A | 2,779,166 | 599,607 |
| Events in quadrant B | 2,449,596 | 609,567 |
| Events in quadrant C | 3,099,481 | 555,118 |
| Events in quadrant D | 10,662,803 | 282,591 |
| Mode SS | |||
|---|---|---|---|
| Quadrant | BADHDUFLAG | Total packets | Discarded packets |
| A | 0 | 108 | 0 |
| B | 0 | 108 | 0 |
| C | 0 | 108 | 0 |
| D | 0 | 108 | 0 |
| Mode M0 | |||
|---|---|---|---|
| Quadrant | BADHDUFLAG | Total packets | Discarded packets |
| A | 0 | 11451 | 3 |
| B | 0 | 11008 | 2 |
| C | 0 | 12393 | 2 |
| D | 0 | 35323 | 2 |
| Mode M9 | |||
|---|---|---|---|
| Quadrant | BADHDUFLAG | Total packets | Discarded packets |
| A | 0 | 26 | 0 |
| B | 0 | 26 | 0 |
| C | 0 | 26 | 0 |
| D | 0 | 27 | 0 |
| Quadrant | Total seconds | Saturated seconds | Saturation percentage |
|---|---|---|---|
| A | 5286 | 6 | 0.113507% |
| B | 5286 | 21 | 0.397276% |
| C | 5286 | 212 | 4.010594% |
| D | 5286 | 2797 | 52.913356% |
Noise dominated data is calculated using 1-second bins in cleaned event files. If a bin has >2000 counts, and if more than 50% of those come from <1% of pixels, then it is considered to be noise-dominated and hence unusable.
| Quadrant | # 1 sec bins | Bins with >0 counts | Bins with >2000 counts | High rate bins dominated by noise | Noise dominated (total time) | Noise dominated (detector-on time) | Marked lightcurve |
|---|---|---|---|---|---|---|---|
| A | 7110 | 5287 | 3 | 3 | 0.04% | 0.06% | 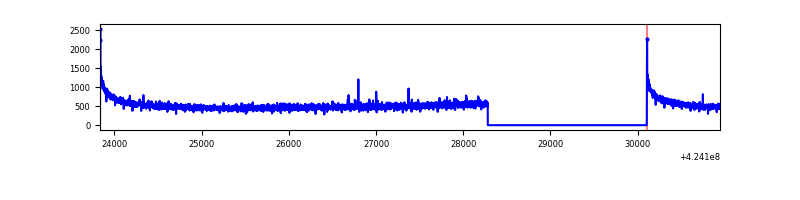 |
| B | 7110 | 5287 | 9 | 9 | 0.13% | 0.17% | 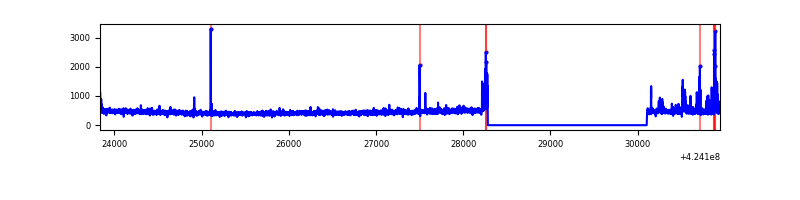 |
| C | 7110 | 5287 | 199 | 199 | 2.80% | 3.76% | 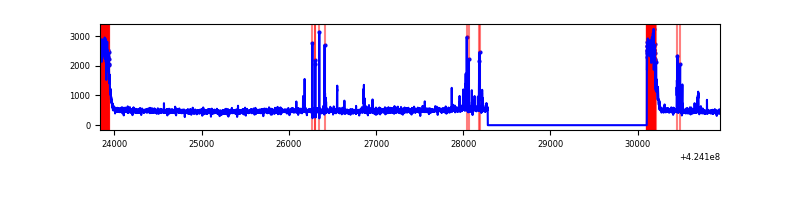 |
| D | 7110 | 5286 | 3002 | 3002 | 42.22% | 56.79% | 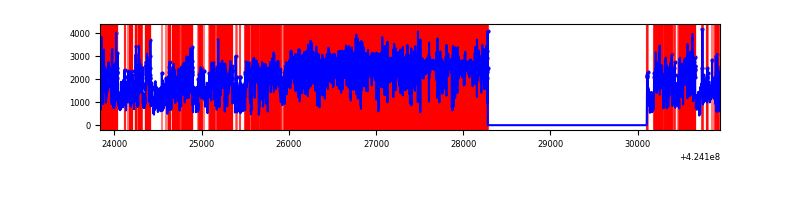 |
Top three noisy pixels from each quadrant. If the there are fewer than three noisy pixels in the level2.evt file, extra rows are filled as -1
| Pixel properties | Quadrant properties | ||||||
|---|---|---|---|---|---|---|---|
| Quadrant | DetID | PixID | Counts | Sigma | Mean | Median | Sigma |
| A | 10 | 83 | 513247 | 4315.77 | 580 | 569 | 118.8 |
| A | 2 | 79 | 12493 | 100.38 | 580 | 569 | 118.8 |
| A | 13 | 254 | 10413 | 82.87 | 580 | 569 | 118.8 |
| B | 4 | 171 | 97269 | 868.83 | 577 | 562 | 111.3 |
| B | 0 | 186 | 32354 | 285.63 | 577 | 562 | 111.3 |
| B | 5 | 255 | 22812 | 199.9 | 577 | 562 | 111.3 |
| C | 0 | 10 | 523723 | 4020.73 | 557 | 561 | 130.1 |
| C | 15 | 214 | 213803 | 1638.86 | 557 | 561 | 130.1 |
| C | 14 | 254 | 124399 | 951.75 | 557 | 561 | 130.1 |
| D | 12 | 79 | 7990943 | 69768.97 | 459 | 445 | 114.5 |
| D | 13 | 249 | 546246 | 4765.66 | 459 | 445 | 114.5 |
| D | 2 | 249 | 142832 | 1243.25 | 459 | 445 | 114.5 |
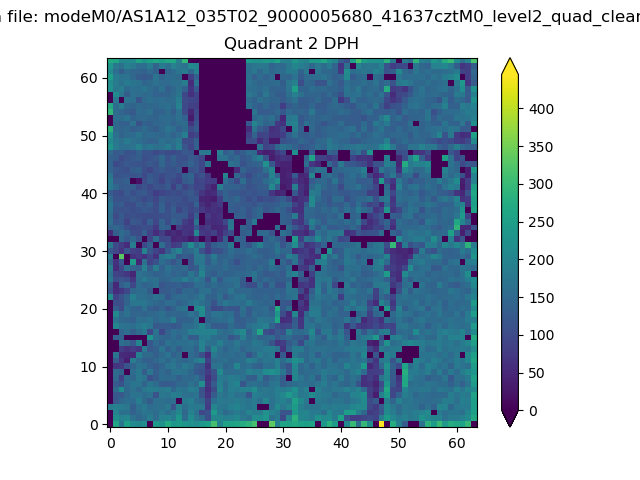
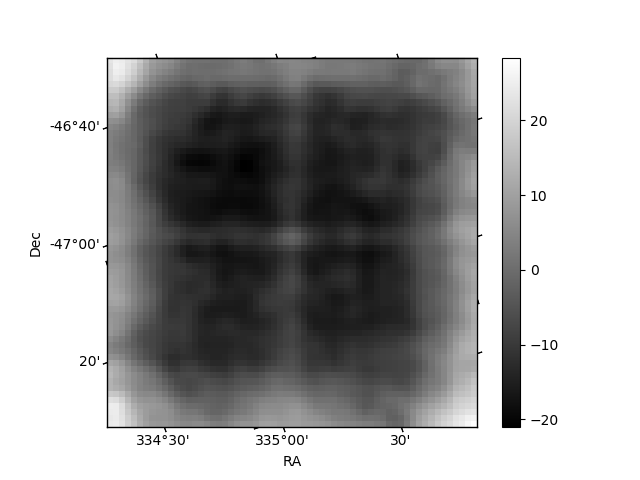
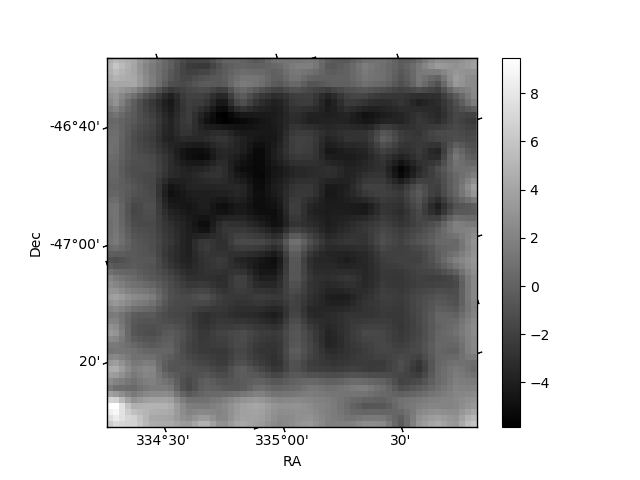
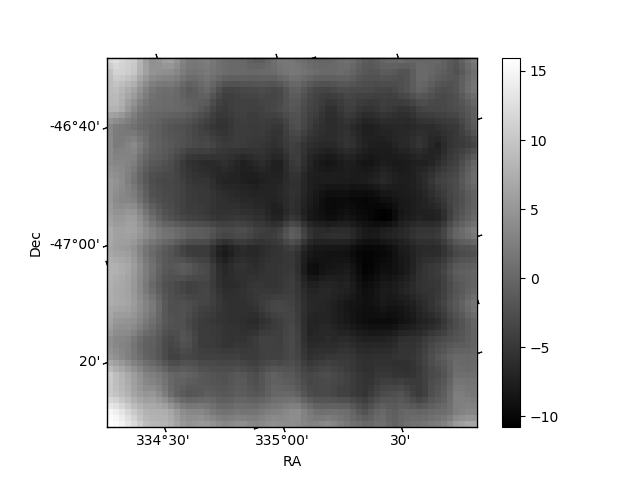
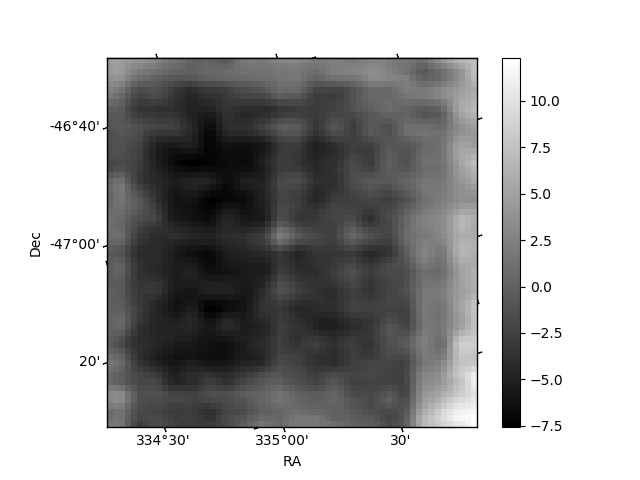
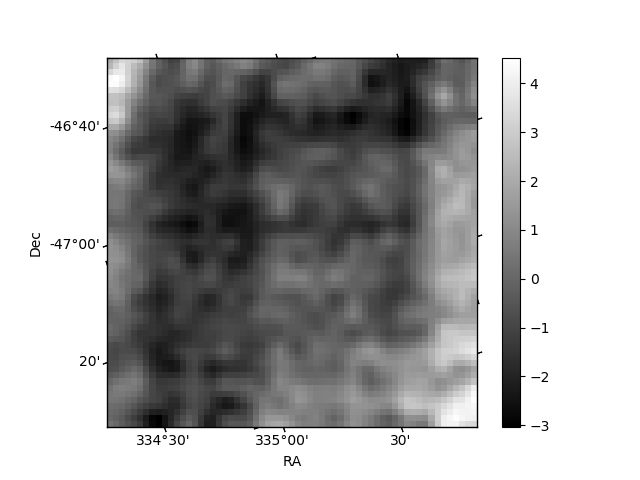
Histogram calculated using DETX and DETY for each event in the final _common_clean file
| Quadrant A | 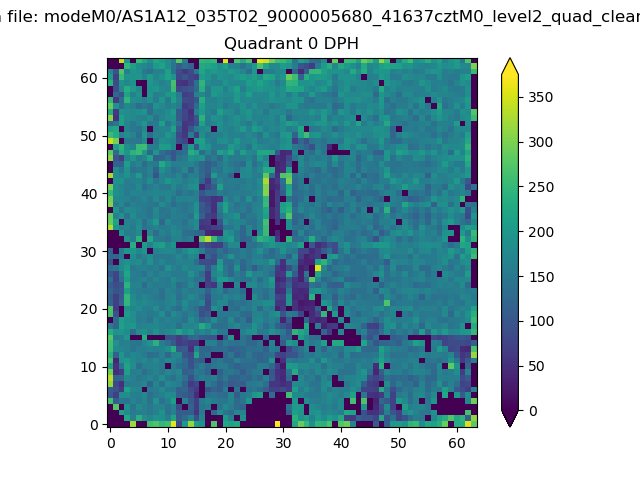 |
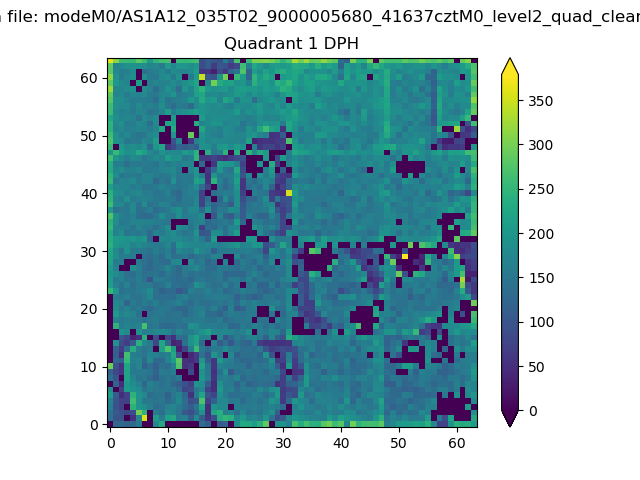 |
Quadrant B |
|---|---|---|---|
| Quadrant D | 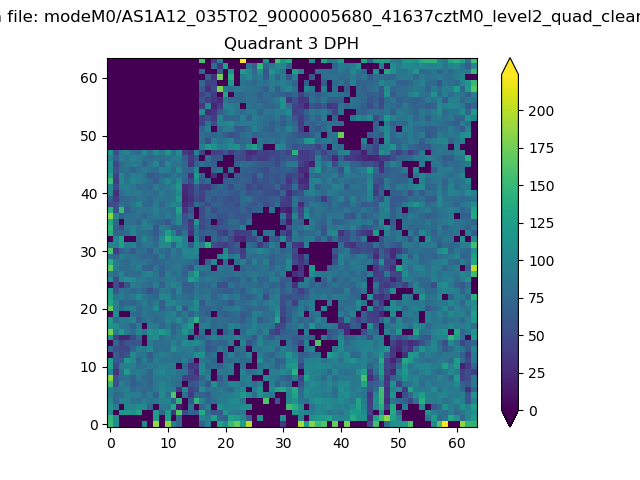 |
 |
Quadrant C |
| Plot type | Count rate plots | Images |
|---|---|---|
| Comparison with Poisson distribution Blue bars denote a histogram of data divided into 1 sec bins. Red curve is a Poisson curve with rate = median count rate of data. |
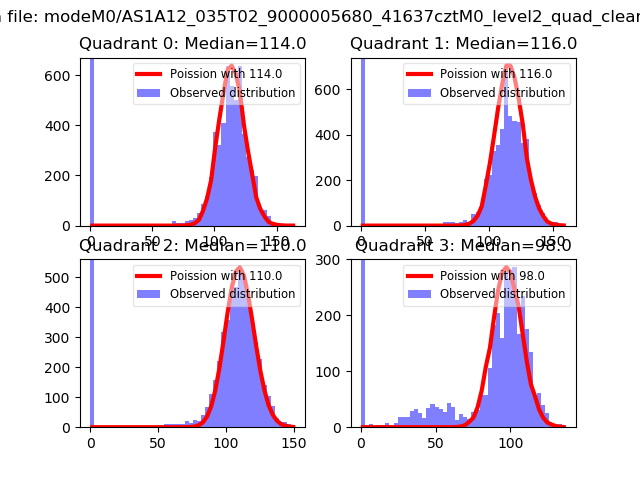 |
 |
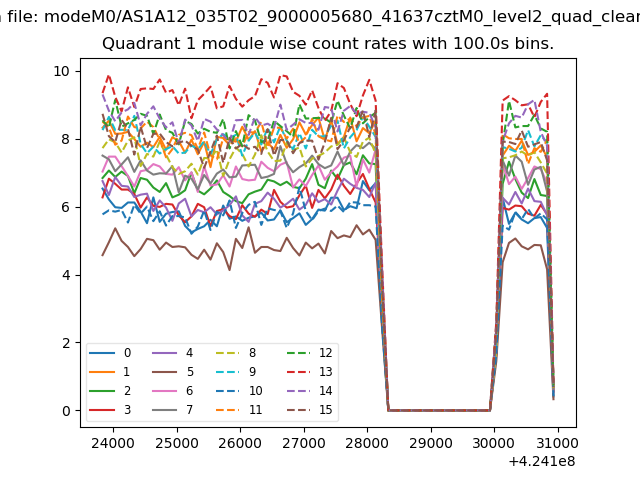
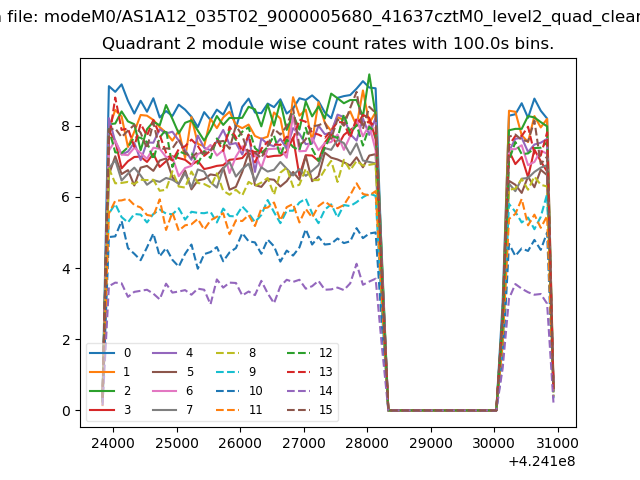
| Quadrant-wise count rates Data is divided into 100 sec bins |
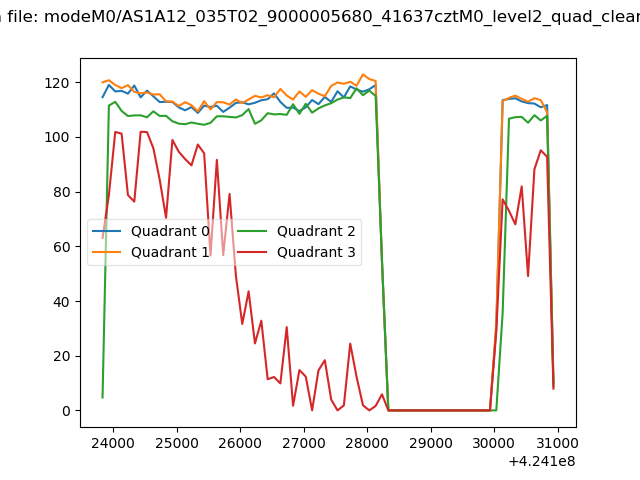 |
|
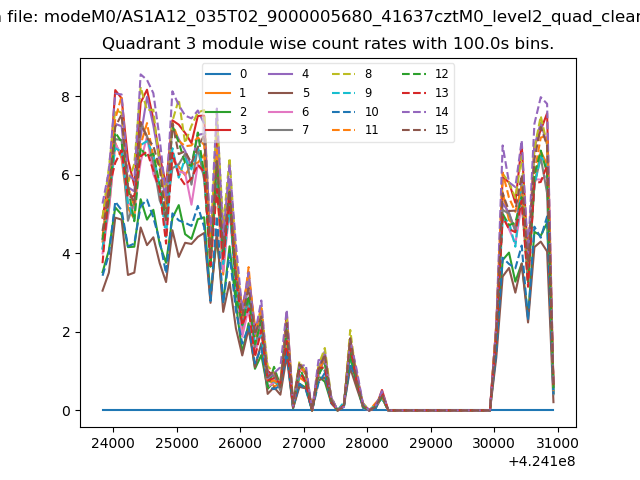
| Module-wise count rates for Quadrant A Data is divided into 100 sec bins |
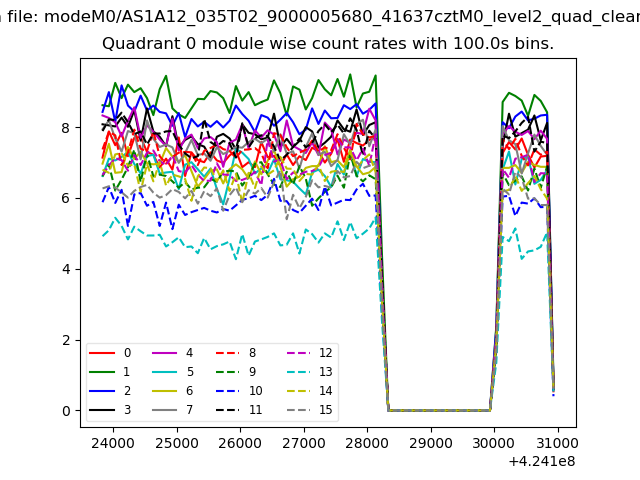 |
 |
| Module-wise count rates for Quadrant B Data is divided into 100 sec bins |
 |
 |
| Module-wise count rates for Quadrant C Data is divided into 100 sec bins |
 |
 |
| Module-wise count rates for Quadrant D Data is divided into 100 sec bins |
 |
 |
| Parameter | Plot |
|---|---|
| CZT HV Monitor | 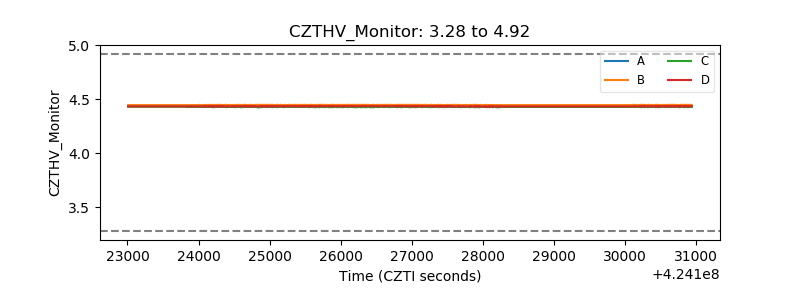 |
| D_VDD | 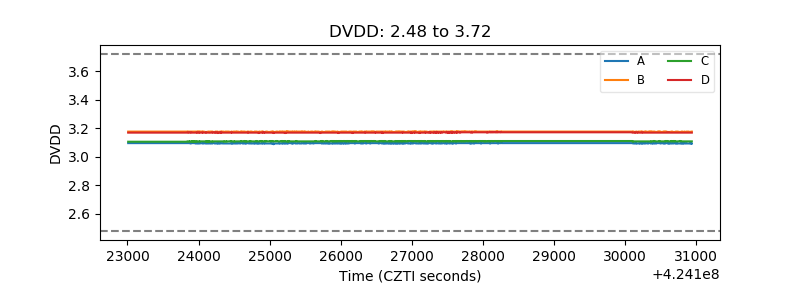 |
| Temperature 1 | 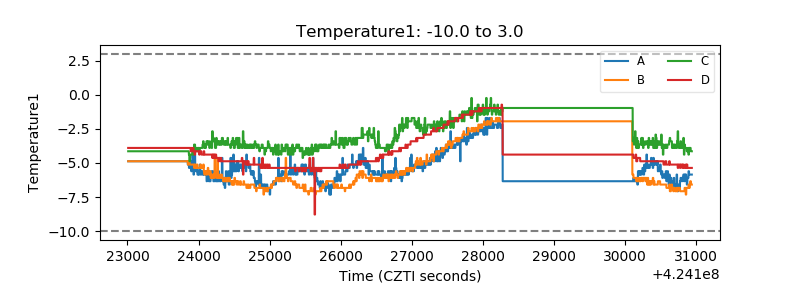 |
| Veto HV Monitor | 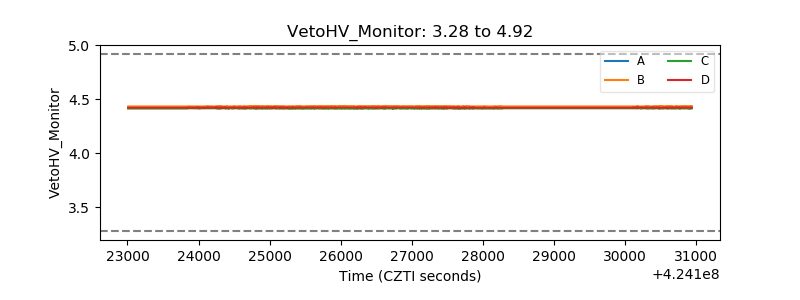 |
| Veto LLD | 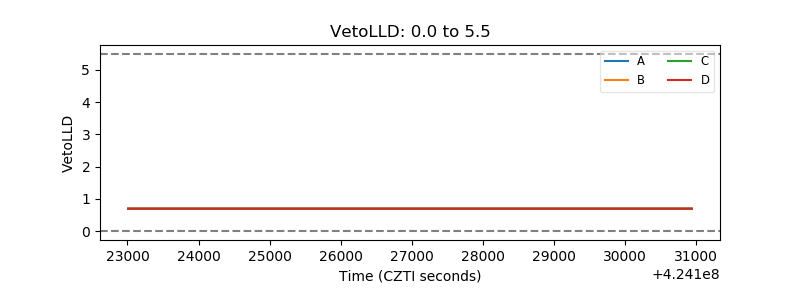 |
| Alpha Counter | 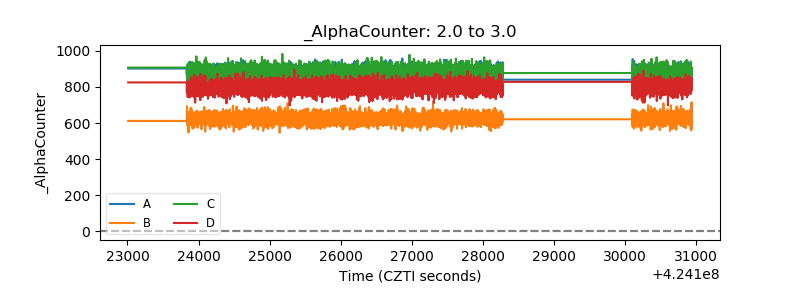 |
| _CPM_Rate | 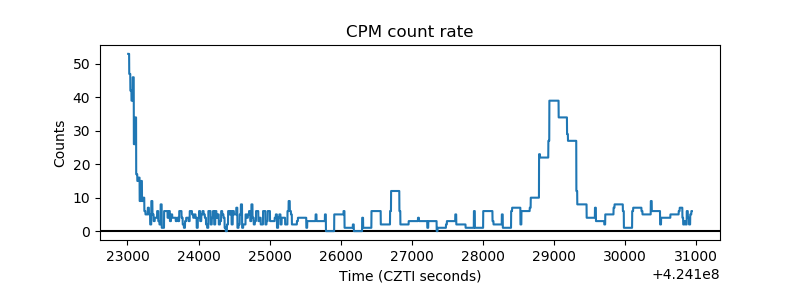 |
| CZT Counter | 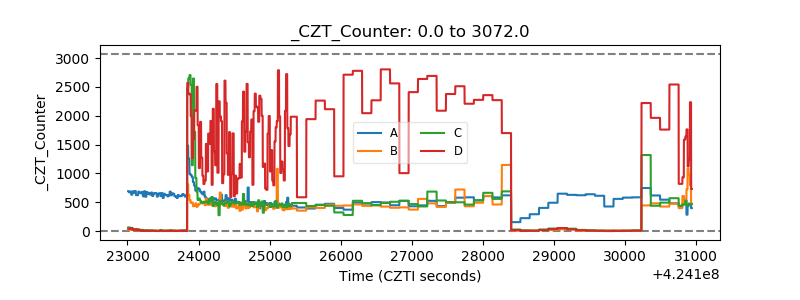 |
| +2.5 Volts monitor | 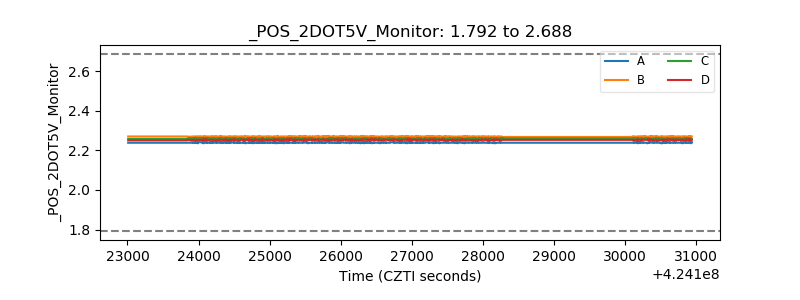 |
| +5 Volts monitor | 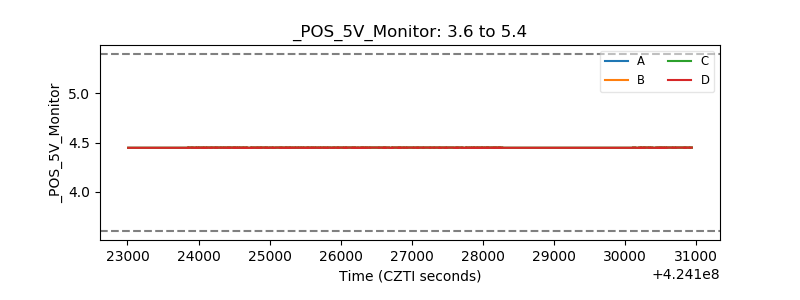 |
| _ROLL_ROT | 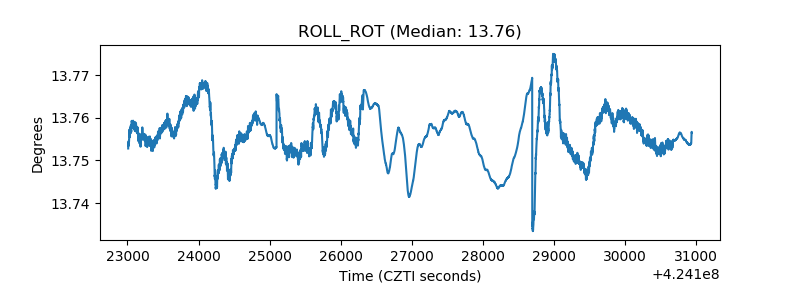 |
| _Roll_DEC | 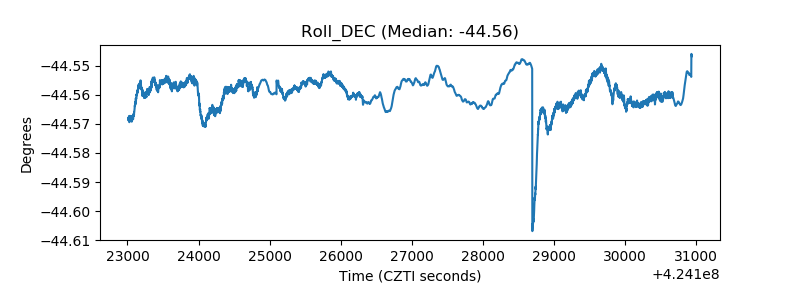 |
| _Roll_RA | 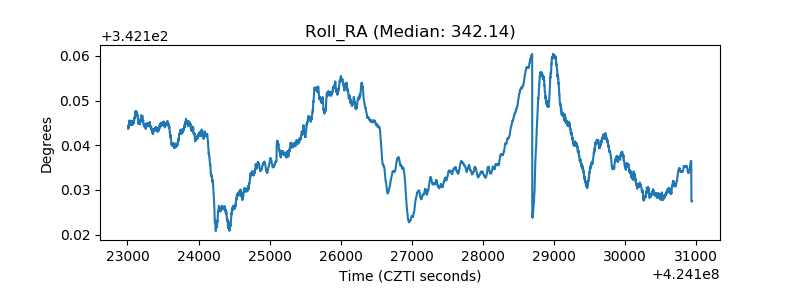 |
| Veto Counter | 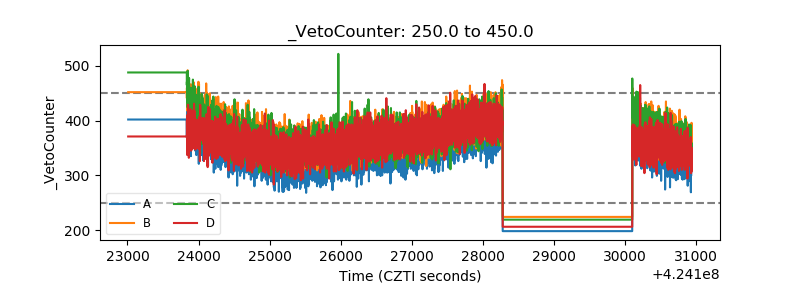 |