| Param | Original file | Final file |
|---|---|---|
| Filename | modeM0/AS1T05_116T01_9000005682_41639cztM0_level2.fits | modeM0/AS1T05_116T01_9000005682_41639cztM0_level2_quad_clean.evt |
| Size (bytes) | 137,142,720 | 27,918,720 |
| Size | 130.8 MB | 26.6 MB |
| Events in quadrant A | 994,586 | 192,624 |
| Events in quadrant B | 1,123,293 | 185,360 |
| Events in quadrant C | 1,101,198 | 181,573 |
| Events in quadrant D | 1,719,068 | 158,177 |
| Mode M0 | |||
|---|---|---|---|
| Quadrant | BADHDUFLAG | Total packets | Discarded packets |
| A | 0 | 4021 | 2 |
| B | 0 | 4566 | 1 |
| C | 0 | 4318 | 1 |
| D | 0 | 6374 | 1 |
| Mode M9 | |||
|---|---|---|---|
| Quadrant | BADHDUFLAG | Total packets | Discarded packets |
| A | 0 | 14 | 0 |
| B | 0 | 14 | 0 |
| C | 0 | 14 | 0 |
| D | 0 | 14 | 0 |
| Mode SS | |||
|---|---|---|---|
| Quadrant | BADHDUFLAG | Total packets | Discarded packets |
| A | 0 | 36 | 0 |
| B | 0 | 36 | 0 |
| C | 0 | 36 | 0 |
| D | 0 | 36 | 0 |
| Quadrant | Total seconds | Saturated seconds | Saturation percentage |
|---|---|---|---|
| A | 1747 | 9 | 0.515169% |
| B | 1747 | 127 | 7.269605% |
| C | 1747 | 90 | 5.151689% |
| D | 1747 | 260 | 14.882656% |
Noise dominated data is calculated using 1-second bins in cleaned event files. If a bin has >2000 counts, and if more than 50% of those come from <1% of pixels, then it is considered to be noise-dominated and hence unusable.
| Quadrant | # 1 sec bins | Bins with >0 counts | Bins with >2000 counts | High rate bins dominated by noise | Noise dominated (total time) | Noise dominated (detector-on time) | Marked lightcurve |
|---|---|---|---|---|---|---|---|
| A | 3058 | 1748 | 4 | 4 | 0.13% | 0.23% | 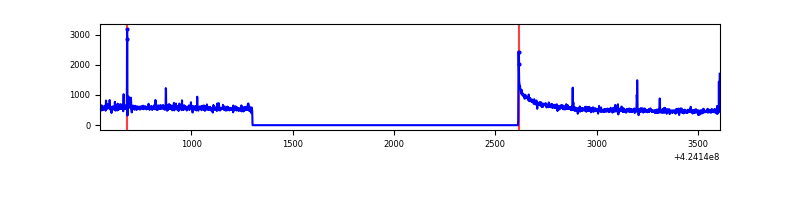 |
| B | 3058 | 1748 | 64 | 64 | 2.09% | 3.66% | 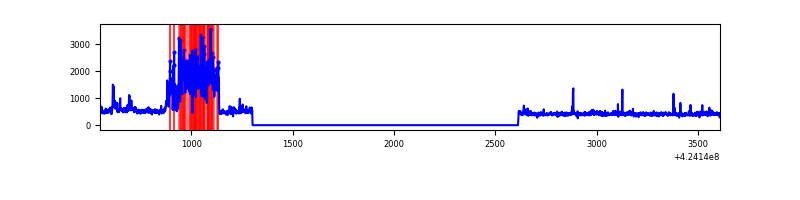 |
| C | 3058 | 1748 | 88 | 88 | 2.88% | 5.03% | 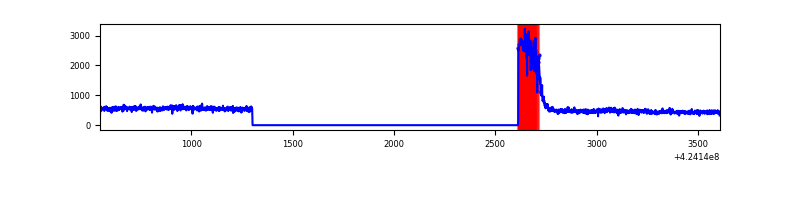 |
| D | 3058 | 1748 | 214 | 214 | 7.00% | 12.24% | 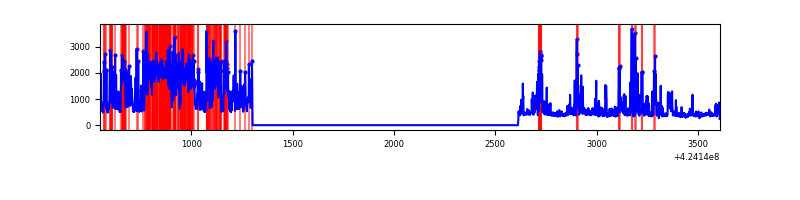 |
Top three noisy pixels from each quadrant. If the there are fewer than three noisy pixels in the level2.evt file, extra rows are filled as -1
| Pixel properties | Quadrant properties | ||||||
|---|---|---|---|---|---|---|---|
| Quadrant | DetID | PixID | Counts | Sigma | Mean | Median | Sigma |
| A | 10 | 83 | 213468 | 5095.78 | 195 | 191 | 41.9 |
| A | 2 | 79 | 19418 | 459.39 | 195 | 191 | 41.9 |
| A | 13 | 248 | 4105 | 93.52 | 195 | 191 | 41.9 |
| B | 0 | 186 | 325863 | 8243.42 | 191 | 186 | 39.5 |
| B | 0 | 190 | 17014 | 425.94 | 191 | 186 | 39.5 |
| B | 4 | 171 | 14262 | 356.29 | 191 | 186 | 39.5 |
| C | 0 | 10 | 264319 | 5637.36 | 190 | 191 | 46.9 |
| C | 15 | 214 | 73415 | 1562.84 | 190 | 191 | 46.9 |
| C | 0 | 15 | 22076 | 467.1 | 190 | 191 | 46.9 |
| D | 12 | 79 | 702740 | 14948.79 | 187 | 181 | 47.0 |
| D | 2 | 249 | 130045 | 2763.2 | 187 | 181 | 47.0 |
| D | 13 | 249 | 76570 | 1625.38 | 187 | 181 | 47.0 |
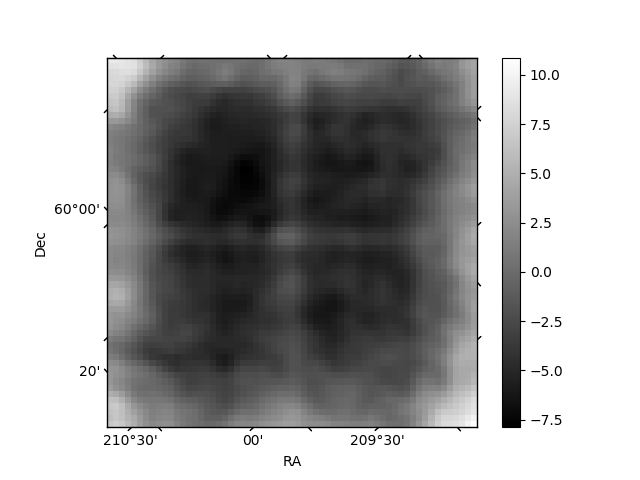
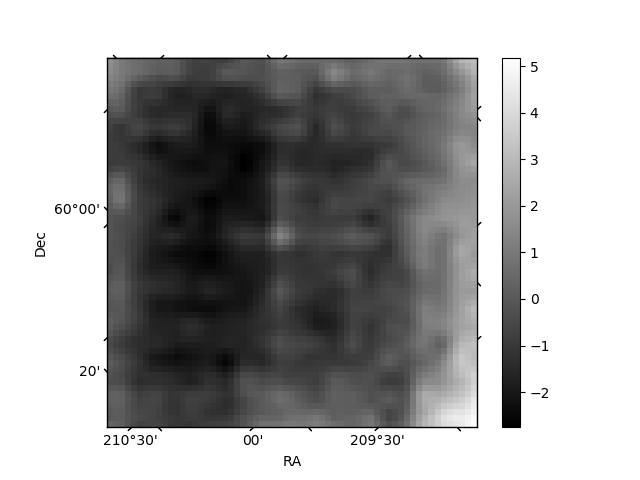
Histogram calculated using DETX and DETY for each event in the final _common_clean file
| Quadrant A | 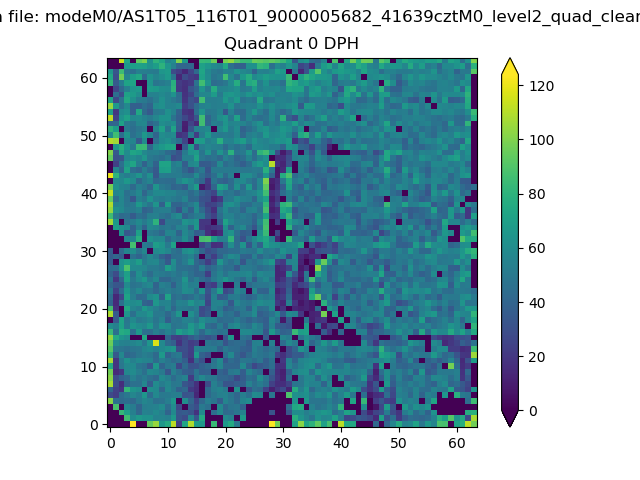 |
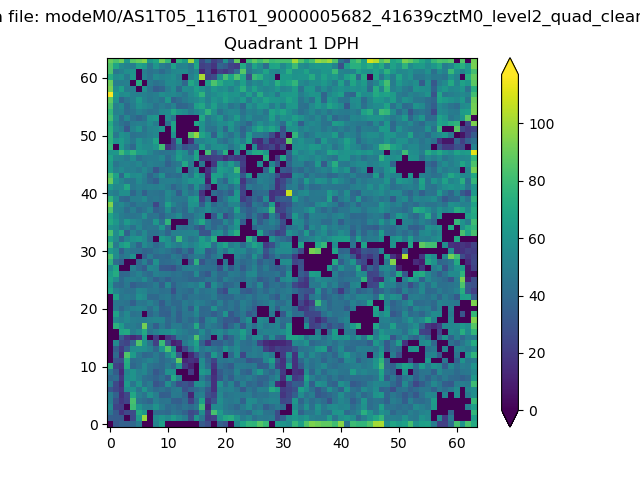 |
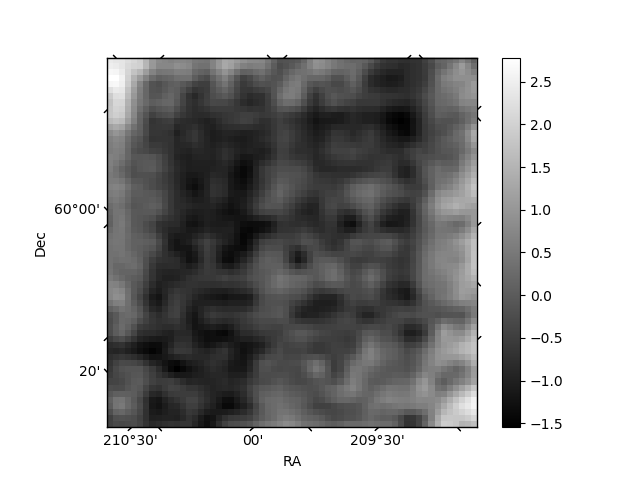
Quadrant B |
|---|---|---|---|
| Quadrant D | 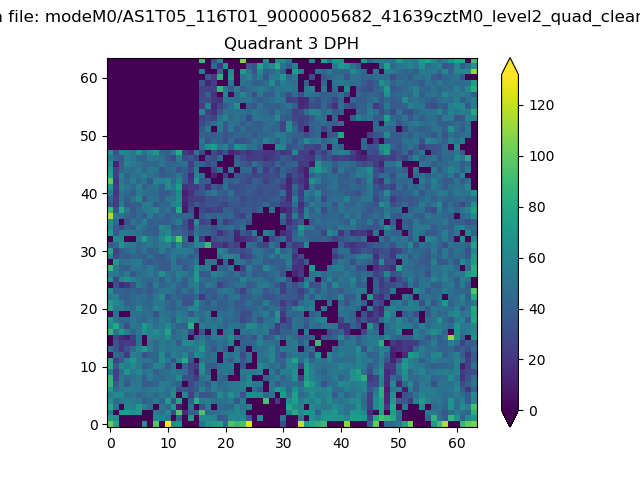 |
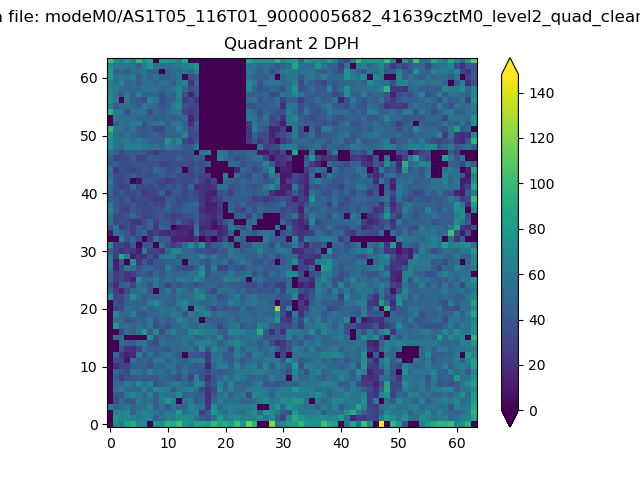 |
Quadrant C |
| Plot type | Count rate plots | Images |
|---|---|---|
| Comparison with Poisson distribution Blue bars denote a histogram of data divided into 1 sec bins. Red curve is a Poisson curve with rate = median count rate of data. |
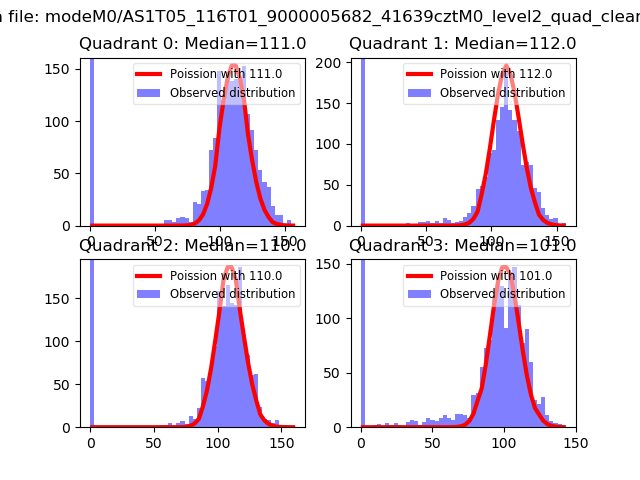 |
 |
| Quadrant-wise count rates Data is divided into 100 sec bins |
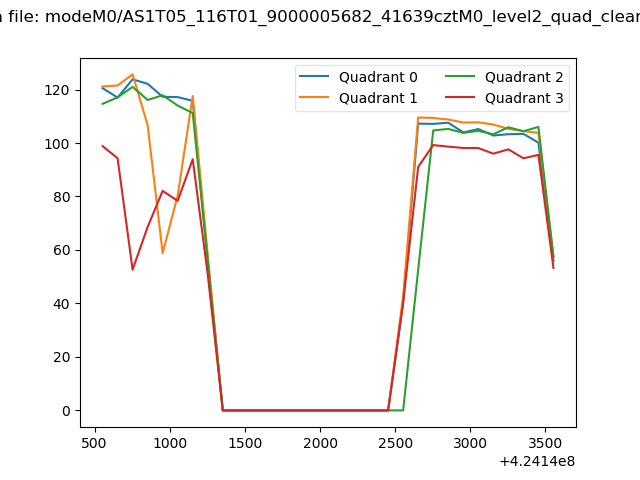 |
|
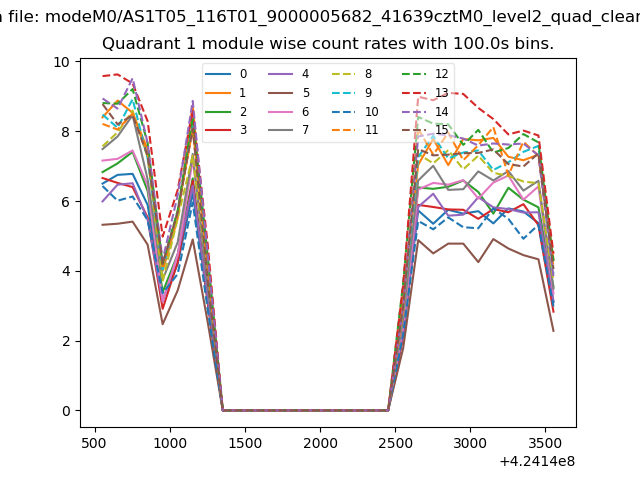
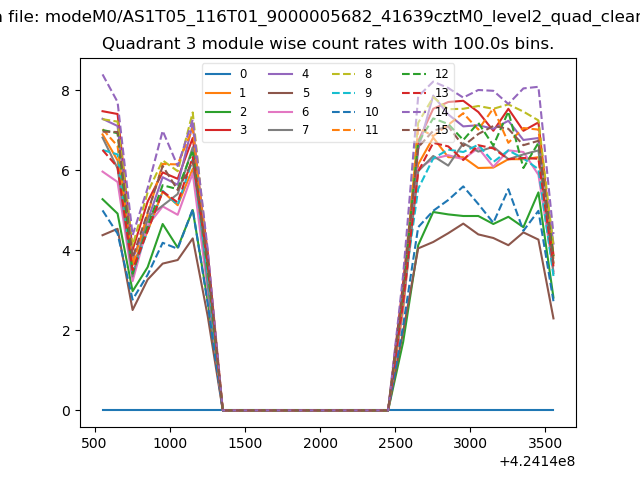
| Module-wise count rates for Quadrant A Data is divided into 100 sec bins |
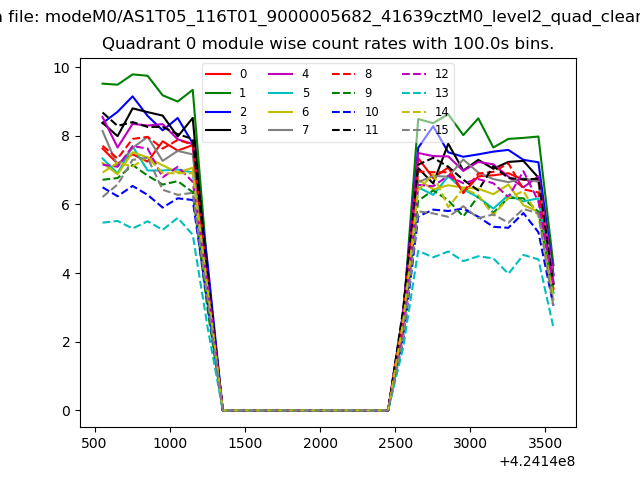 |
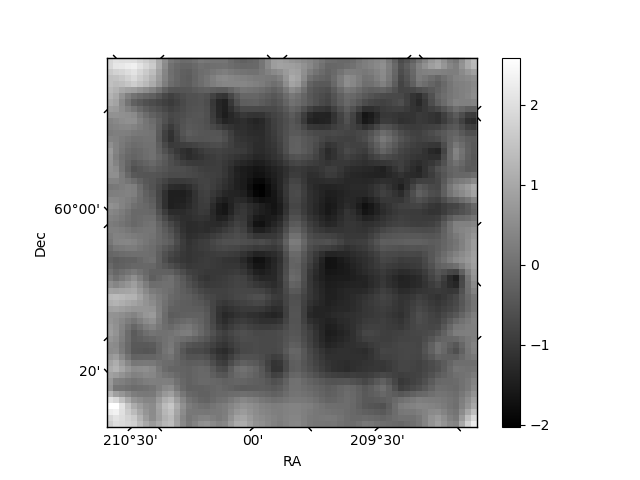 |
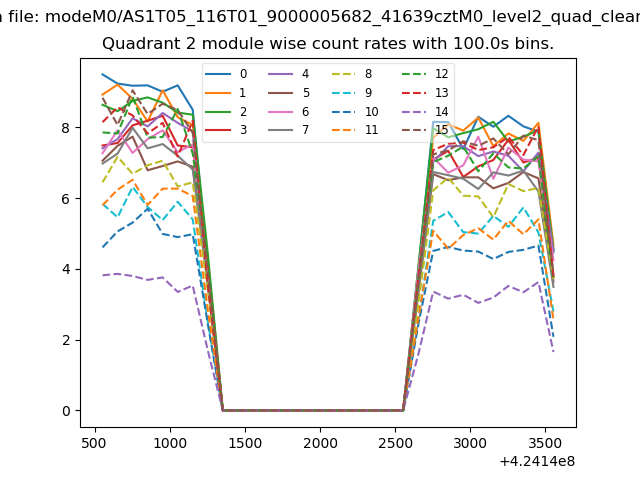
| Module-wise count rates for Quadrant B Data is divided into 100 sec bins |
 |
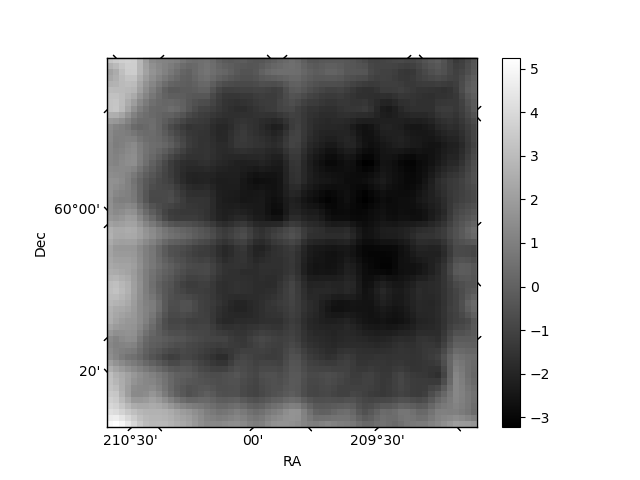 |
| Module-wise count rates for Quadrant C Data is divided into 100 sec bins |
 |
 |
| Module-wise count rates for Quadrant D Data is divided into 100 sec bins |
 |
 |
| Parameter | Plot |
|---|---|
| CZT HV Monitor | 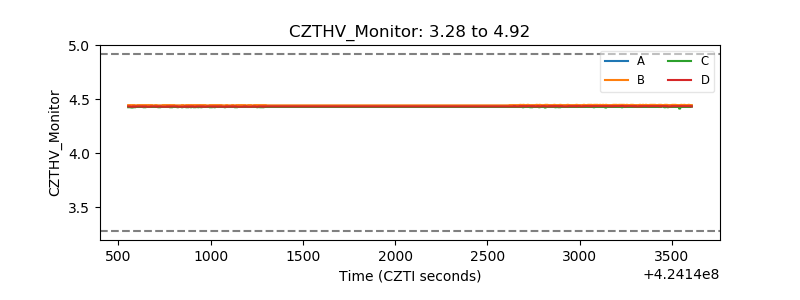 |
| D_VDD | 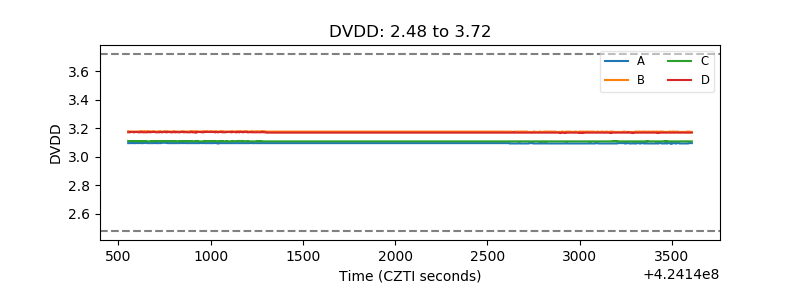 |
| Temperature 1 | 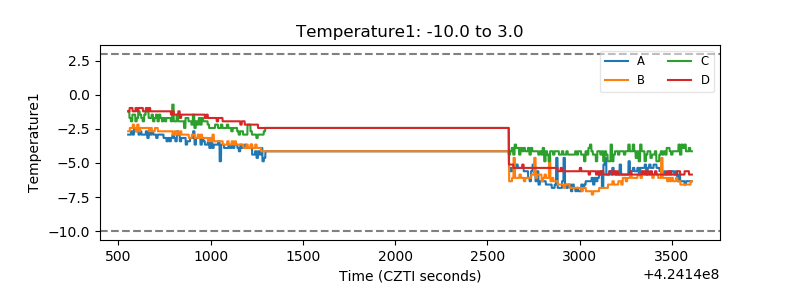 |
| Veto HV Monitor | 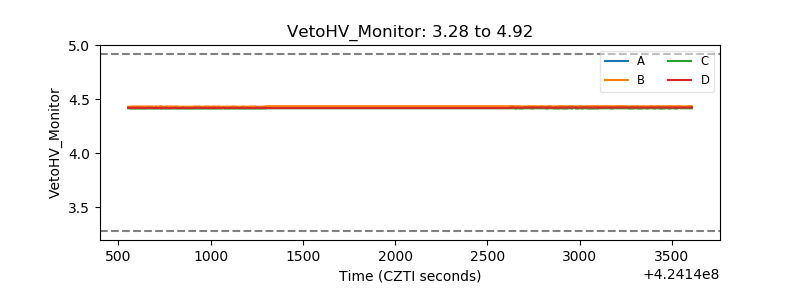 |
| Veto LLD | 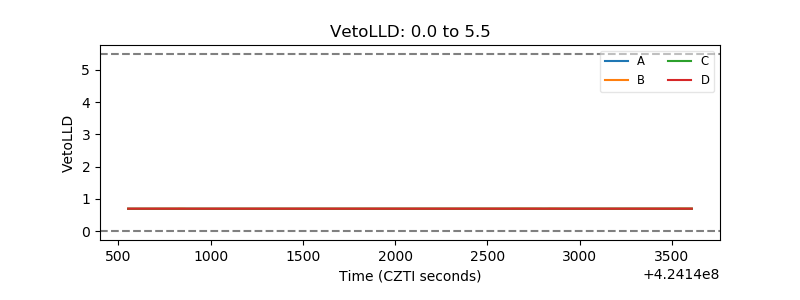 |
| Alpha Counter | 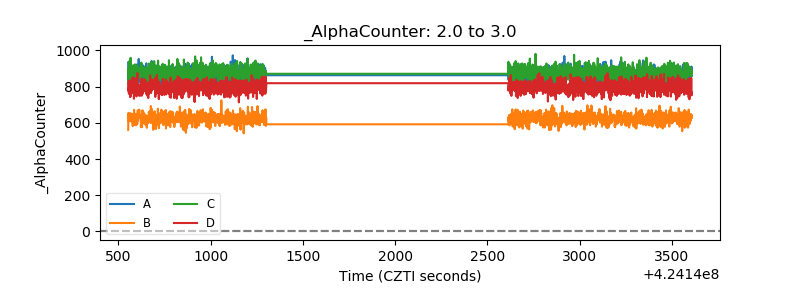 |
| _CPM_Rate | 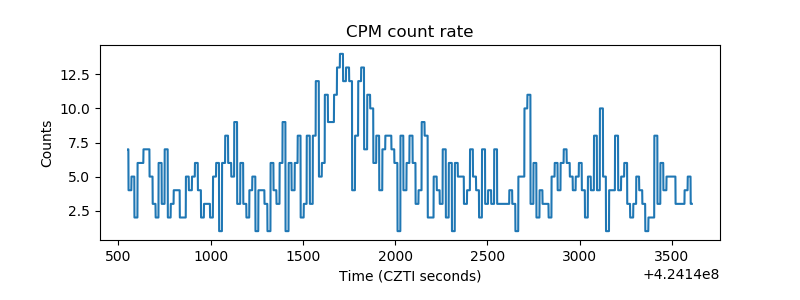 |
| CZT Counter | 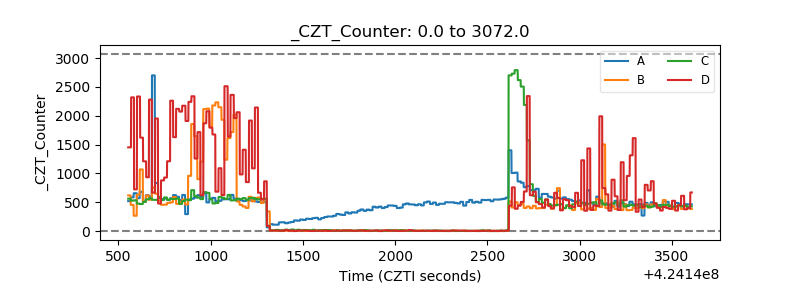 |
| +2.5 Volts monitor | 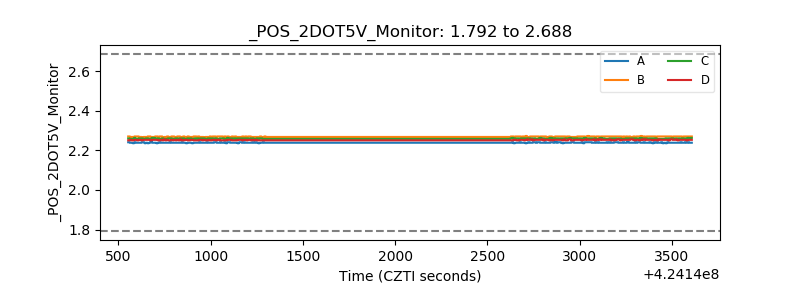 |
| +5 Volts monitor | 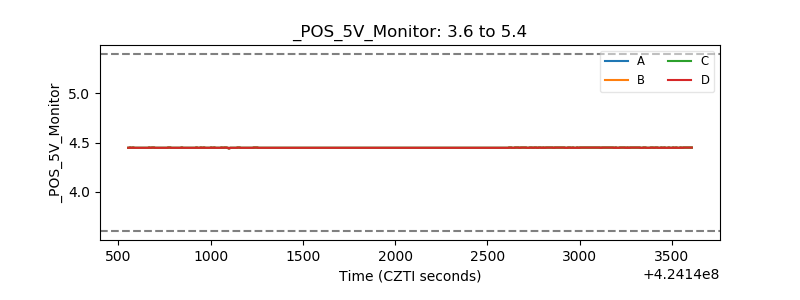 |
| _ROLL_ROT | 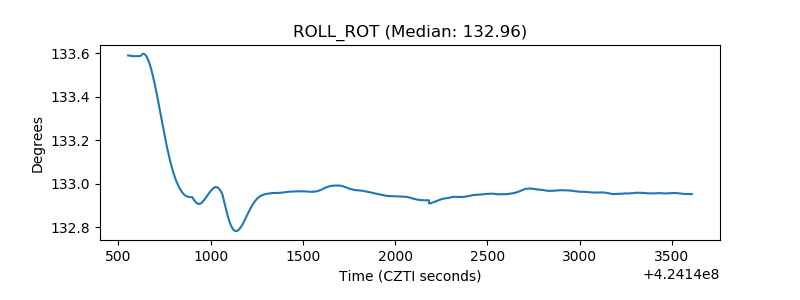 |
| _Roll_DEC | 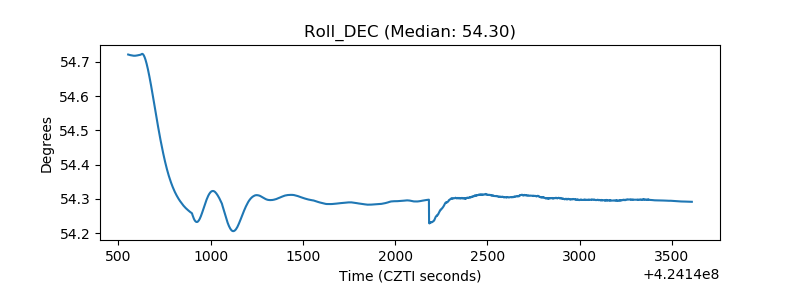 |
| _Roll_RA | 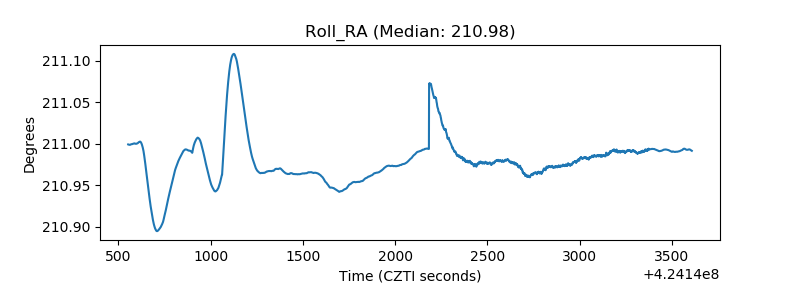 |
| Veto Counter | 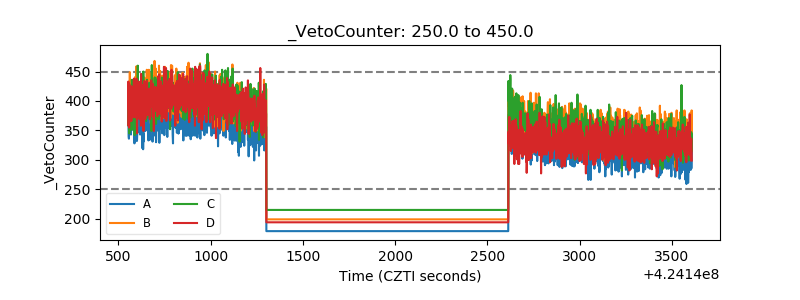 |