| Param | Original file | Final file |
|---|---|---|
| Filename | modeM0/AS1T05_116T01_9000005682_41642cztM0_level2.fits | modeM0/AS1T05_116T01_9000005682_41642cztM0_level2_quad_clean.evt |
| Size (bytes) | 1,068,485,760 | 243,224,640 |
| Size | 1019.0 MB | 232.0 MB |
| Events in quadrant A | 8,380,680 | 1,672,853 |
| Events in quadrant B | 8,597,098 | 1,663,607 |
| Events in quadrant C | 8,481,729 | 1,626,252 |
| Events in quadrant D | 12,873,283 | 1,315,970 |
| Mode M0 | |||
|---|---|---|---|
| Quadrant | BADHDUFLAG | Total packets | Discarded packets |
| A | 0 | 33978 | 4 |
| B | 0 | 36496 | 4 |
| C | 0 | 34790 | 4 |
| D | 0 | 49116 | 4 |
| Mode M9 | |||
|---|---|---|---|
| Quadrant | BADHDUFLAG | Total packets | Discarded packets |
| A | 0 | 52 | 0 |
| B | 0 | 52 | 0 |
| C | 0 | 53 | 0 |
| D | 0 | 53 | 0 |
| Mode SS | |||
|---|---|---|---|
| Quadrant | BADHDUFLAG | Total packets | Discarded packets |
| A | 0 | 318 | 0 |
| B | 0 | 318 | 0 |
| C | 0 | 318 | 0 |
| D | 0 | 318 | 0 |
| Quadrant | Total seconds | Saturated seconds | Saturation percentage |
|---|---|---|---|
| A | 15738 | 65 | 0.413013% |
| B | 15738 | 534 | 3.393061% |
| C | 15738 | 365 | 2.319227% |
| D | 15738 | 1818 | 11.551658% |
Noise dominated data is calculated using 1-second bins in cleaned event files. If a bin has >2000 counts, and if more than 50% of those come from <1% of pixels, then it is considered to be noise-dominated and hence unusable.
| Quadrant | # 1 sec bins | Bins with >0 counts | Bins with >2000 counts | High rate bins dominated by noise | Noise dominated (total time) | Noise dominated (detector-on time) | Marked lightcurve |
|---|---|---|---|---|---|---|---|
| A | 19887 | 15741 | 25 | 25 | 0.13% | 0.16% | 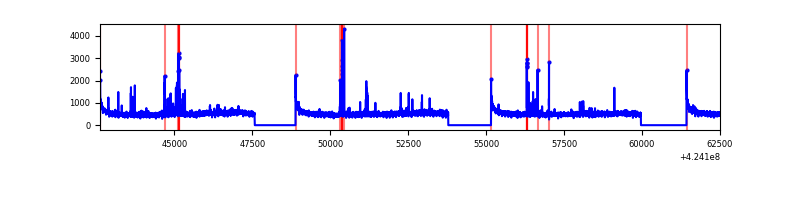 |
| B | 19887 | 15741 | 339 | 339 | 1.70% | 2.15% | 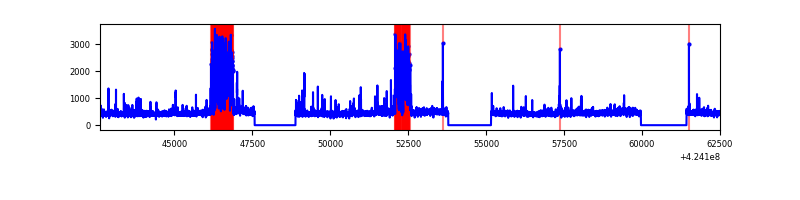 |
| C | 19887 | 15741 | 365 | 365 | 1.84% | 2.32% | 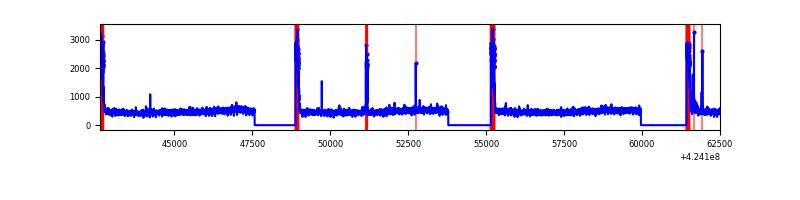 |
| D | 19887 | 15741 | 1519 | 1519 | 7.64% | 9.65% | 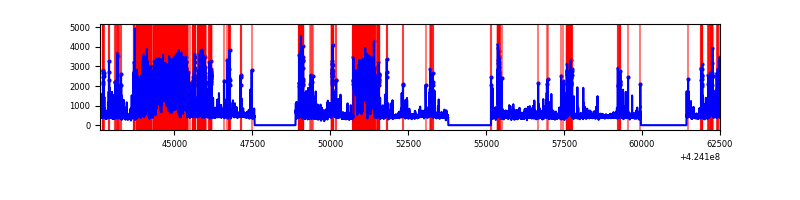 |
Top three noisy pixels from each quadrant. If the there are fewer than three noisy pixels in the level2.evt file, extra rows are filled as -1
| Pixel properties | Quadrant properties | ||||||
|---|---|---|---|---|---|---|---|
| Quadrant | DetID | PixID | Counts | Sigma | Mean | Median | Sigma |
| A | 10 | 83 | 1370871 | 3844.59 | 1734 | 1694 | 356.1 |
| A | 13 | 248 | 269293 | 751.41 | 1734 | 1694 | 356.1 |
| A | 2 | 79 | 38064 | 102.13 | 1734 | 1694 | 356.1 |
| B | 0 | 186 | 1425047 | 4375.41 | 1706 | 1656 | 325.3 |
| B | 4 | 171 | 152112 | 462.49 | 1706 | 1656 | 325.3 |
| B | 0 | 190 | 130060 | 394.71 | 1706 | 1656 | 325.3 |
| C | 0 | 10 | 1203070 | 3084.47 | 1674 | 1684 | 389.5 |
| C | 15 | 214 | 630841 | 1615.32 | 1674 | 1684 | 389.5 |
| C | 14 | 254 | 118731 | 300.51 | 1674 | 1684 | 389.5 |
| D | 13 | 249 | 5194528 | 13303.64 | 1616 | 1572 | 390.3 |
| D | 2 | 249 | 560615 | 1432.19 | 1616 | 1572 | 390.3 |
| D | 1 | 47 | 353010 | 900.34 | 1616 | 1572 | 390.3 |
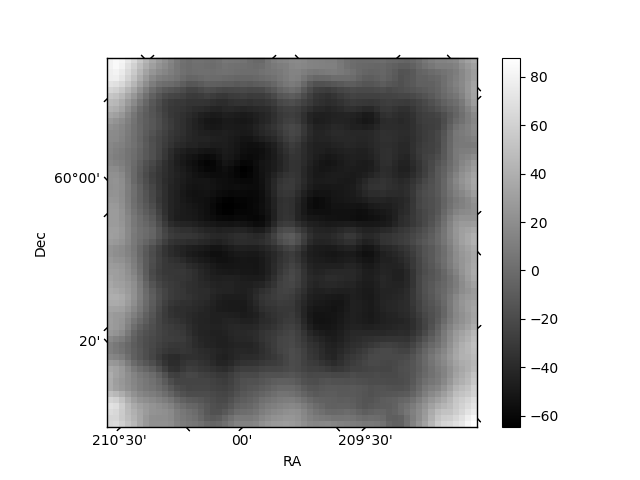
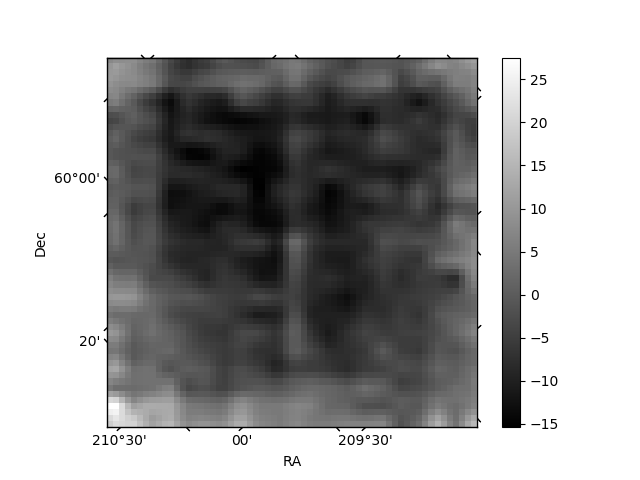
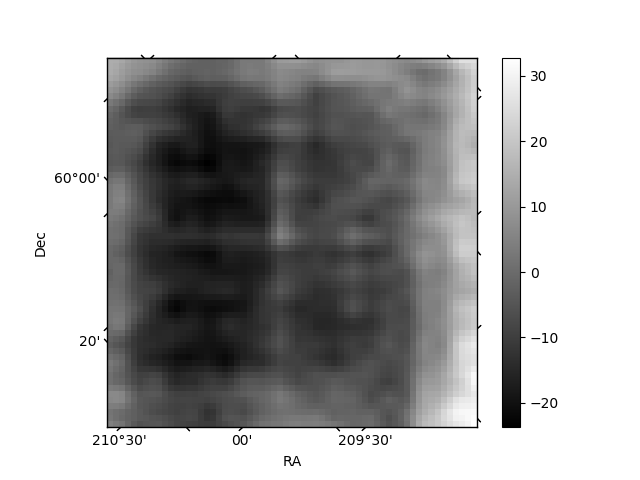
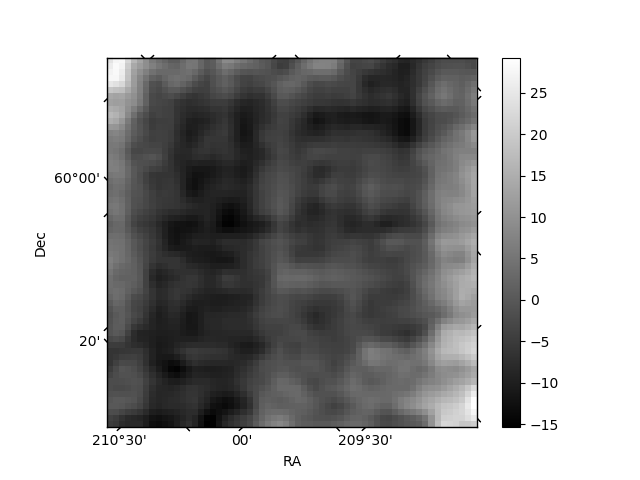
Histogram calculated using DETX and DETY for each event in the final _common_clean file
| Quadrant A | 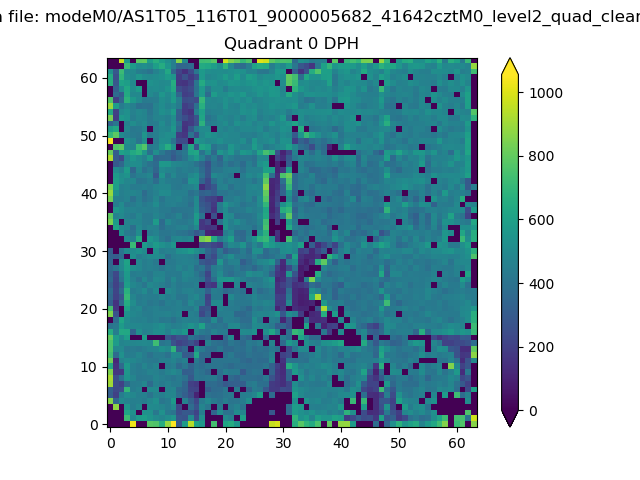 |
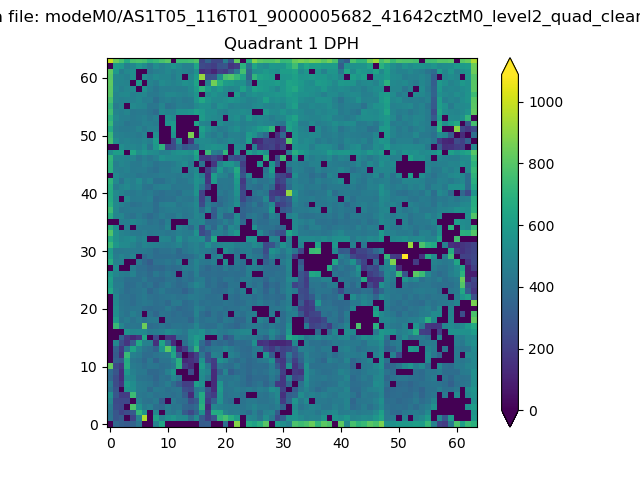 |
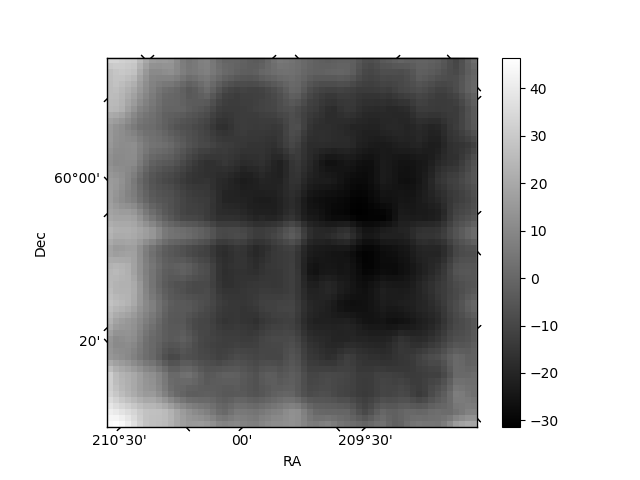
Quadrant B |
|---|---|---|---|
| Quadrant D | 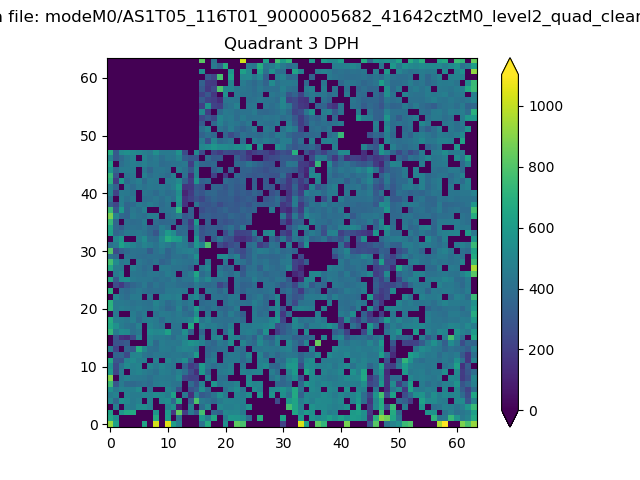 |
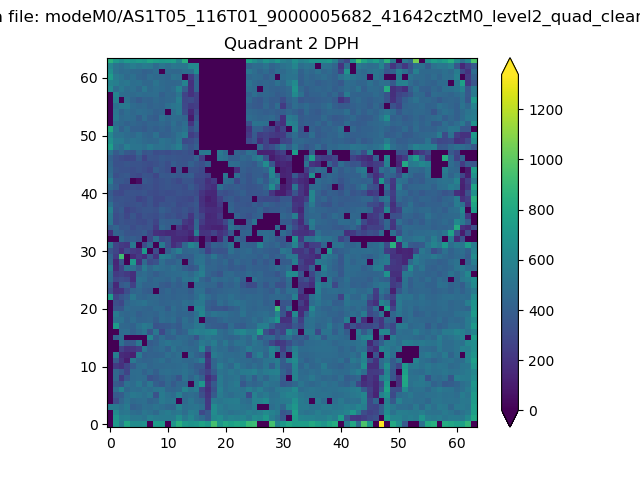 |
Quadrant C |
| Plot type | Count rate plots | Images |
|---|---|---|
| Comparison with Poisson distribution Blue bars denote a histogram of data divided into 1 sec bins. Red curve is a Poisson curve with rate = median count rate of data. |
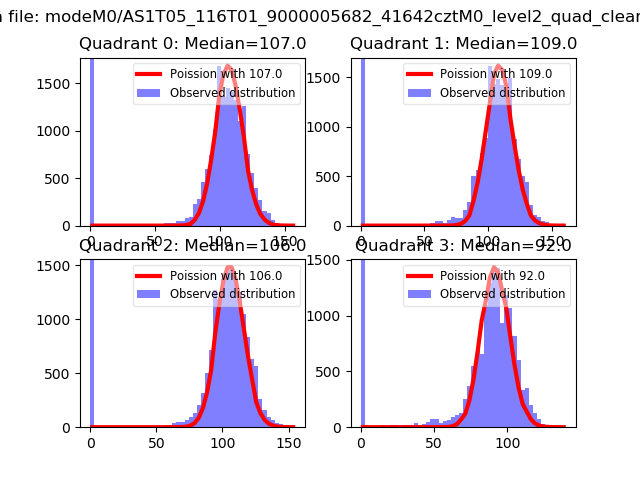 |
 |
| Quadrant-wise count rates Data is divided into 100 sec bins |
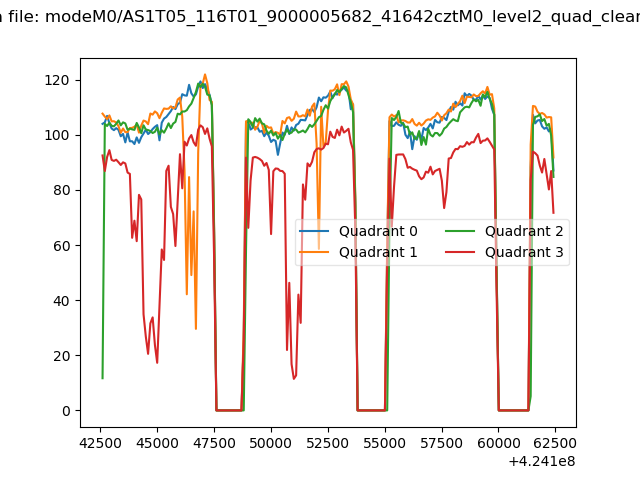 |
|
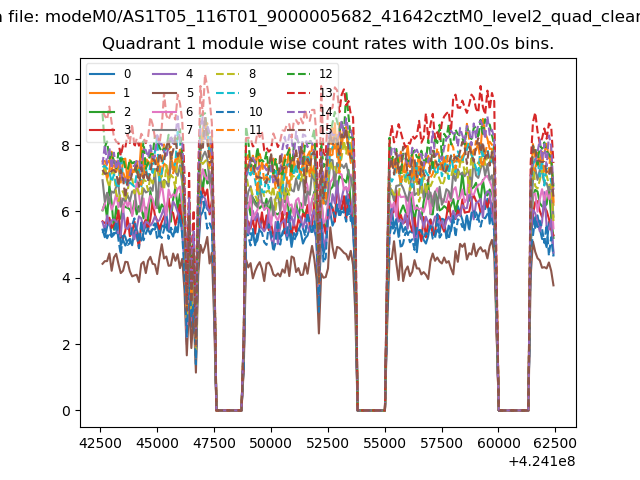
| Module-wise count rates for Quadrant A Data is divided into 100 sec bins |
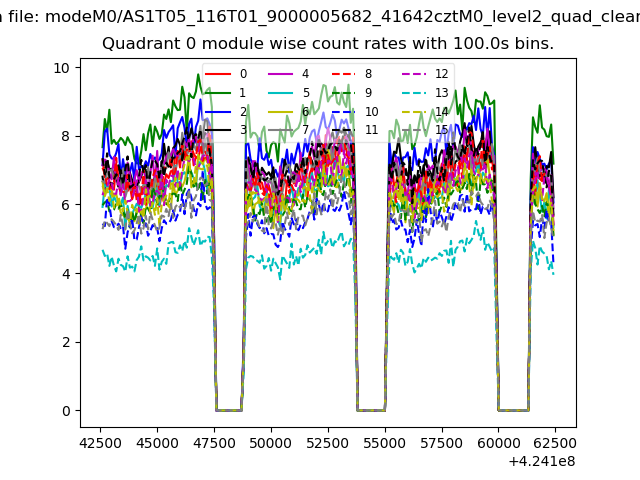 |
 |
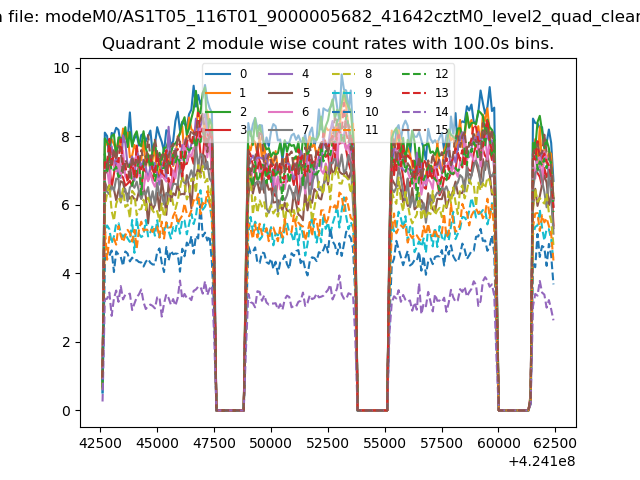
| Module-wise count rates for Quadrant B Data is divided into 100 sec bins |
 |
 |
| Module-wise count rates for Quadrant C Data is divided into 100 sec bins |
 |
 |
| Module-wise count rates for Quadrant D Data is divided into 100 sec bins |
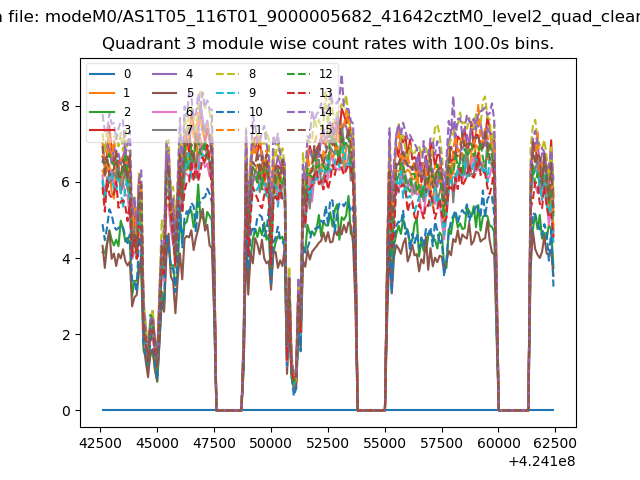 |
 |
| Parameter | Plot |
|---|---|
| CZT HV Monitor | 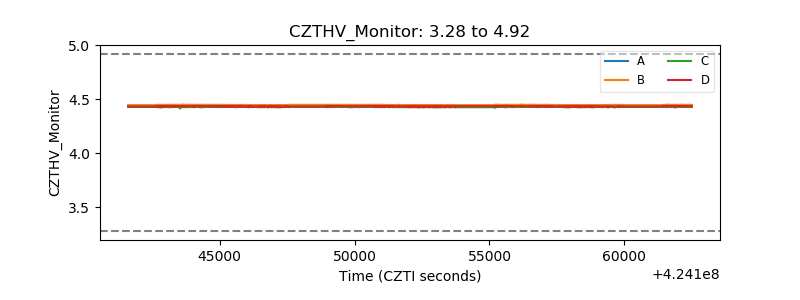 |
| D_VDD | 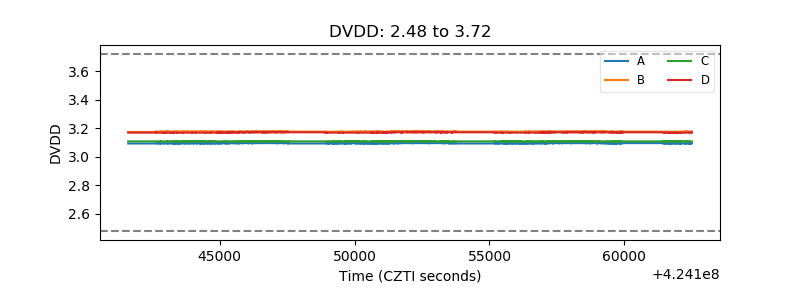 |
| Temperature 1 | 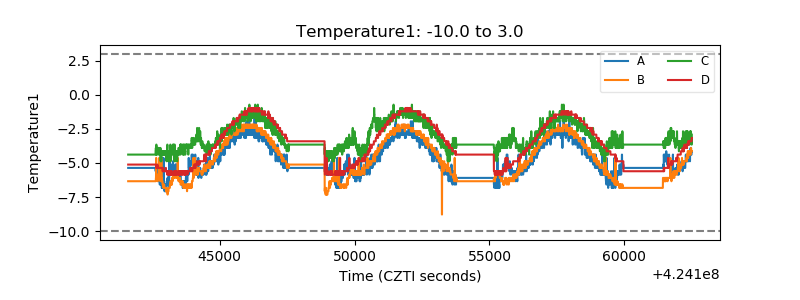 |
| Veto HV Monitor | 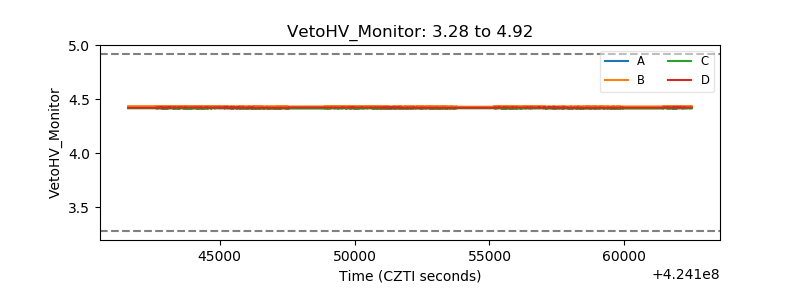 |
| Veto LLD | 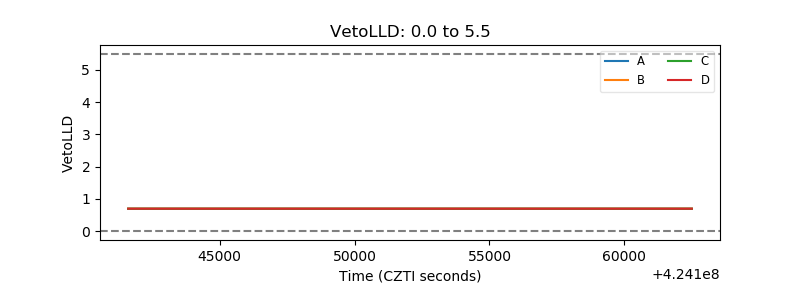 |
| Alpha Counter | 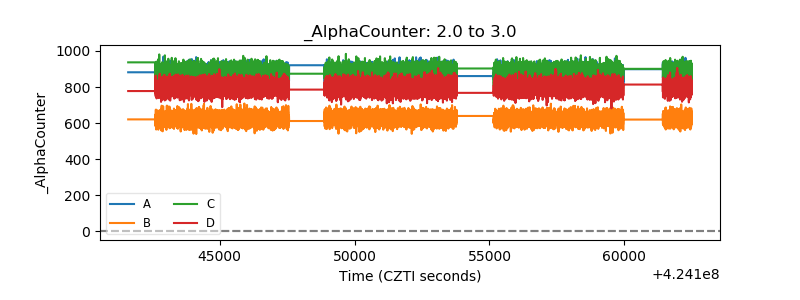 |
| _CPM_Rate | 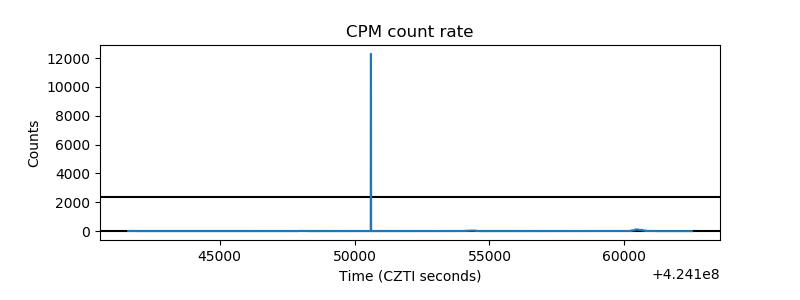 |
| CZT Counter | 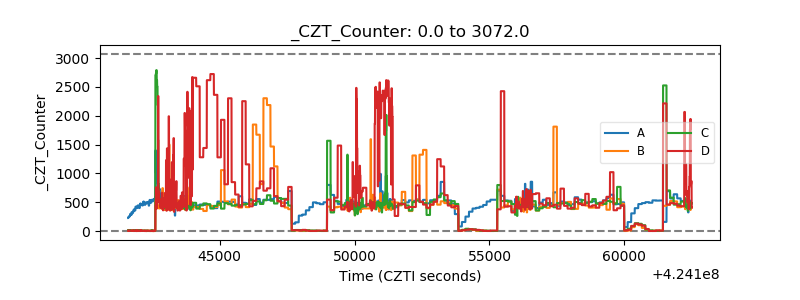 |
| +2.5 Volts monitor | 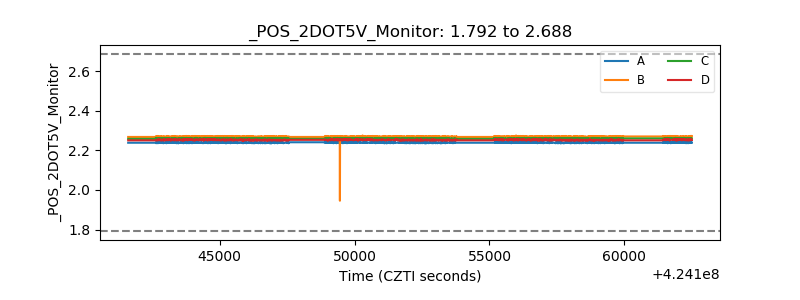 |
| +5 Volts monitor |  |
| _ROLL_ROT |  |
| _Roll_DEC | 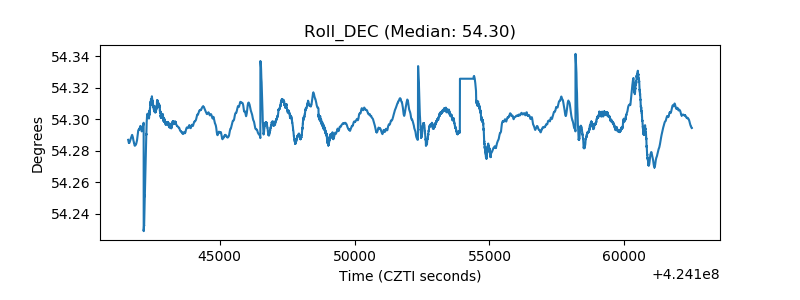 |
| _Roll_RA |  |
| Veto Counter |  |