| Param | Original file | Final file |
|---|---|---|
| Filename | modeM0/AS1T05_116T01_9000005682_41643cztM0_level2.fits | modeM0/AS1T05_116T01_9000005682_41643cztM0_level2_quad_clean.evt |
| Size (bytes) | 359,225,280 | 92,260,800 |
| Size | 342.6 MB | 88.0 MB |
| Events in quadrant A | 3,038,823 | 621,115 |
| Events in quadrant B | 2,590,179 | 640,644 |
| Events in quadrant C | 3,189,730 | 587,607 |
| Events in quadrant D | 4,033,439 | 544,541 |
| Mode M0 | |||
|---|---|---|---|
| Quadrant | BADHDUFLAG | Total packets | Discarded packets |
| A | 0 | 12359 | 2 |
| B | 0 | 11593 | 2 |
| C | 0 | 12981 | 2 |
| D | 0 | 15997 | 4 |
| Mode M9 | |||
|---|---|---|---|
| Quadrant | BADHDUFLAG | Total packets | Discarded packets |
| A | 0 | 23 | 0 |
| B | 0 | 24 | 0 |
| C | 0 | 24 | 0 |
| D | 0 | 24 | 0 |
| Mode SS | |||
|---|---|---|---|
| Quadrant | BADHDUFLAG | Total packets | Discarded packets |
| A | 0 | 116 | 0 |
| B | 0 | 116 | 0 |
| C | 0 | 116 | 0 |
| D | 0 | 116 | 0 |
| Quadrant | Total seconds | Saturated seconds | Saturation percentage |
|---|---|---|---|
| A | 5719 | 16 | 0.279769% |
| B | 5719 | 10 | 0.174856% |
| C | 5719 | 196 | 3.427173% |
| D | 5718 | 215 | 3.760056% |
Noise dominated data is calculated using 1-second bins in cleaned event files. If a bin has >2000 counts, and if more than 50% of those come from <1% of pixels, then it is considered to be noise-dominated and hence unusable.
| Quadrant | # 1 sec bins | Bins with >0 counts | Bins with >2000 counts | High rate bins dominated by noise | Noise dominated (total time) | Noise dominated (detector-on time) | Marked lightcurve |
|---|---|---|---|---|---|---|---|
| A | 7302 | 5720 | 3 | 3 | 0.04% | 0.05% | 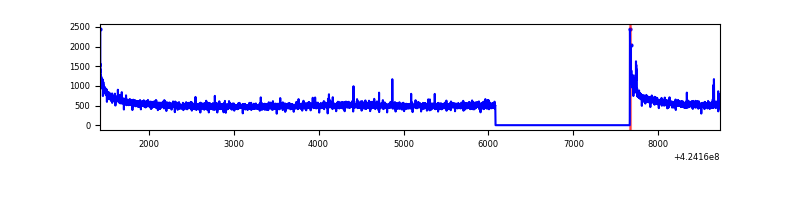 |
| B | 7302 | 5720 | 1 | 1 | 0.01% | 0.02% | 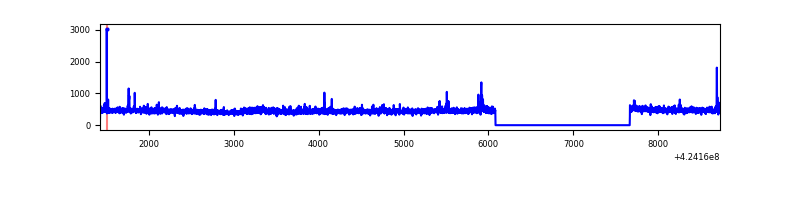 |
| C | 7302 | 5720 | 188 | 188 | 2.57% | 3.29% | 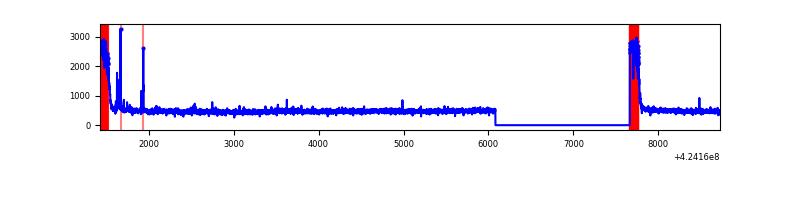 |
| D | 7301 | 5719 | 188 | 188 | 2.57% | 3.29% | 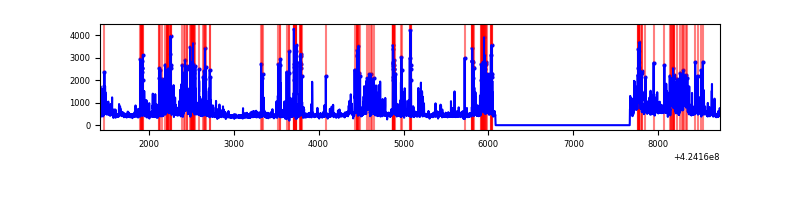 |
Top three noisy pixels from each quadrant. If the there are fewer than three noisy pixels in the level2.evt file, extra rows are filled as -1
| Pixel properties | Quadrant properties | ||||||
|---|---|---|---|---|---|---|---|
| Quadrant | DetID | PixID | Counts | Sigma | Mean | Median | Sigma |
| A | 10 | 83 | 549526 | 4172.35 | 635 | 620 | 131.6 |
| A | 13 | 248 | 15346 | 111.94 | 635 | 620 | 131.6 |
| A | 2 | 79 | 9291 | 65.91 | 635 | 620 | 131.6 |
| B | 0 | 190 | 42374 | 344.77 | 627 | 607 | 121.1 |
| B | 0 | 189 | 17557 | 139.91 | 627 | 607 | 121.1 |
| B | 4 | 81 | 16525 | 131.4 | 627 | 607 | 121.1 |
| C | 0 | 10 | 551932 | 3886.98 | 605 | 610 | 141.8 |
| C | 15 | 214 | 232090 | 1632.0 | 605 | 610 | 141.8 |
| C | 14 | 254 | 42322 | 294.08 | 605 | 610 | 141.8 |
| D | 13 | 249 | 705649 | 4763.5 | 608 | 590 | 148.0 |
| D | 1 | 47 | 366254 | 2470.49 | 608 | 590 | 148.0 |
| D | 2 | 249 | 236188 | 1591.74 | 608 | 590 | 148.0 |
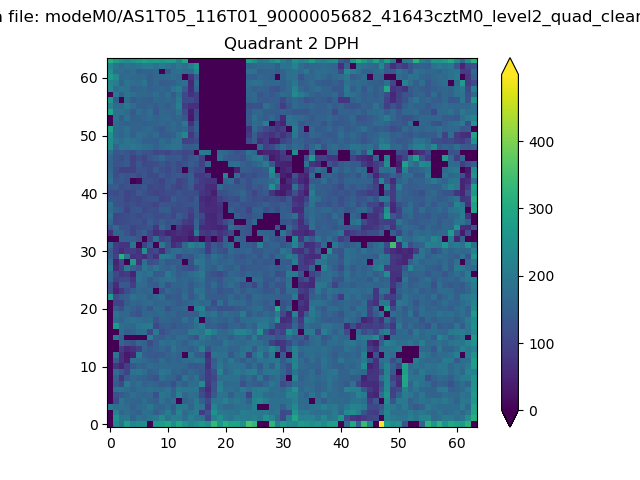
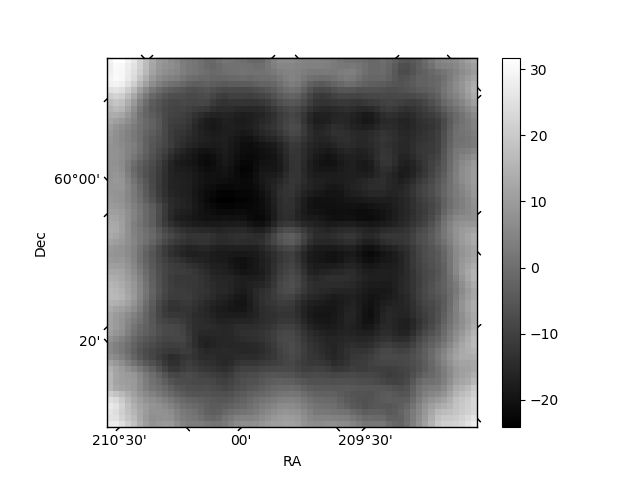
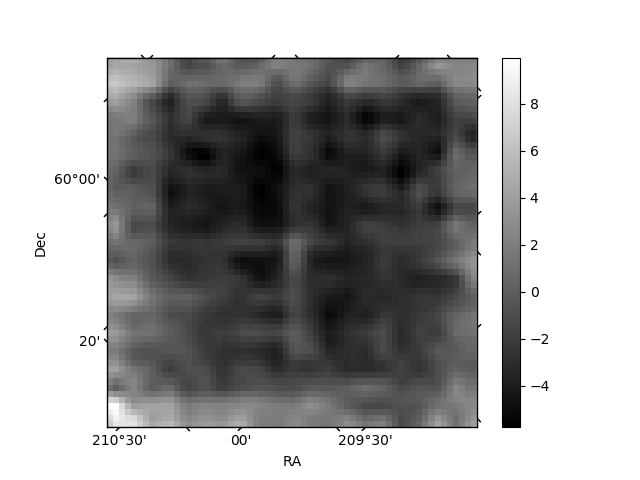
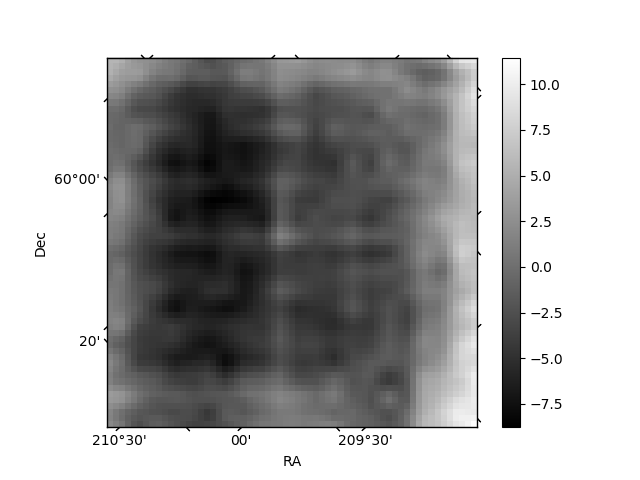
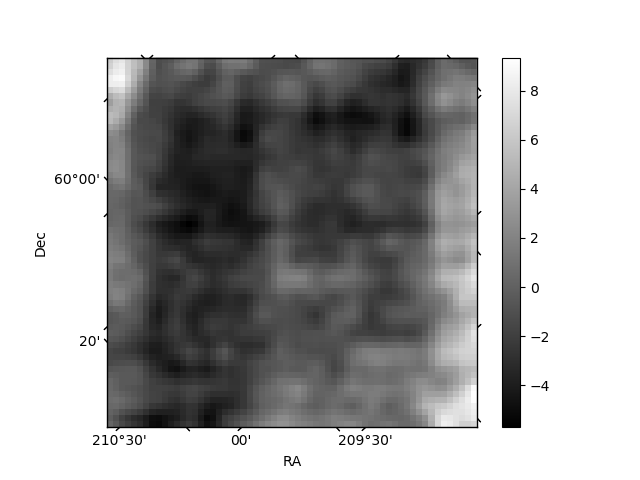
Histogram calculated using DETX and DETY for each event in the final _common_clean file
| Quadrant A | 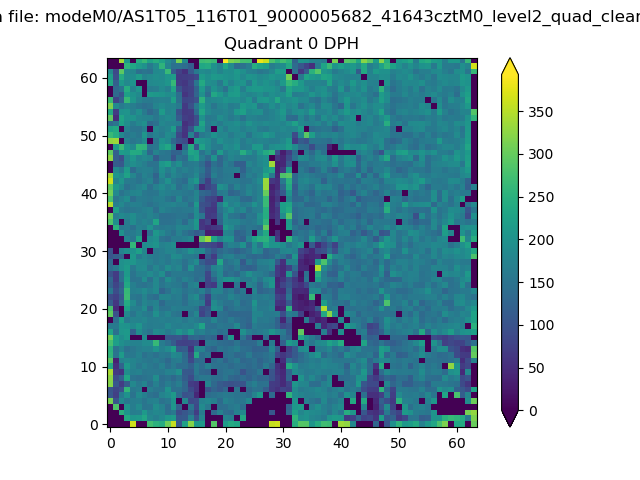 |
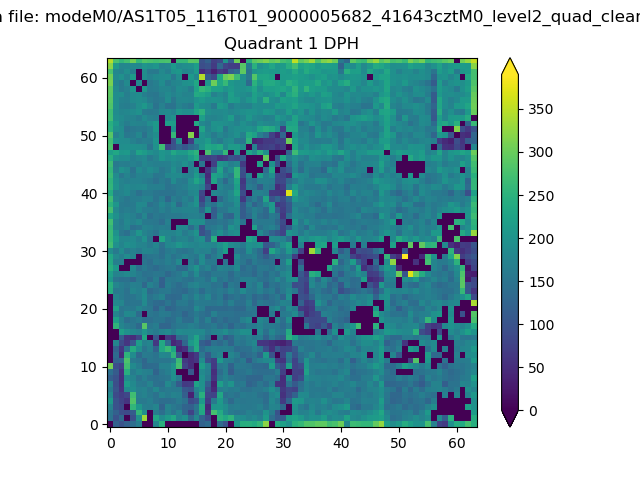 |
Quadrant B |
|---|---|---|---|
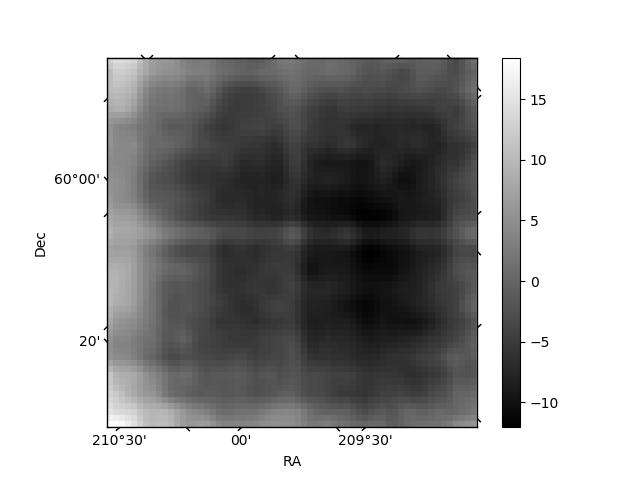
| Quadrant D | 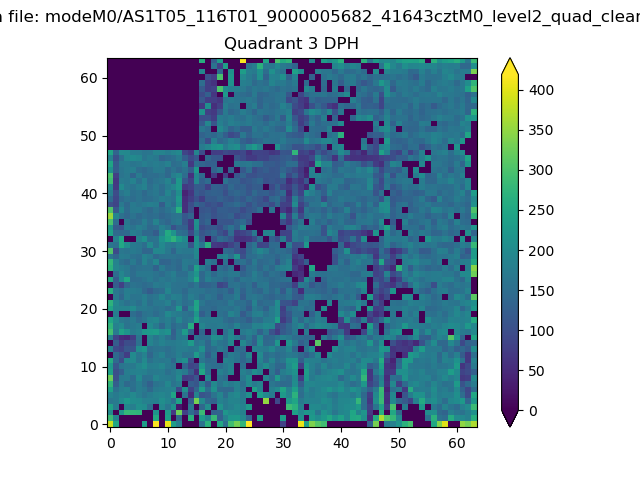 |
 |
Quadrant C |
| Plot type | Count rate plots | Images |
|---|---|---|
| Comparison with Poisson distribution Blue bars denote a histogram of data divided into 1 sec bins. Red curve is a Poisson curve with rate = median count rate of data. |
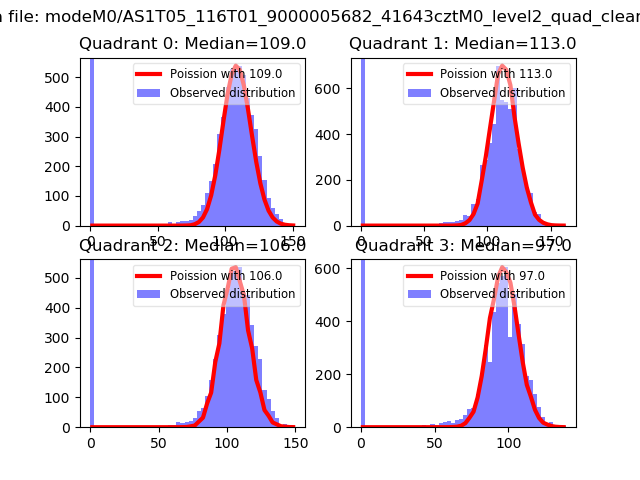 |
 |
| Quadrant-wise count rates Data is divided into 100 sec bins |
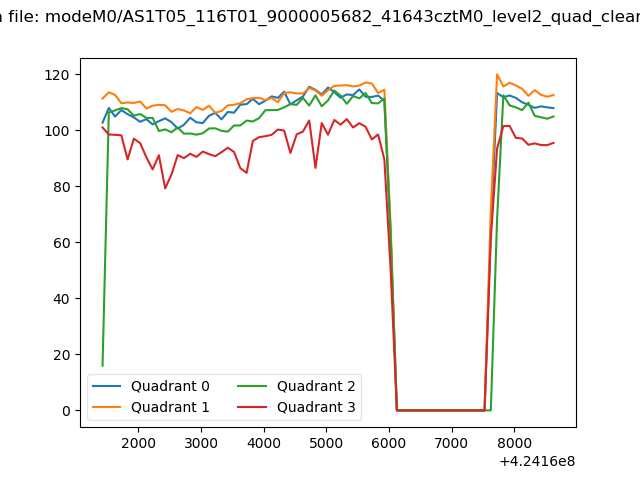 |
|
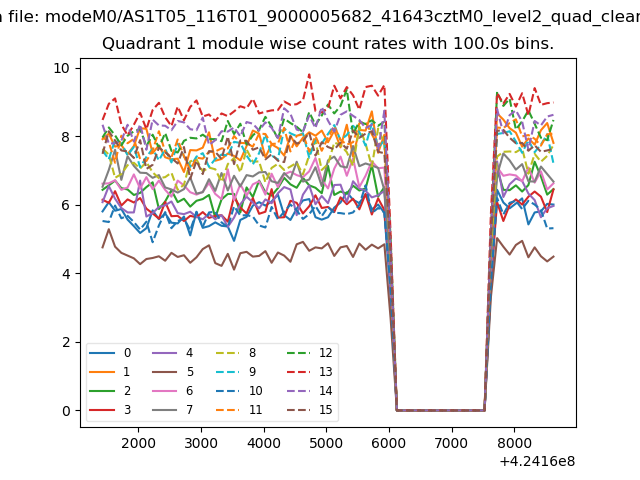
| Module-wise count rates for Quadrant A Data is divided into 100 sec bins |
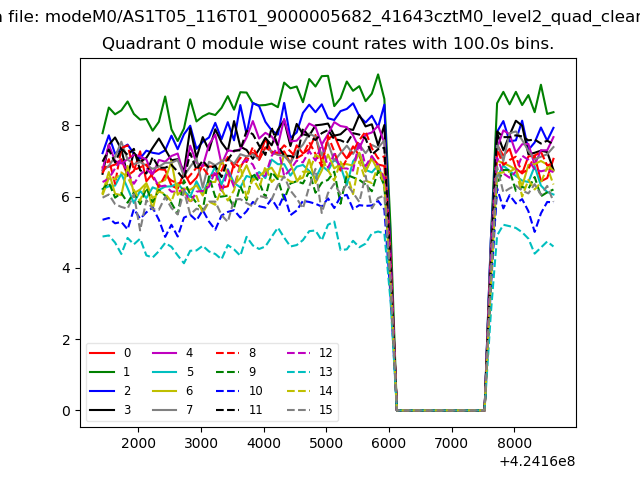 |
 |
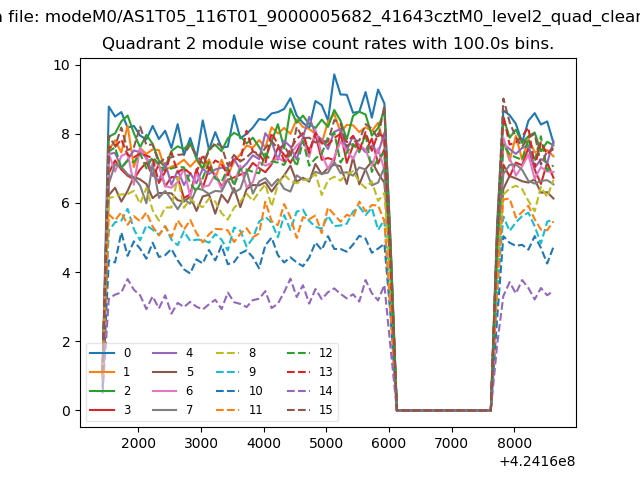
| Module-wise count rates for Quadrant B Data is divided into 100 sec bins |
 |
 |
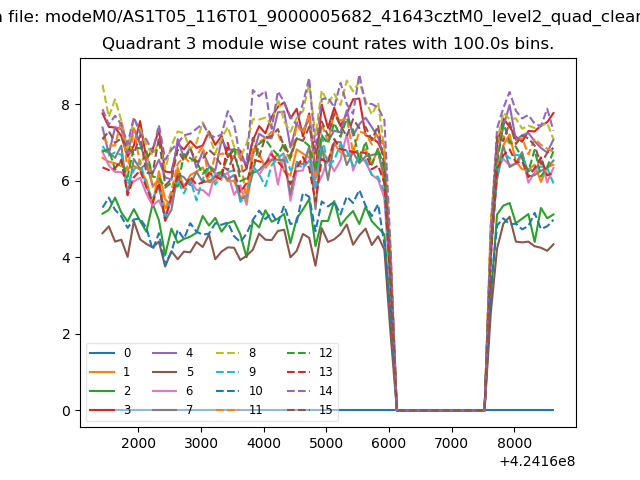
| Module-wise count rates for Quadrant C Data is divided into 100 sec bins |
 |
 |
| Module-wise count rates for Quadrant D Data is divided into 100 sec bins |
 |
 |
| Parameter | Plot |
|---|---|
| CZT HV Monitor | 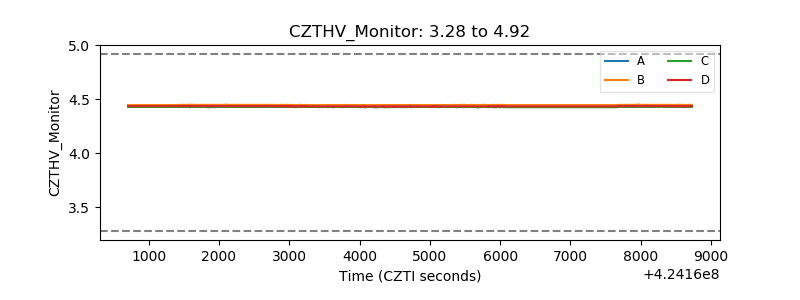 |
| D_VDD | 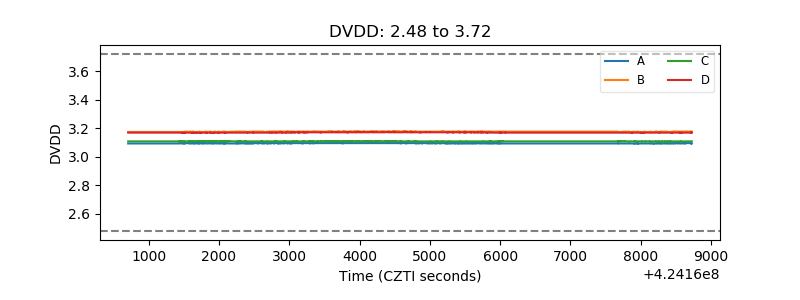 |
| Temperature 1 | 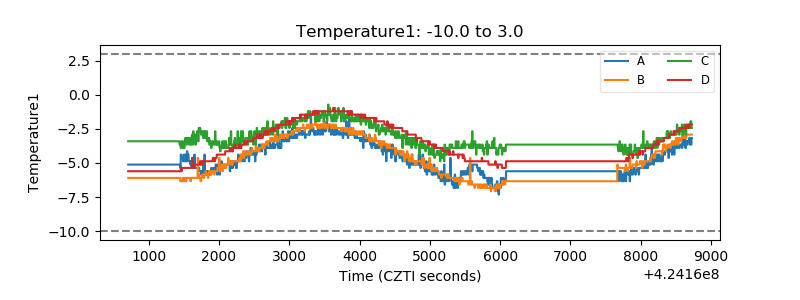 |
| Veto HV Monitor | 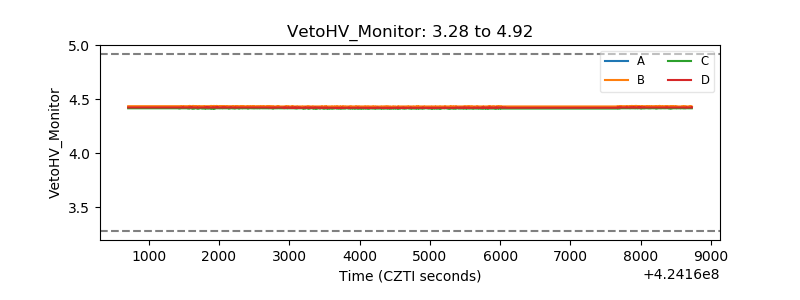 |
| Veto LLD | 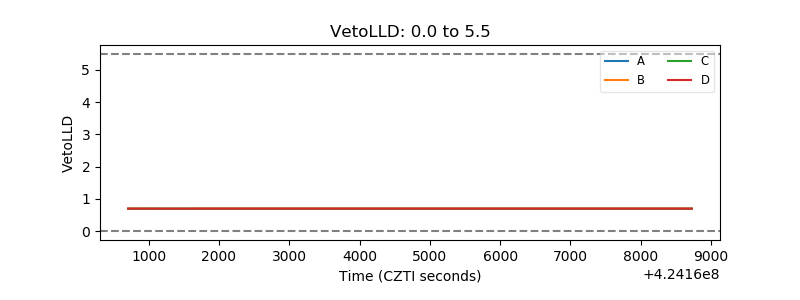 |
| Alpha Counter | 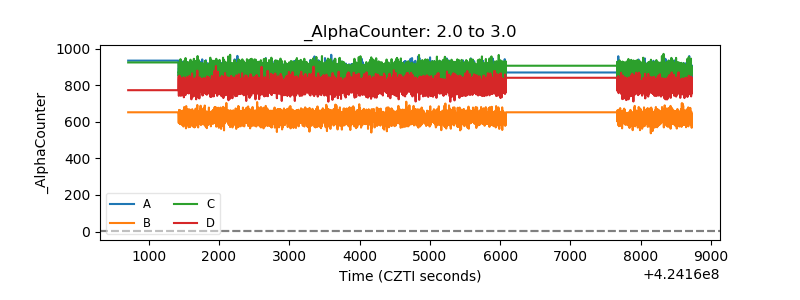 |
| _CPM_Rate | 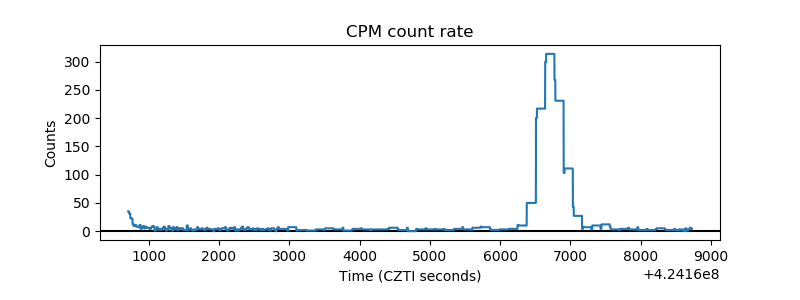 |
| CZT Counter | 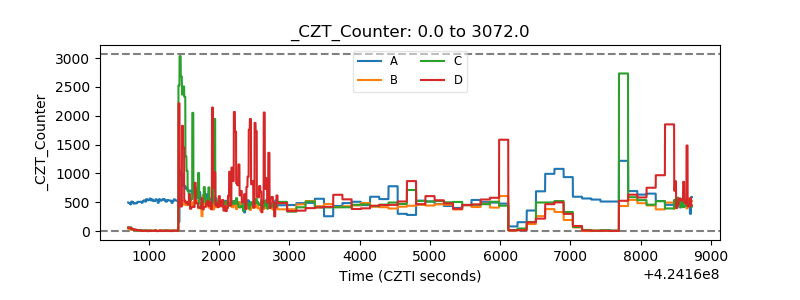 |
| +2.5 Volts monitor | 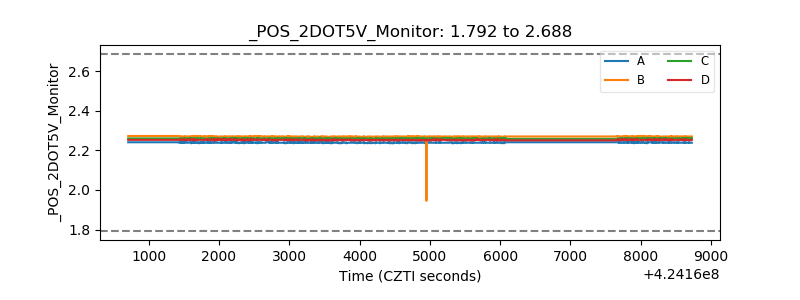 |
| +5 Volts monitor |  |
| _ROLL_ROT | 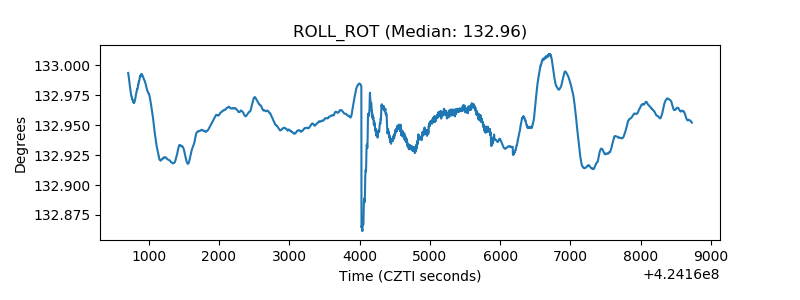 |
| _Roll_DEC | 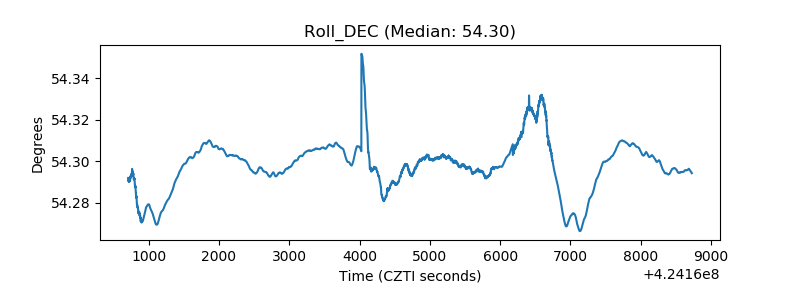 |
| _Roll_RA | 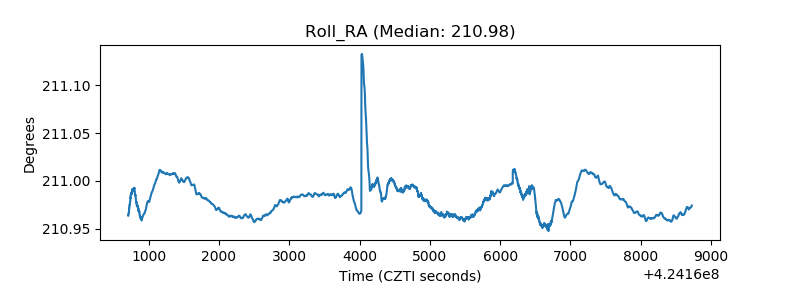 |
| Veto Counter | 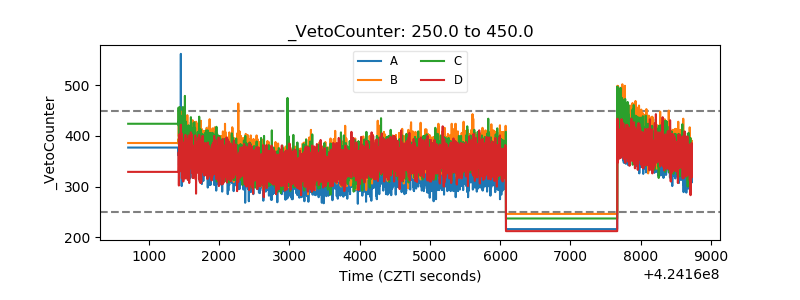 |