| Param | Original file | Final file |
|---|---|---|
| Filename | modeM0/AS1T05_116T01_9000005682_41644cztM0_level2.fits | modeM0/AS1T05_116T01_9000005682_41644cztM0_level2_quad_clean.evt |
| Size (bytes) | 372,890,880 | 91,503,360 |
| Size | 355.6 MB | 87.3 MB |
| Events in quadrant A | 3,010,109 | 623,919 |
| Events in quadrant B | 2,896,991 | 641,566 |
| Events in quadrant C | 3,074,567 | 583,904 |
| Events in quadrant D | 4,386,451 | 530,119 |
| Mode M0 | |||
|---|---|---|---|
| Quadrant | BADHDUFLAG | Total packets | Discarded packets |
| A | 0 | 12291 | 2 |
| B | 0 | 12288 | 2 |
| C | 0 | 12598 | 2 |
| D | 0 | 16848 | 2 |
| Mode M9 | |||
|---|---|---|---|
| Quadrant | BADHDUFLAG | Total packets | Discarded packets |
| A | 0 | 24 | 0 |
| B | 0 | 25 | 0 |
| C | 0 | 25 | 0 |
| D | 0 | 25 | 0 |
| Mode SS | |||
|---|---|---|---|
| Quadrant | BADHDUFLAG | Total packets | Discarded packets |
| A | 0 | 114 | 0 |
| B | 0 | 114 | 0 |
| C | 0 | 114 | 0 |
| D | 0 | 114 | 0 |
| Quadrant | Total seconds | Saturated seconds | Saturation percentage |
|---|---|---|---|
| A | 5589 | 20 | 0.357846% |
| B | 5589 | 22 | 0.393630% |
| C | 5589 | 194 | 3.471104% |
| D | 5589 | 376 | 6.727500% |
Noise dominated data is calculated using 1-second bins in cleaned event files. If a bin has >2000 counts, and if more than 50% of those come from <1% of pixels, then it is considered to be noise-dominated and hence unusable.
| Quadrant | # 1 sec bins | Bins with >0 counts | Bins with >2000 counts | High rate bins dominated by noise | Noise dominated (total time) | Noise dominated (detector-on time) | Marked lightcurve |
|---|---|---|---|---|---|---|---|
| A | 7292 | 5590 | 4 | 4 | 0.05% | 0.07% | 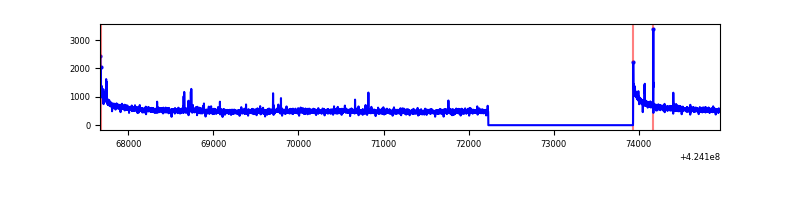 |
| B | 7292 | 5590 | 14 | 14 | 0.19% | 0.25% | 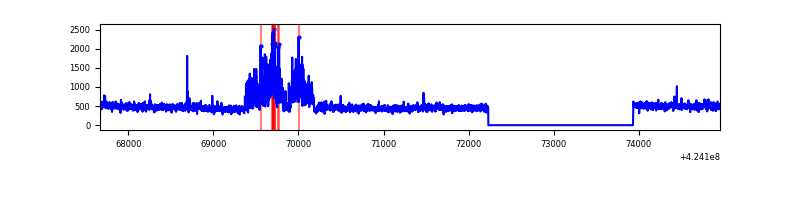 |
| C | 7292 | 5590 | 190 | 190 | 2.61% | 3.40% | 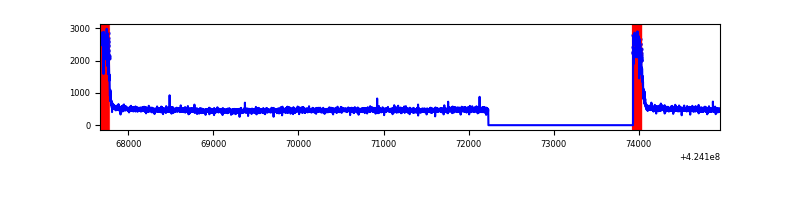 |
| D | 7292 | 5590 | 343 | 343 | 4.70% | 6.14% | 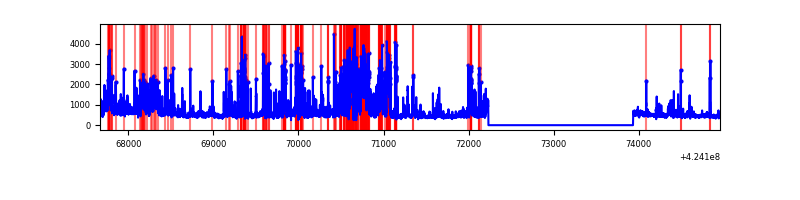 |
Top three noisy pixels from each quadrant. If the there are fewer than three noisy pixels in the level2.evt file, extra rows are filled as -1
| Pixel properties | Quadrant properties | ||||||
|---|---|---|---|---|---|---|---|
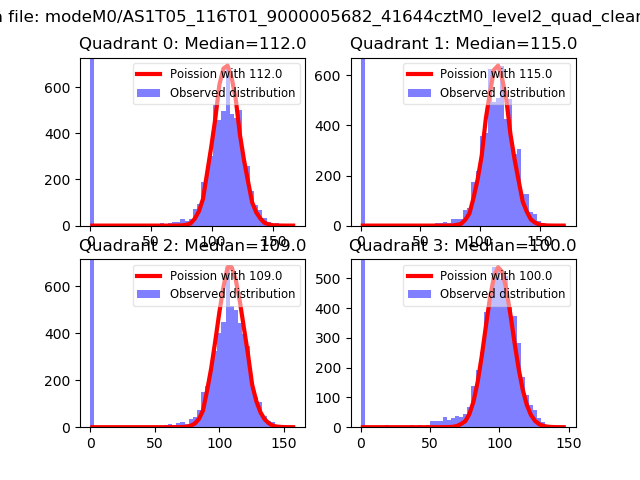
| Quadrant | DetID | PixID | Counts | Sigma | Mean | Median | Sigma |
| A | 10 | 83 | 537842 | 4172.94 | 626 | 613 | 128.7 |
| A | 13 | 248 | 39237 | 300.01 | 626 | 613 | 128.7 |
| A | 13 | 254 | 7192 | 51.1 | 626 | 613 | 128.7 |
| B | 0 | 186 | 330128 | 2738.84 | 618 | 600 | 120.3 |
| B | 7 | 202 | 50198 | 412.23 | 618 | 600 | 120.3 |
| B | 0 | 190 | 43023 | 352.59 | 618 | 600 | 120.3 |
| C | 0 | 10 | 520307 | 3724.42 | 596 | 599 | 139.5 |
| C | 15 | 214 | 228556 | 1633.62 | 596 | 599 | 139.5 |
| C | 9 | 54 | 4329 | 26.73 | 596 | 599 | 139.5 |
| D | 13 | 249 | 1026571 | 6990.7 | 593 | 574 | 146.8 |
| D | 1 | 47 | 485240 | 3302.31 | 593 | 574 | 146.8 |
| D | 5 | 222 | 257970 | 1753.79 | 593 | 574 | 146.8 |
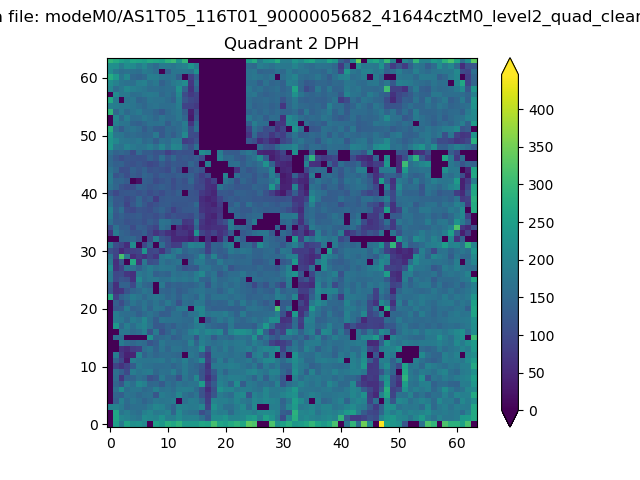
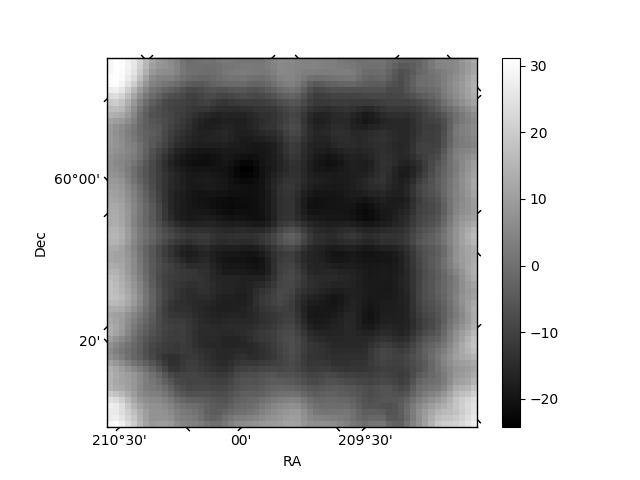
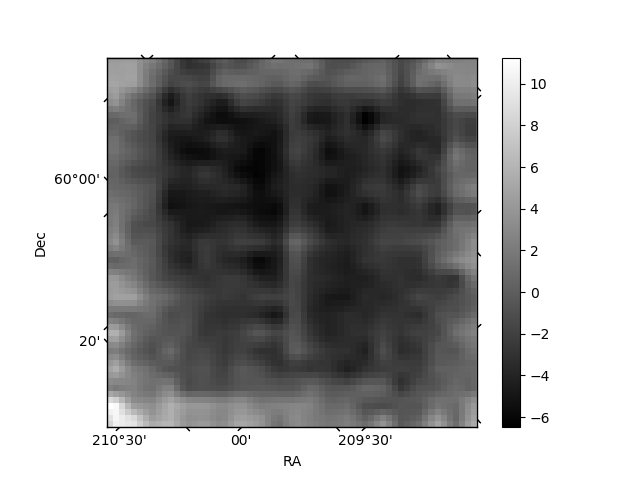
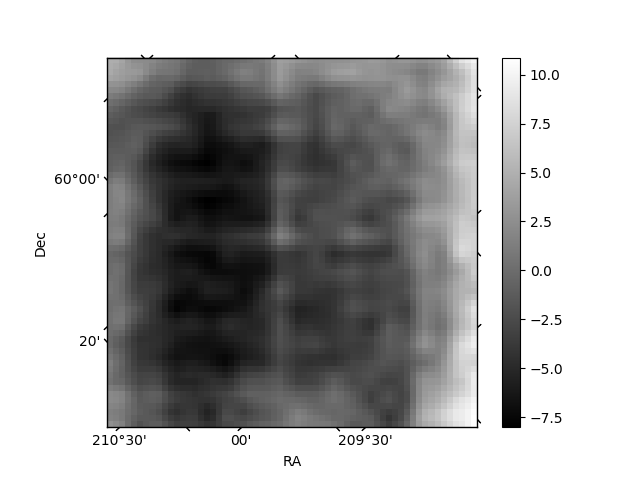
Histogram calculated using DETX and DETY for each event in the final _common_clean file
| Quadrant A | 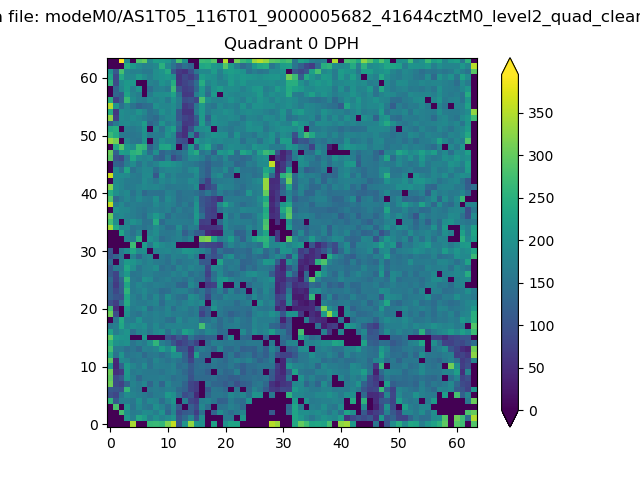 |
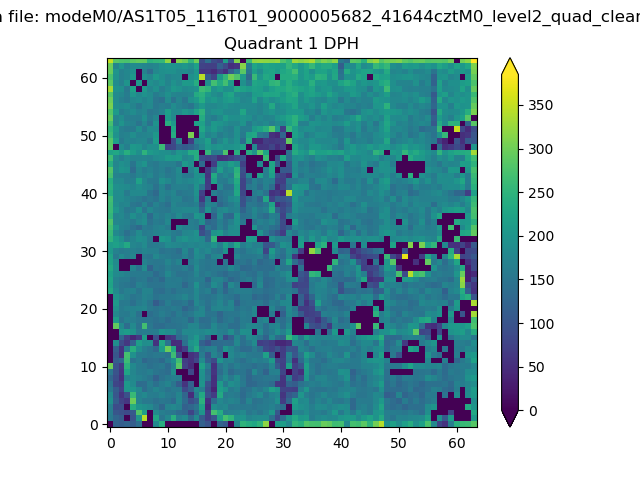 |
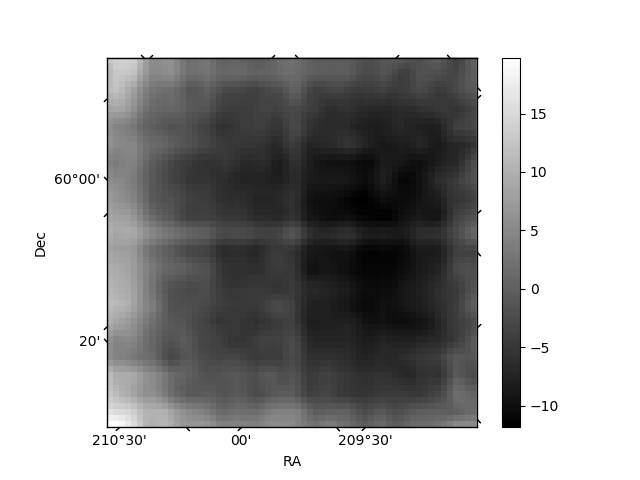
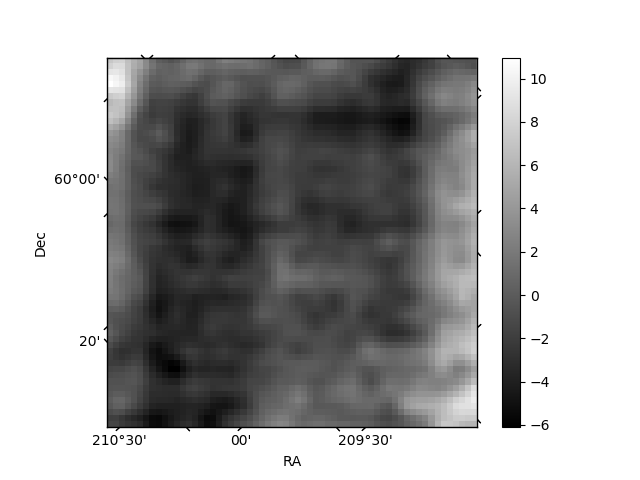
Quadrant B |
|---|---|---|---|
| Quadrant D | 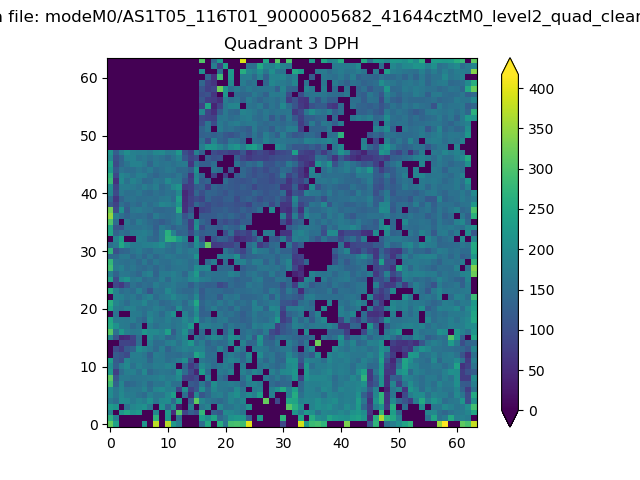 |
 |
Quadrant C |
| Plot type | Count rate plots | Images |
|---|---|---|
| Comparison with Poisson distribution Blue bars denote a histogram of data divided into 1 sec bins. Red curve is a Poisson curve with rate = median count rate of data. |
 |
 |
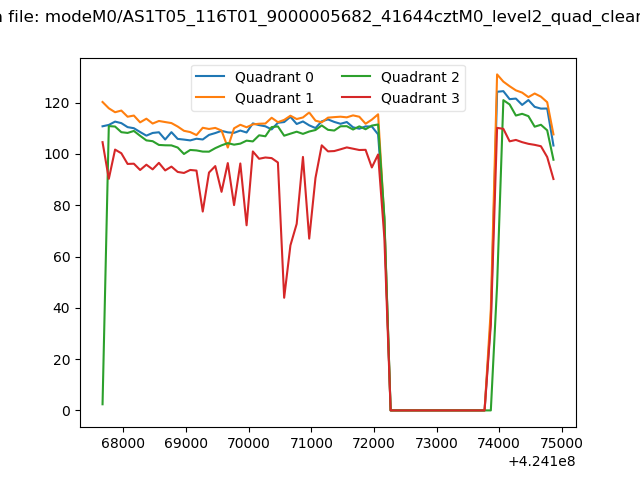
| Quadrant-wise count rates Data is divided into 100 sec bins |
 |
|
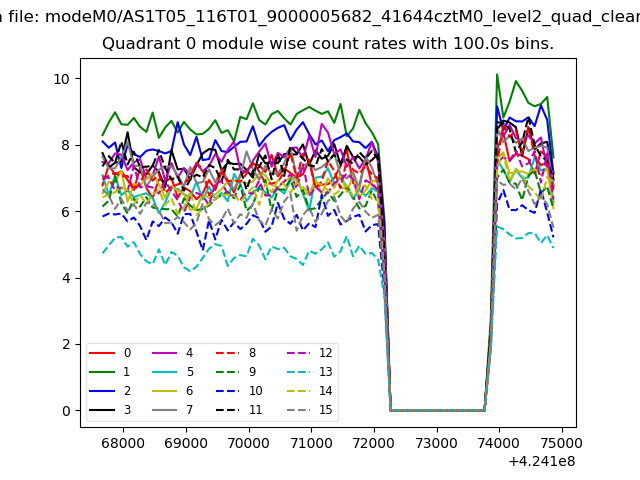
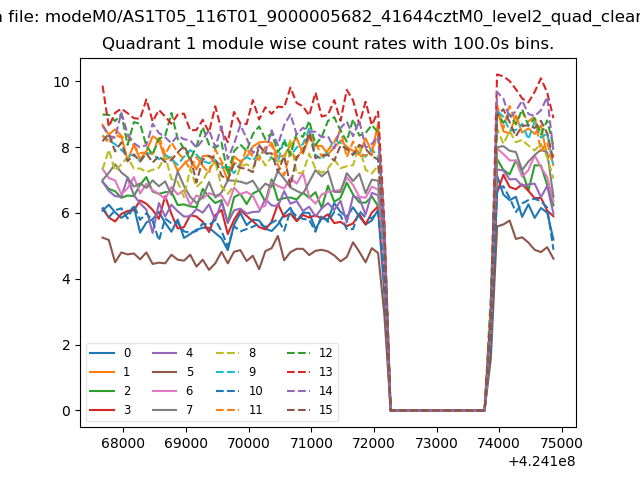
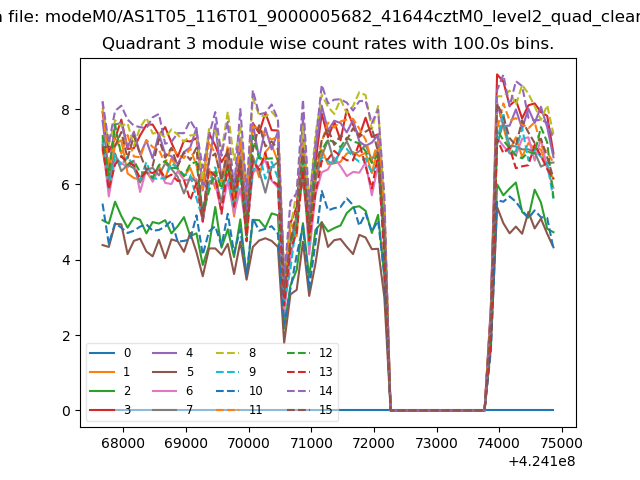
| Module-wise count rates for Quadrant A Data is divided into 100 sec bins |
 |
 |
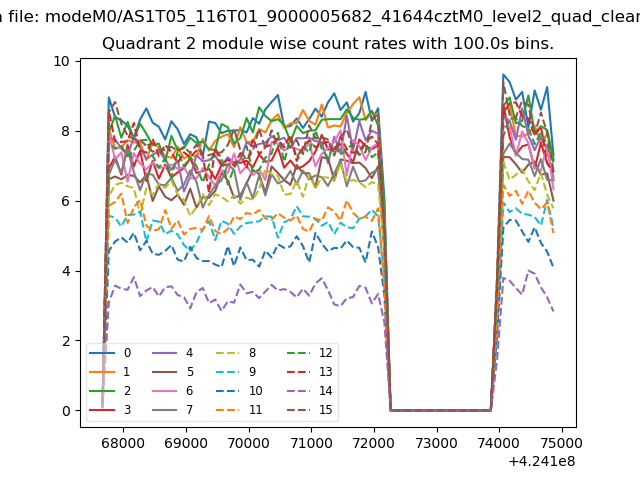
| Module-wise count rates for Quadrant B Data is divided into 100 sec bins |
 |
 |
| Module-wise count rates for Quadrant C Data is divided into 100 sec bins |
 |
 |
| Module-wise count rates for Quadrant D Data is divided into 100 sec bins |
 |
 |
| Parameter | Plot |
|---|---|
| CZT HV Monitor | 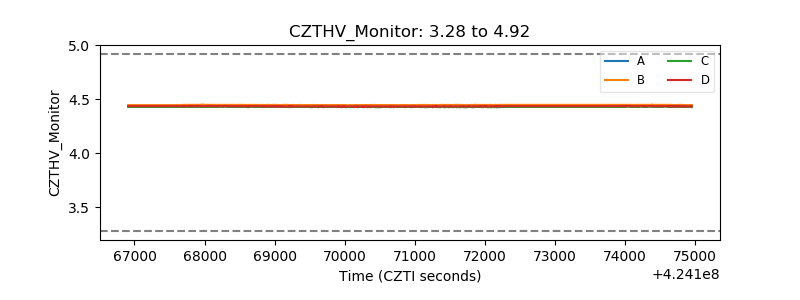 |
| D_VDD | 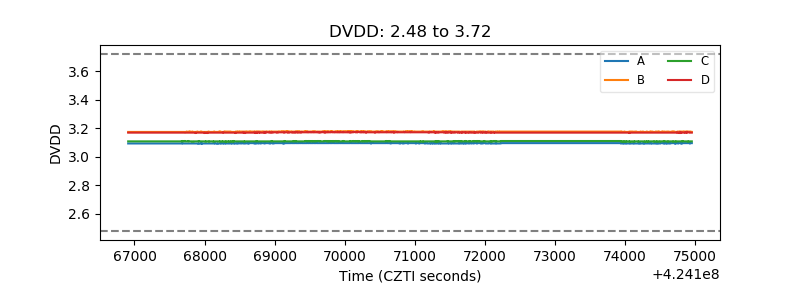 |
| Temperature 1 |  |
| Veto HV Monitor | 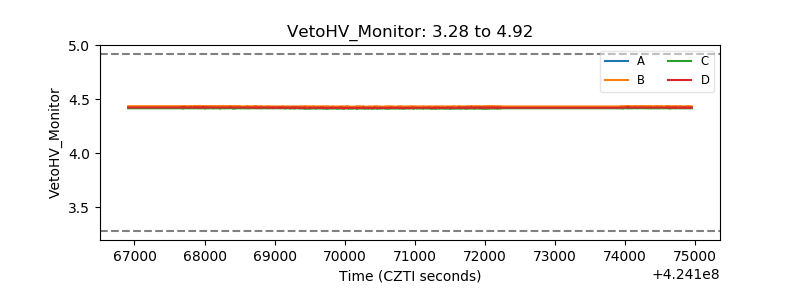 |
| Veto LLD | 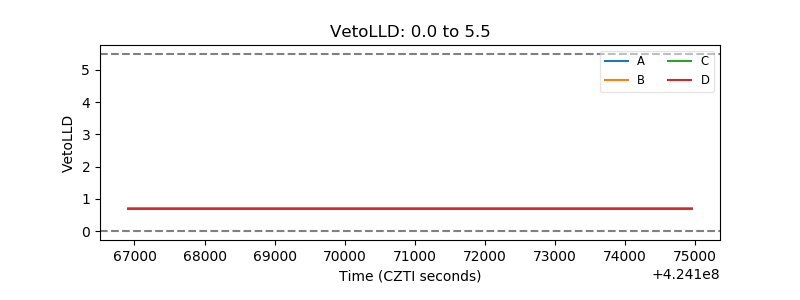 |
| Alpha Counter | 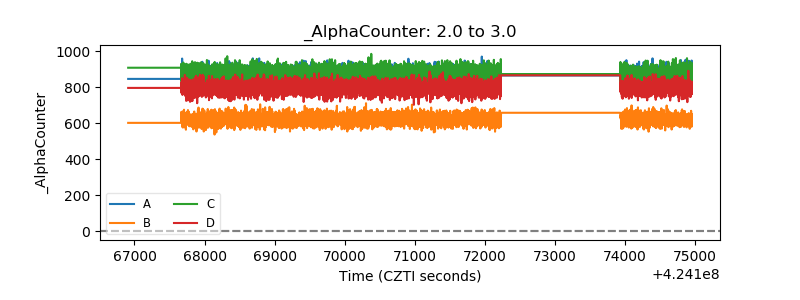 |
| _CPM_Rate | 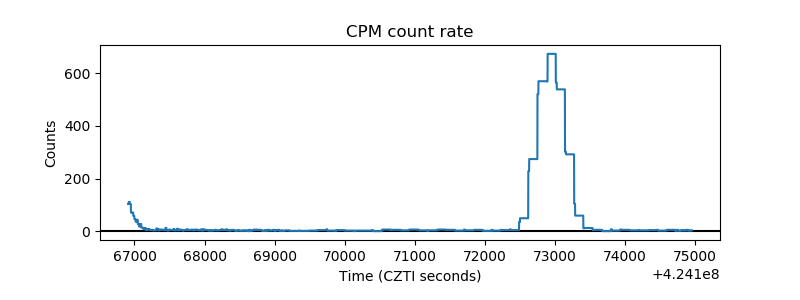 |
| CZT Counter | 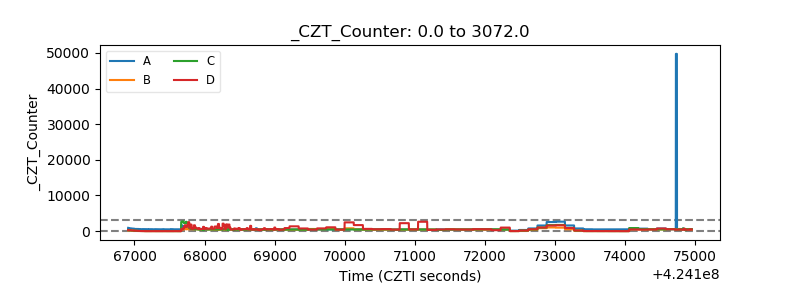 |
| +2.5 Volts monitor | 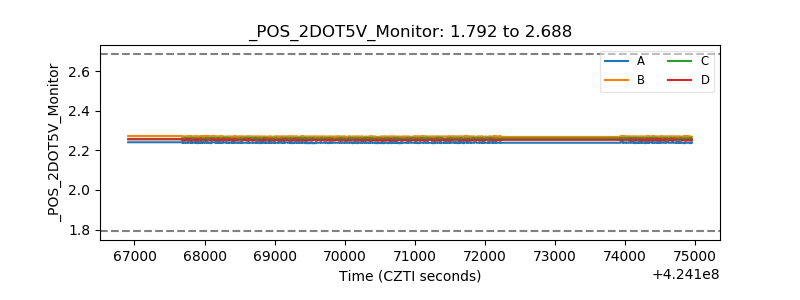 |
| +5 Volts monitor |  |
| _ROLL_ROT | 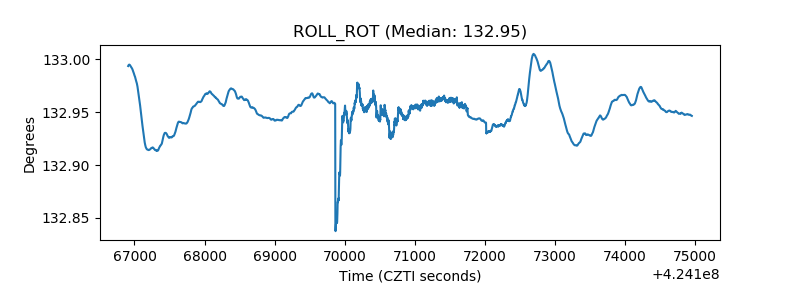 |
| _Roll_DEC | 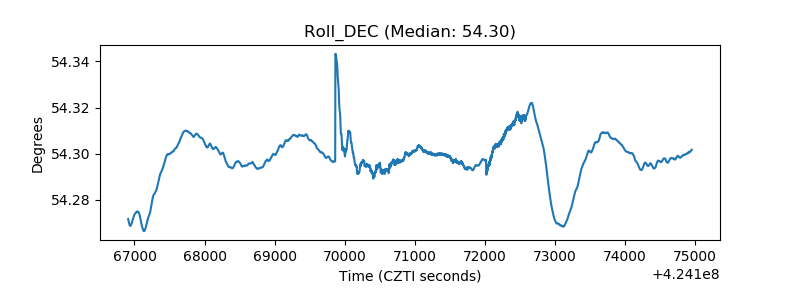 |
| _Roll_RA | 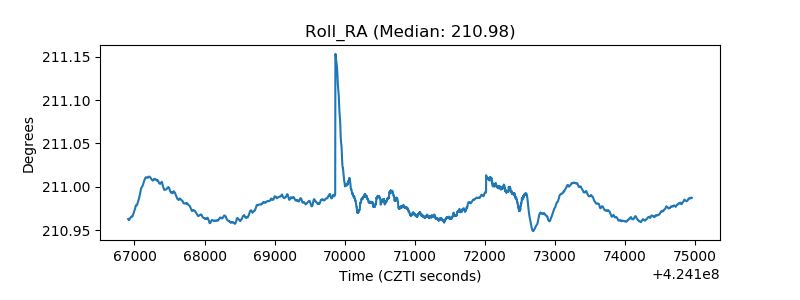 |
| Veto Counter |  |