| Param | Original file | Final file |
|---|---|---|
| Filename | modeM0/AS1T05_116T01_9000005682_41646cztM0_level2.fits | modeM0/AS1T05_116T01_9000005682_41646cztM0_level2_quad_clean.evt |
| Size (bytes) | 351,990,720 | 92,928,960 |
| Size | 335.7 MB | 88.6 MB |
| Events in quadrant A | 2,997,190 | 641,462 |
| Events in quadrant B | 2,732,152 | 653,870 |
| Events in quadrant C | 3,031,729 | 593,855 |
| Events in quadrant D | 3,844,678 | 543,561 |
| Mode M0 | |||
|---|---|---|---|
| Quadrant | BADHDUFLAG | Total packets | Discarded packets |
| A | 0 | 12201 | 2 |
| B | 0 | 11403 | 2 |
| C | 0 | 12331 | 3 |
| D | 0 | 15105 | 2 |
| Mode M9 | |||
|---|---|---|---|
| Quadrant | BADHDUFLAG | Total packets | Discarded packets |
| A | 0 | 24 | 0 |
| B | 0 | 25 | 0 |
| C | 0 | 25 | 0 |
| D | 0 | 25 | 0 |
| Mode SS | |||
|---|---|---|---|
| Quadrant | BADHDUFLAG | Total packets | Discarded packets |
| A | 0 | 112 | 0 |
| B | 0 | 112 | 0 |
| C | 0 | 112 | 0 |
| D | 0 | 112 | 0 |
| Quadrant | Total seconds | Saturated seconds | Saturation percentage |
|---|---|---|---|
| A | 5442 | 17 | 0.312385% |
| B | 5442 | 17 | 0.312385% |
| C | 5441 | 185 | 3.400110% |
| D | 5441 | 336 | 6.175335% |
Noise dominated data is calculated using 1-second bins in cleaned event files. If a bin has >2000 counts, and if more than 50% of those come from <1% of pixels, then it is considered to be noise-dominated and hence unusable.
| Quadrant | # 1 sec bins | Bins with >0 counts | Bins with >2000 counts | High rate bins dominated by noise | Noise dominated (total time) | Noise dominated (detector-on time) | Marked lightcurve |
|---|---|---|---|---|---|---|---|
| A | 7296 | 5443 | 4 | 4 | 0.05% | 0.07% | 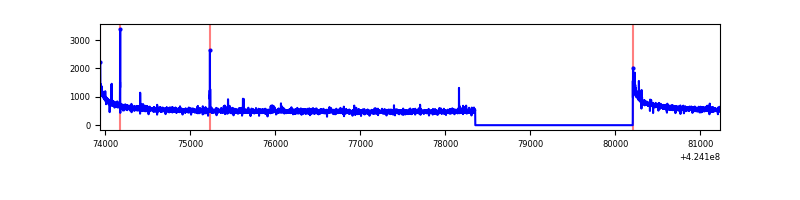 |
| B | 7296 | 5443 | 8 | 8 | 0.11% | 0.15% | 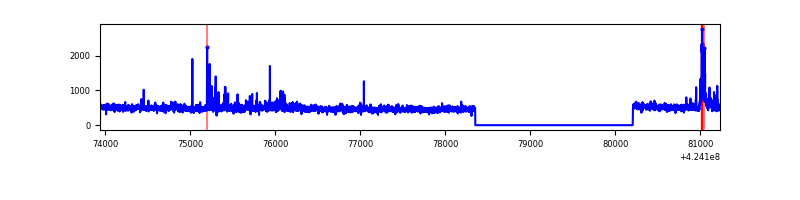 |
| C | 7295 | 5442 | 172 | 172 | 2.36% | 3.16% | 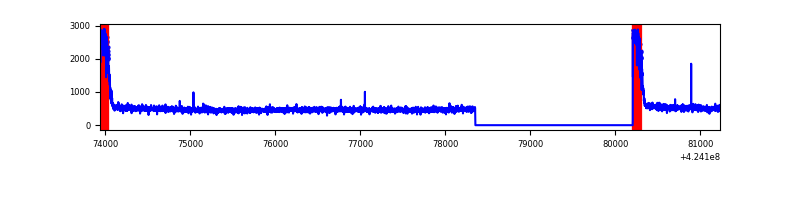 |
| D | 7295 | 5442 | 295 | 295 | 4.04% | 5.42% | 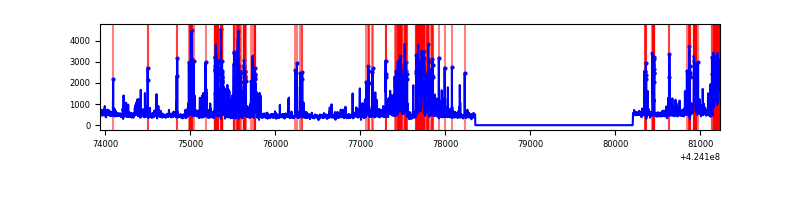 |
Top three noisy pixels from each quadrant. If the there are fewer than three noisy pixels in the level2.evt file, extra rows are filled as -1
| Pixel properties | Quadrant properties | ||||||
|---|---|---|---|---|---|---|---|
| Quadrant | DetID | PixID | Counts | Sigma | Mean | Median | Sigma |
| A | 10 | 83 | 541848 | 4258.76 | 622 | 609 | 127.1 |
| A | 13 | 248 | 23624 | 181.09 | 622 | 609 | 127.1 |
| A | 2 | 79 | 17497 | 132.88 | 622 | 609 | 127.1 |
| B | 7 | 202 | 136306 | 1146.96 | 612 | 595 | 118.3 |
| B | 0 | 186 | 93844 | 788.09 | 612 | 595 | 118.3 |
| B | 0 | 190 | 70554 | 591.26 | 612 | 595 | 118.3 |
| C | 0 | 10 | 497710 | 3610.28 | 592 | 596 | 137.7 |
| C | 15 | 214 | 221237 | 1602.4 | 592 | 596 | 137.7 |
| C | 15 | 159 | 6745 | 44.66 | 592 | 596 | 137.7 |
| D | 13 | 249 | 990442 | 6839.67 | 593 | 576 | 144.7 |
| D | 2 | 249 | 200358 | 1380.43 | 593 | 576 | 144.7 |
| D | 1 | 47 | 125007 | 859.78 | 593 | 576 | 144.7 |
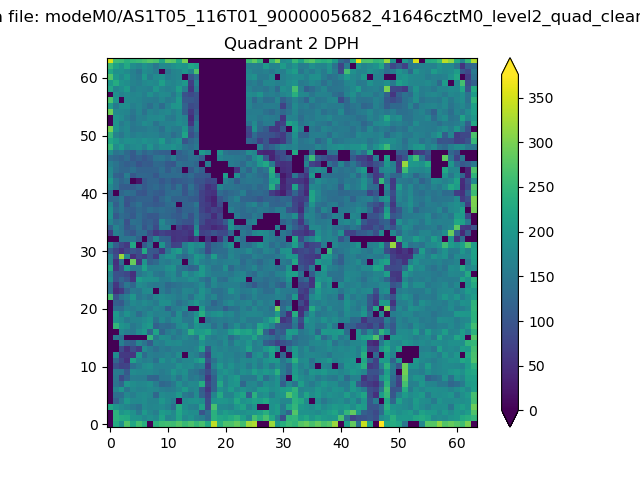
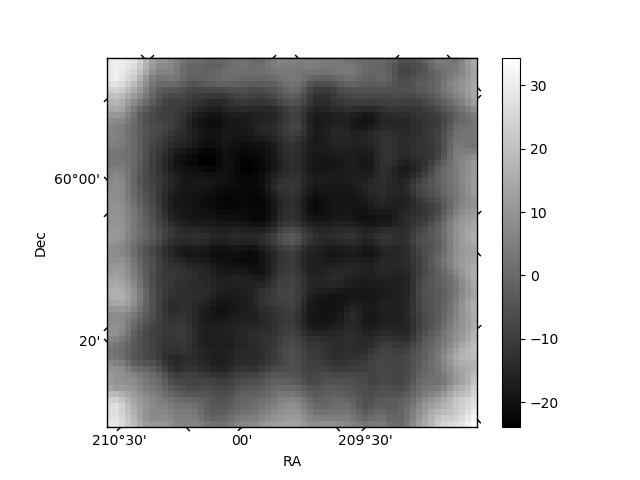
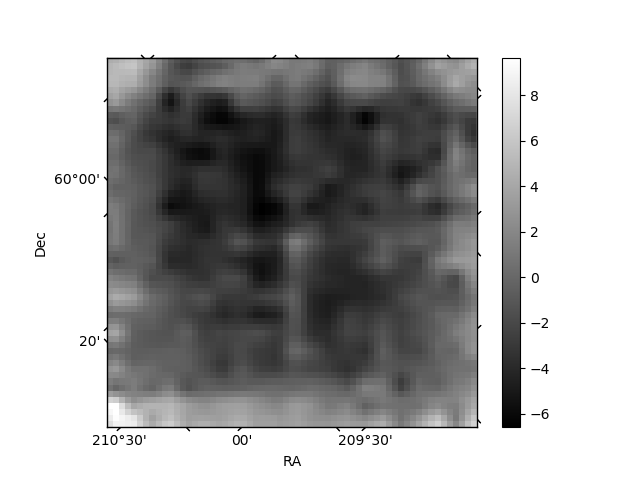
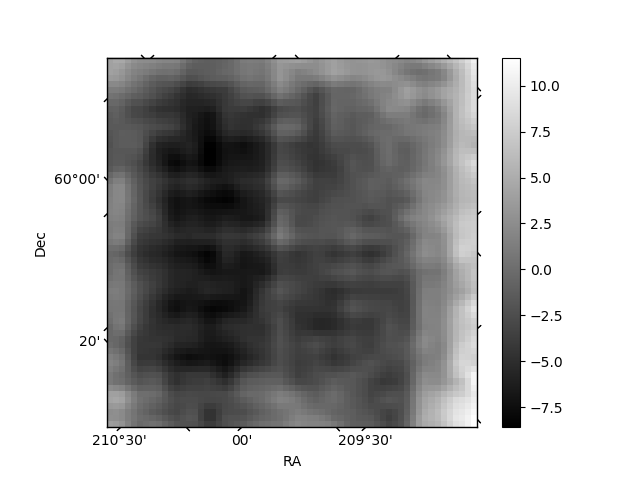
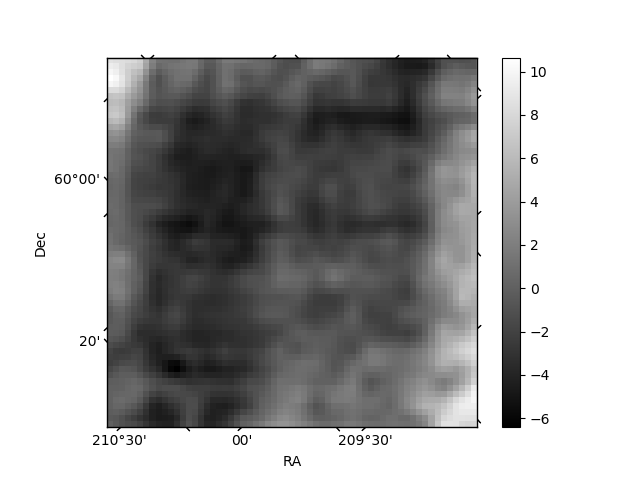
Histogram calculated using DETX and DETY for each event in the final _common_clean file
| Quadrant A | 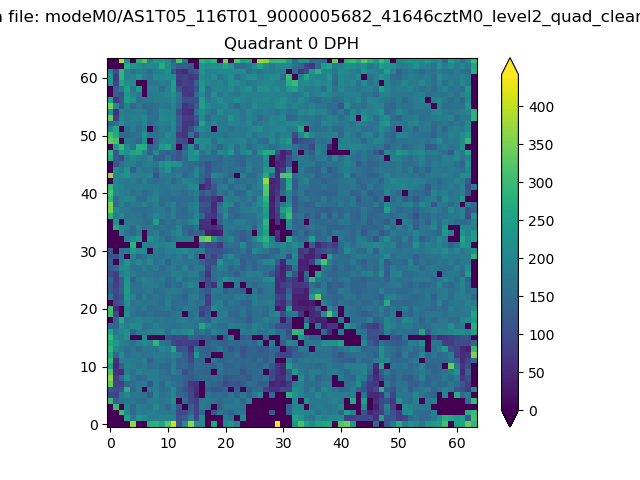 |
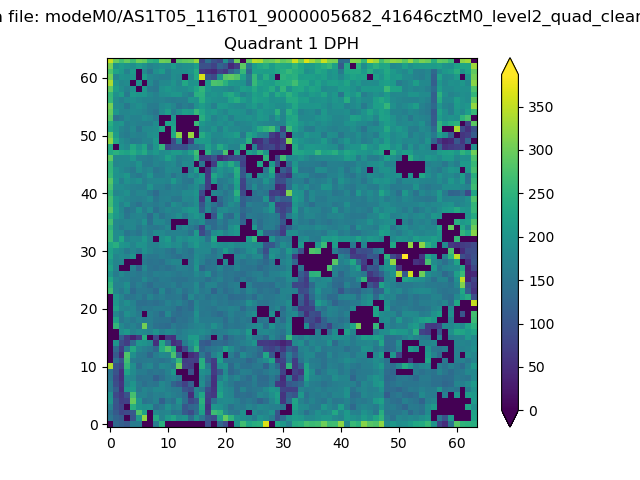 |
Quadrant B |
|---|---|---|---|
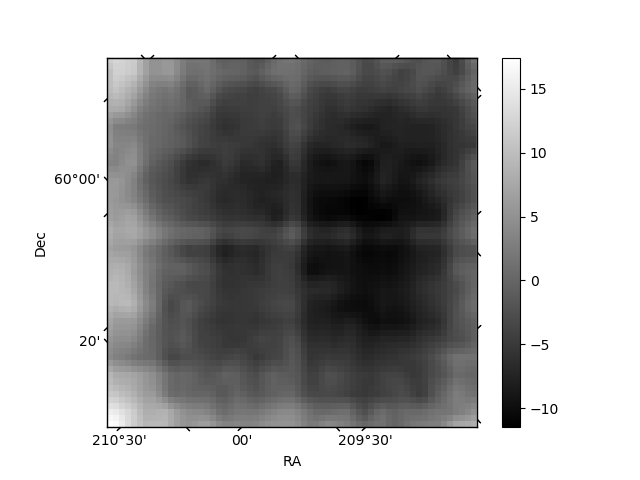
| Quadrant D | 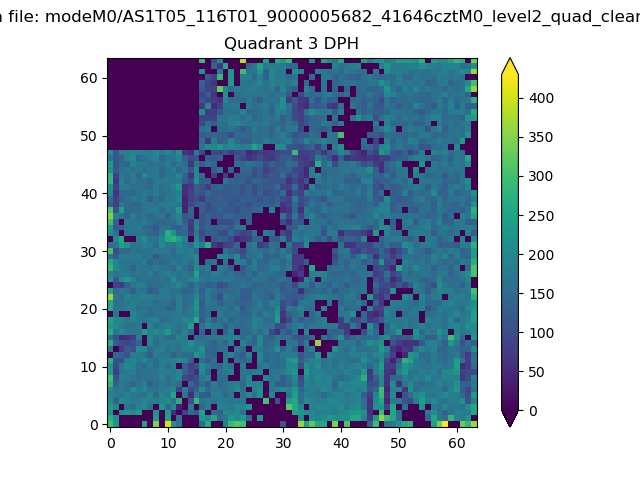 |
 |
Quadrant C |
| Plot type | Count rate plots | Images |
|---|---|---|
| Comparison with Poisson distribution Blue bars denote a histogram of data divided into 1 sec bins. Red curve is a Poisson curve with rate = median count rate of data. |
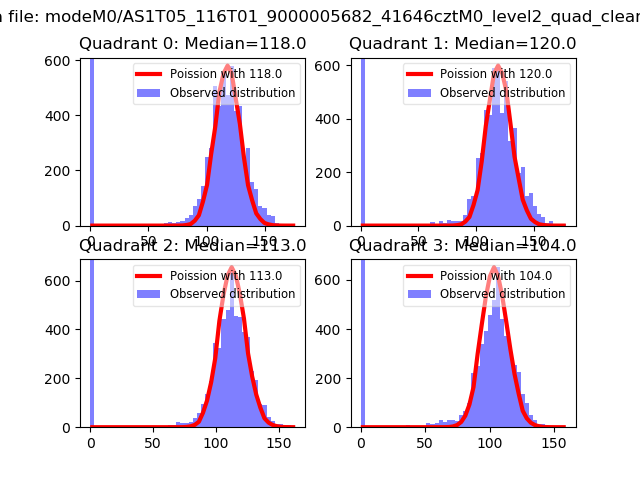 |
 |
| Quadrant-wise count rates Data is divided into 100 sec bins |
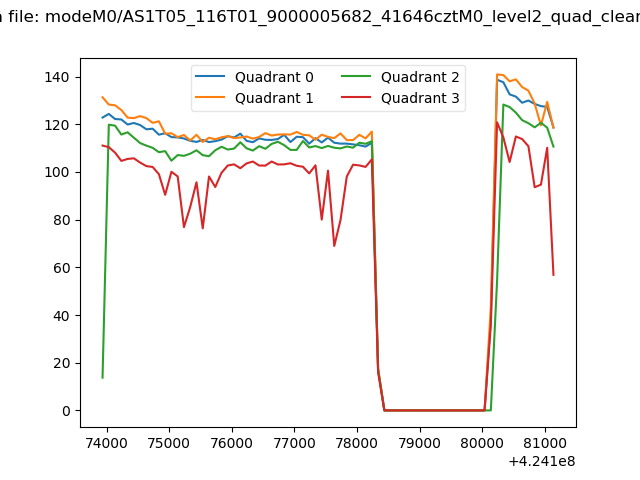 |
|
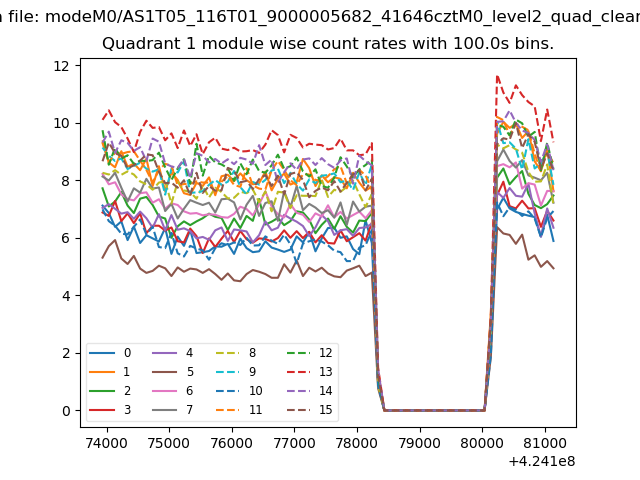
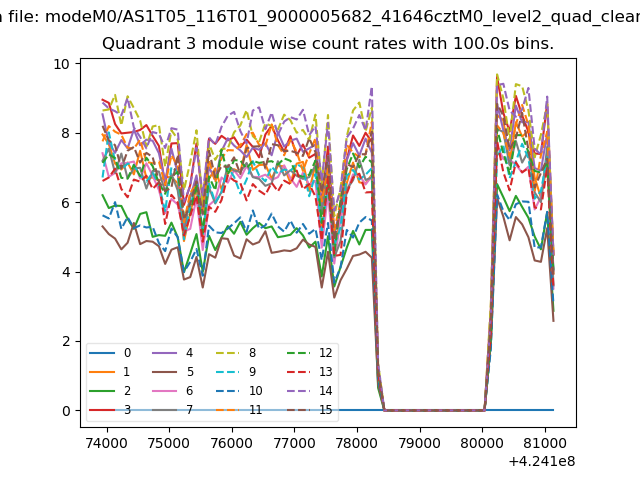
| Module-wise count rates for Quadrant A Data is divided into 100 sec bins |
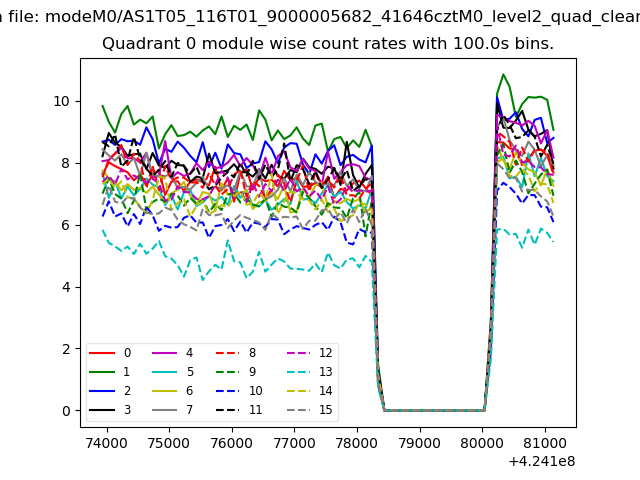 |
 |
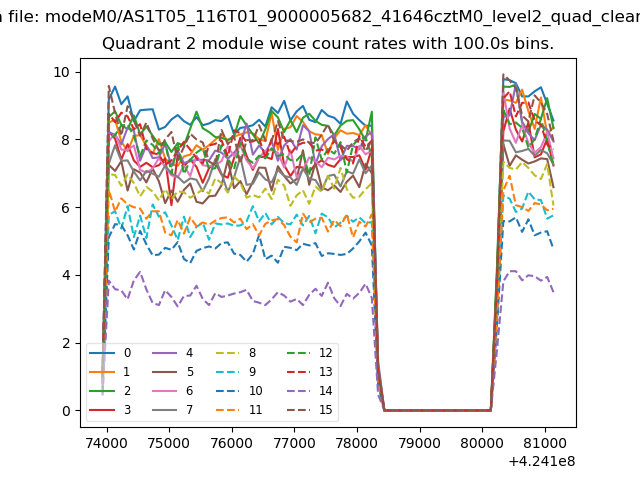
| Module-wise count rates for Quadrant B Data is divided into 100 sec bins |
 |
 |
| Module-wise count rates for Quadrant C Data is divided into 100 sec bins |
 |
 |
| Module-wise count rates for Quadrant D Data is divided into 100 sec bins |
 |
 |
| Parameter | Plot |
|---|---|
| CZT HV Monitor | 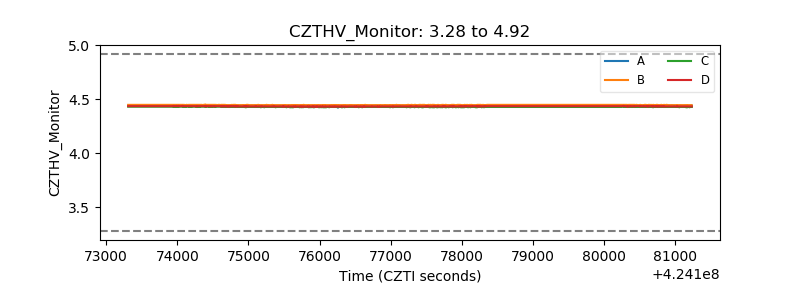 |
| D_VDD | 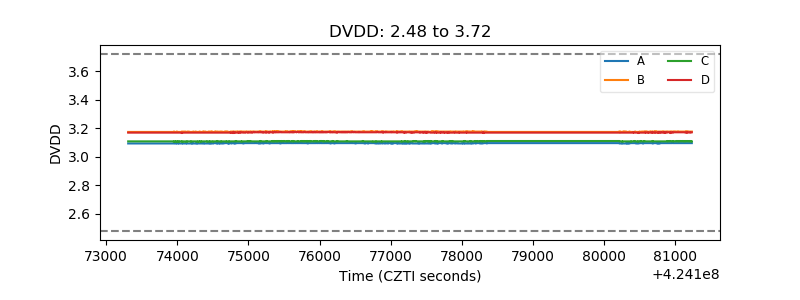 |
| Temperature 1 | 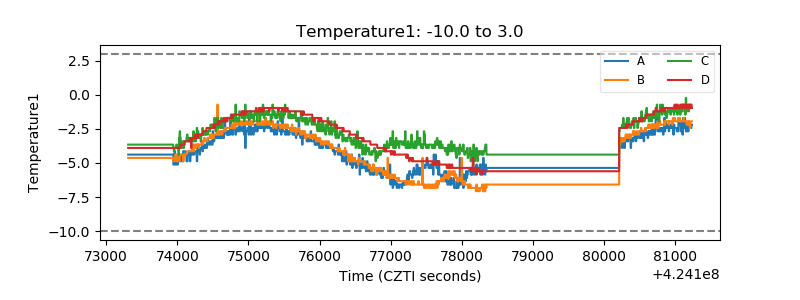 |
| Veto HV Monitor | 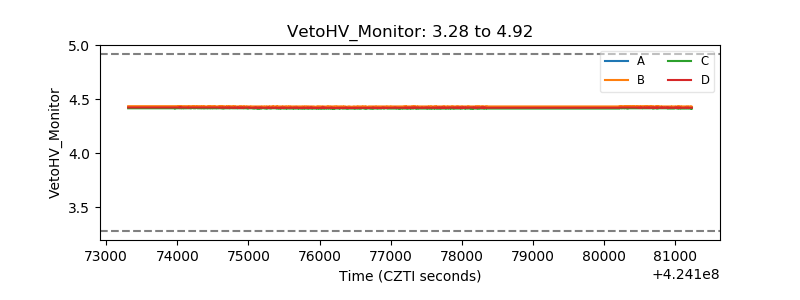 |
| Veto LLD | 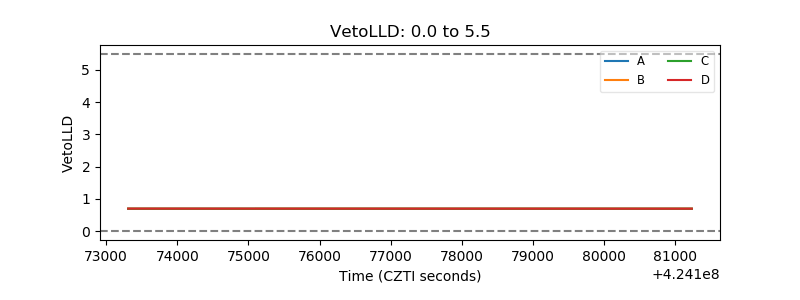 |
| Alpha Counter | 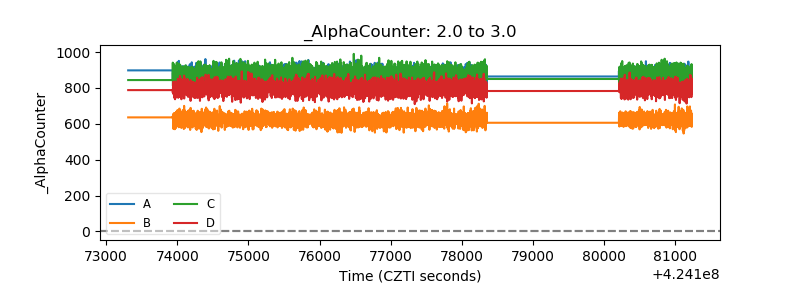 |
| _CPM_Rate | 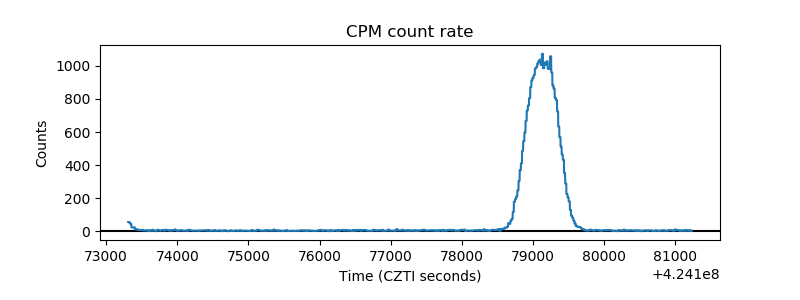 |
| CZT Counter | 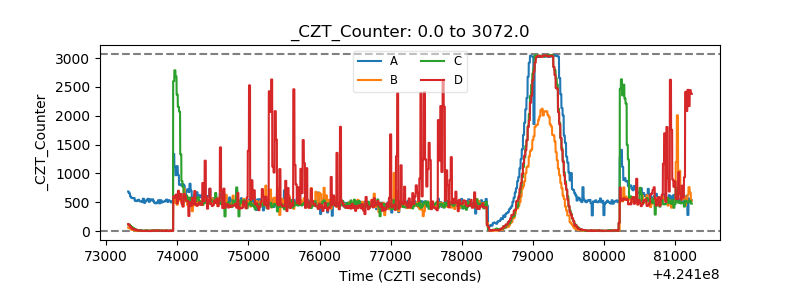 |
| +2.5 Volts monitor | 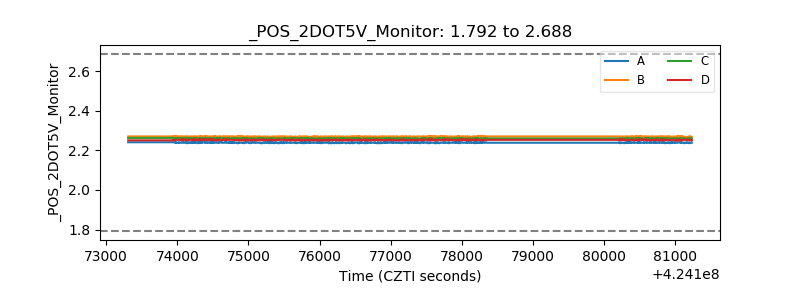 |
| +5 Volts monitor |  |
| _ROLL_ROT | 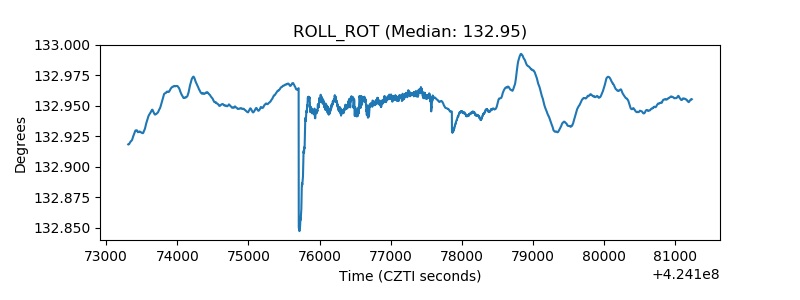 |
| _Roll_DEC | 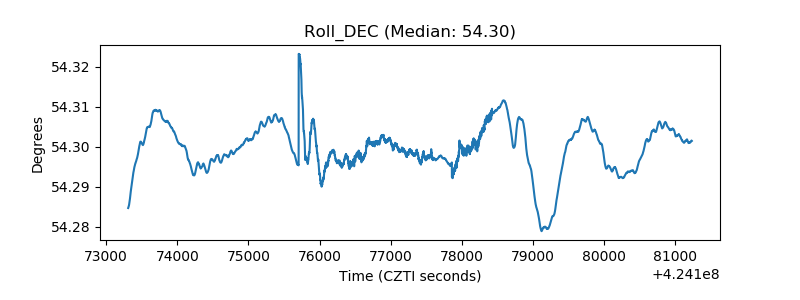 |
| _Roll_RA | 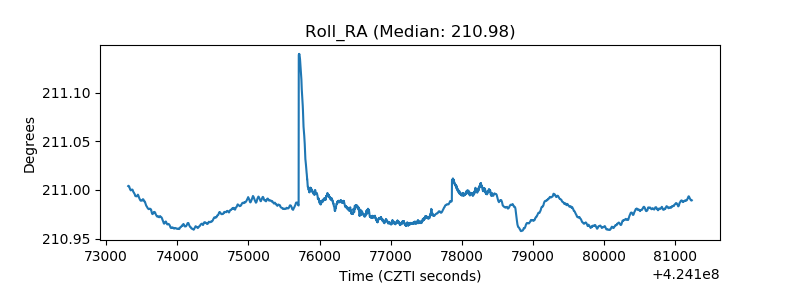 |
| Veto Counter |  |