| Param | Original file | Final file |
|---|---|---|
| Filename | modeM0/AS1T05_116T01_9000005682_41647cztM0_level2.fits | modeM0/AS1T05_116T01_9000005682_41647cztM0_level2_quad_clean.evt |
| Size (bytes) | 359,622,720 | 93,588,480 |
| Size | 343.0 MB | 89.3 MB |
| Events in quadrant A | 2,987,697 | 650,073 |
| Events in quadrant B | 2,664,508 | 660,042 |
| Events in quadrant C | 2,987,964 | 604,844 |
| Events in quadrant D | 4,262,487 | 551,204 |
| Mode M0 | |||
|---|---|---|---|
| Quadrant | BADHDUFLAG | Total packets | Discarded packets |
| A | 0 | 12118 | 1 |
| B | 0 | 11174 | 1 |
| C | 0 | 11994 | 1 |
| D | 0 | 16227 | 1 |
| Mode M9 | |||
|---|---|---|---|
| Quadrant | BADHDUFLAG | Total packets | Discarded packets |
| A | 0 | 20 | 0 |
| B | 0 | 20 | 0 |
| C | 0 | 20 | 0 |
| D | 0 | 20 | 0 |
| Mode SS | |||
|---|---|---|---|
| Quadrant | BADHDUFLAG | Total packets | Discarded packets |
| A | 0 | 106 | 0 |
| B | 0 | 106 | 0 |
| C | 0 | 106 | 0 |
| D | 0 | 106 | 0 |
| Quadrant | Total seconds | Saturated seconds | Saturation percentage |
|---|---|---|---|
| A | 5258 | 29 | 0.551541% |
| B | 5258 | 15 | 0.285280% |
| C | 5258 | 184 | 3.499429% |
| D | 5258 | 366 | 6.960822% |
Noise dominated data is calculated using 1-second bins in cleaned event files. If a bin has >2000 counts, and if more than 50% of those come from <1% of pixels, then it is considered to be noise-dominated and hence unusable.
| Quadrant | # 1 sec bins | Bins with >0 counts | Bins with >2000 counts | High rate bins dominated by noise | Noise dominated (total time) | Noise dominated (detector-on time) | Marked lightcurve |
|---|---|---|---|---|---|---|---|
| A | 7231 | 5259 | 16 | 16 | 0.22% | 0.30% | 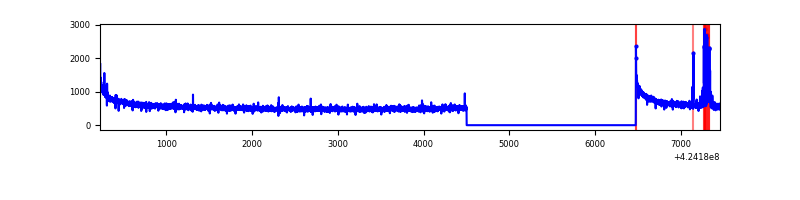 |
| B | 7231 | 5259 | 9 | 9 | 0.12% | 0.17% | 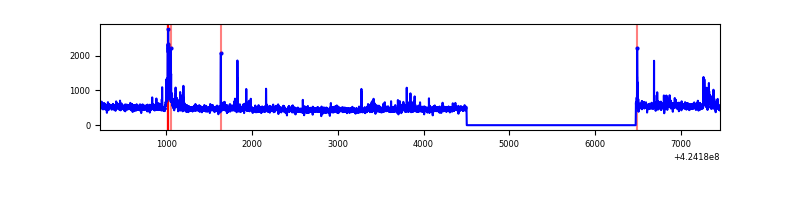 |
| C | 7231 | 5259 | 167 | 167 | 2.31% | 3.18% | 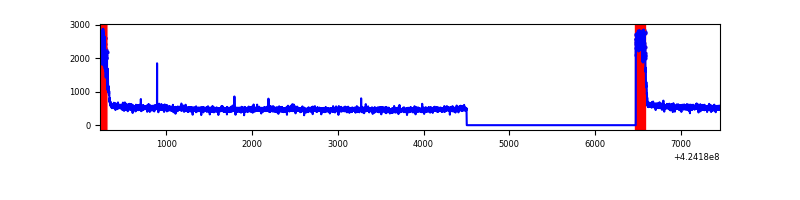 |
| D | 7231 | 5259 | 343 | 343 | 4.74% | 6.52% | 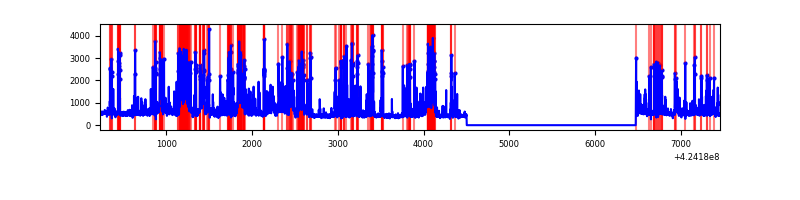 |
Top three noisy pixels from each quadrant. If the there are fewer than three noisy pixels in the level2.evt file, extra rows are filled as -1
| Pixel properties | Quadrant properties | ||||||
|---|---|---|---|---|---|---|---|
| Quadrant | DetID | PixID | Counts | Sigma | Mean | Median | Sigma |
| A | 10 | 83 | 528330 | 4187.88 | 613 | 600 | 126.0 |
| A | 13 | 248 | 80917 | 637.37 | 613 | 600 | 126.0 |
| A | 13 | 6 | 8913 | 65.97 | 613 | 600 | 126.0 |
| B | 0 | 186 | 102026 | 879.2 | 603 | 588 | 115.4 |
| B | 7 | 202 | 93841 | 808.26 | 603 | 588 | 115.4 |
| B | 0 | 190 | 50073 | 428.9 | 603 | 588 | 115.4 |
| C | 0 | 10 | 491411 | 3612.35 | 585 | 589 | 135.9 |
| C | 15 | 214 | 211689 | 1553.65 | 585 | 589 | 135.9 |
| C | 15 | 159 | 5436 | 35.67 | 585 | 589 | 135.9 |
| D | 13 | 249 | 1682323 | 11870.74 | 585 | 570 | 141.7 |
| D | 1 | 47 | 160833 | 1131.22 | 585 | 570 | 141.7 |
| D | 2 | 249 | 48330 | 337.12 | 585 | 570 | 141.7 |
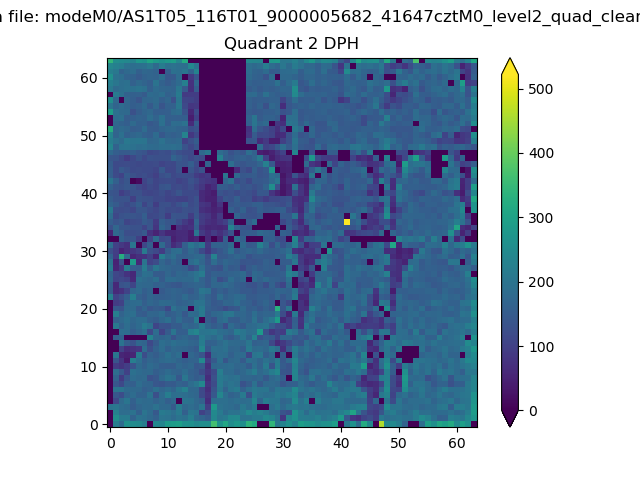
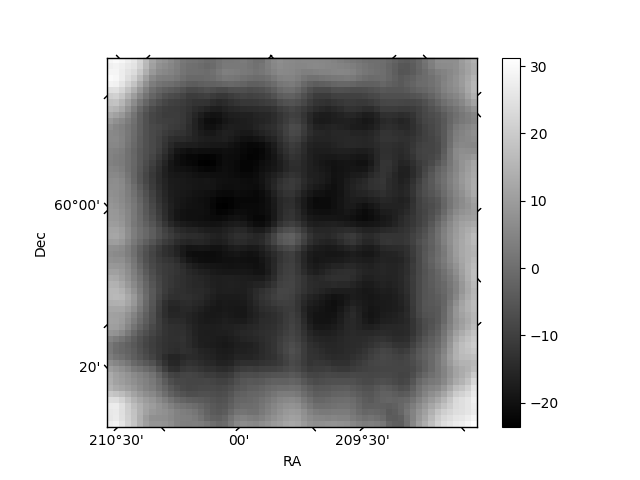
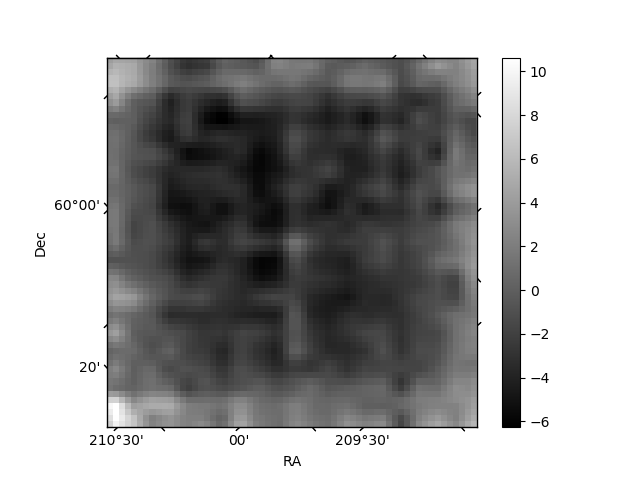
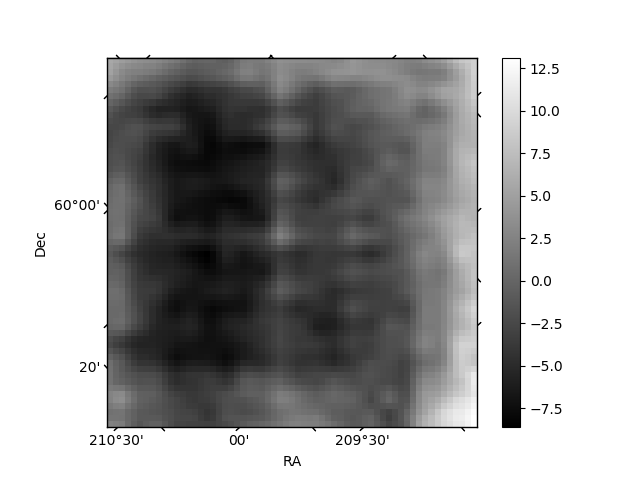
Histogram calculated using DETX and DETY for each event in the final _common_clean file
| Quadrant A | 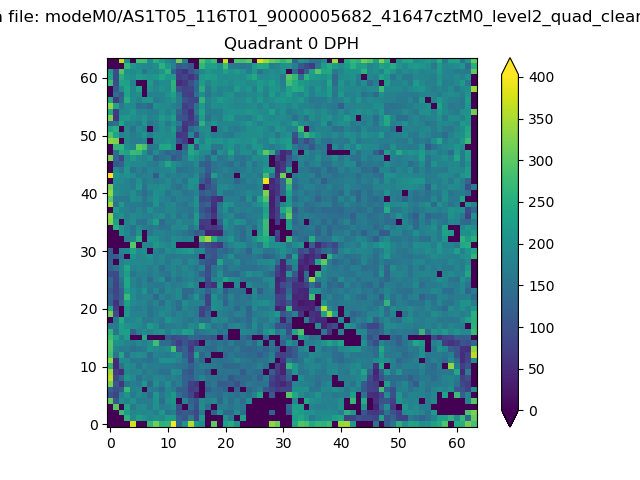 |
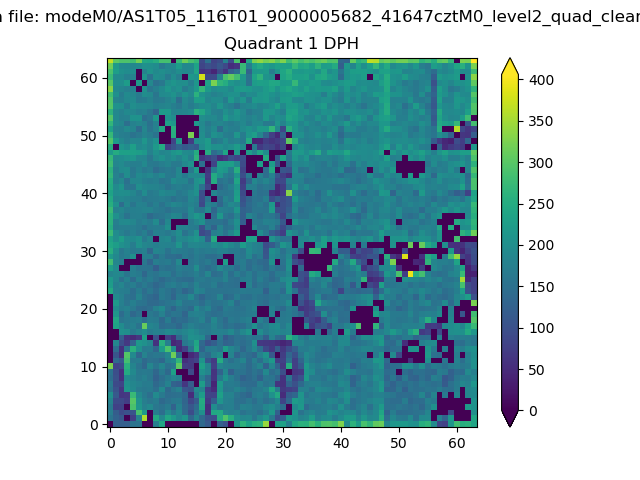 |
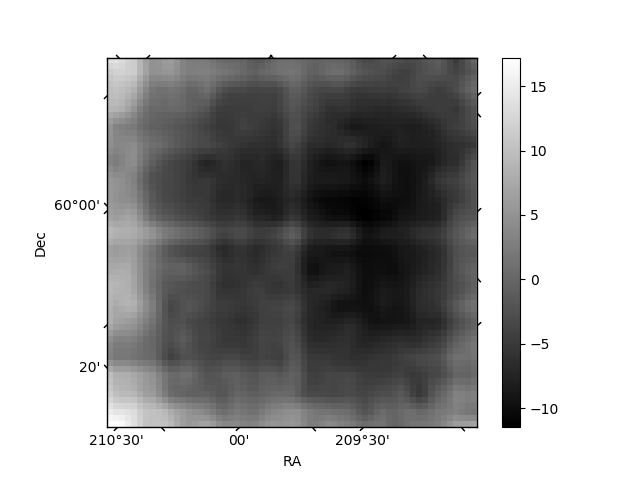
Quadrant B |
|---|---|---|---|
| Quadrant D | 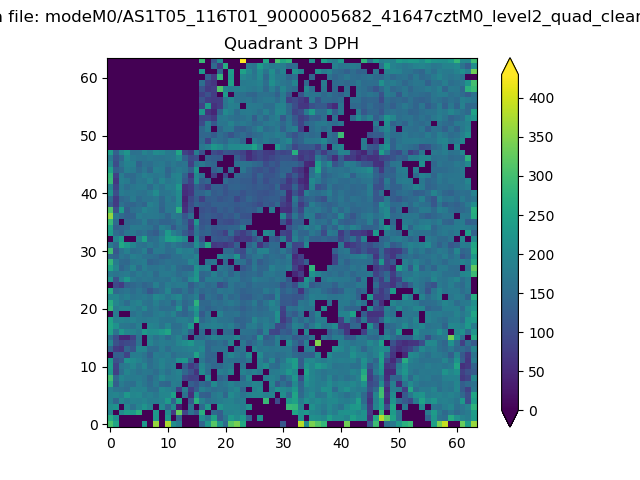 |
 |
Quadrant C |
| Plot type | Count rate plots | Images |
|---|---|---|
| Comparison with Poisson distribution Blue bars denote a histogram of data divided into 1 sec bins. Red curve is a Poisson curve with rate = median count rate of data. |
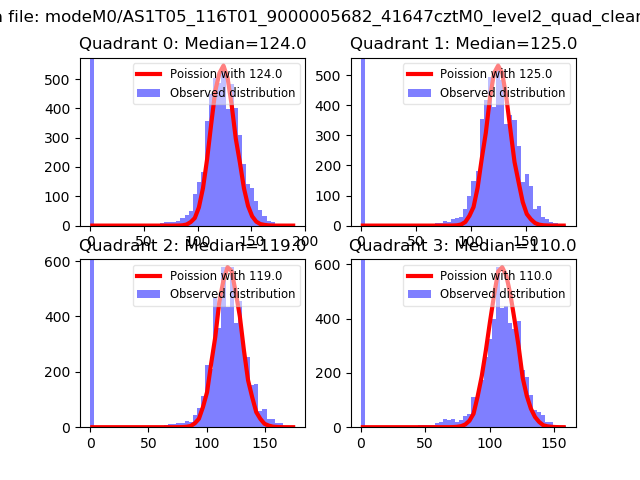 |
 |
| Quadrant-wise count rates Data is divided into 100 sec bins |
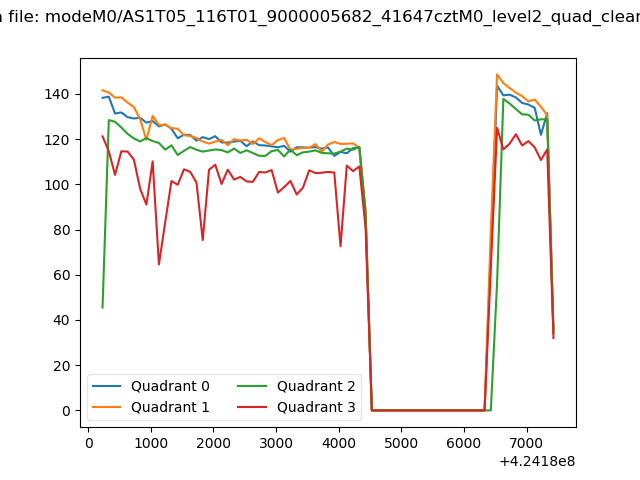 |
|
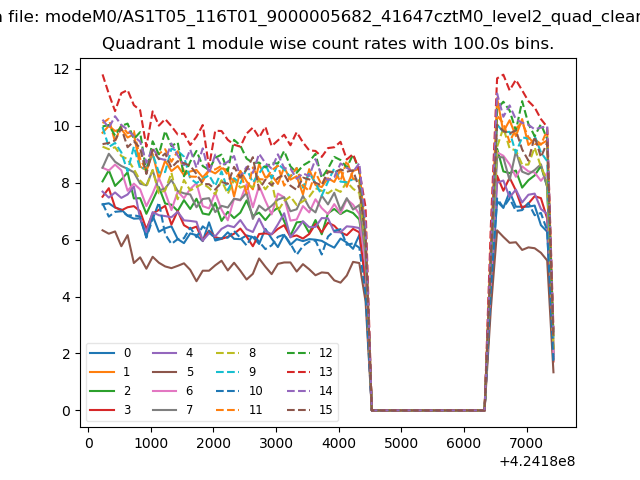
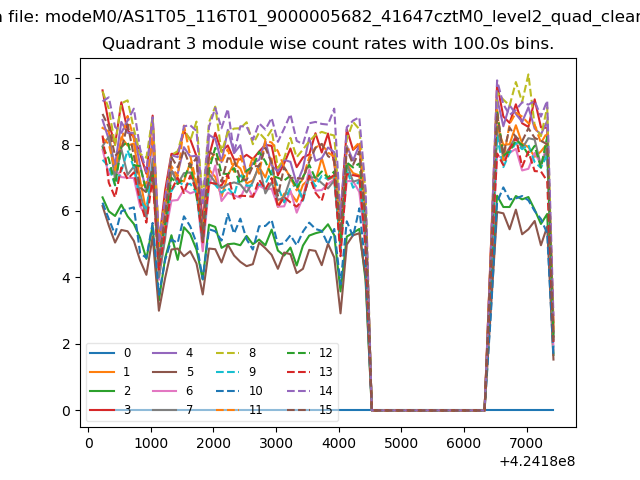
| Module-wise count rates for Quadrant A Data is divided into 100 sec bins |
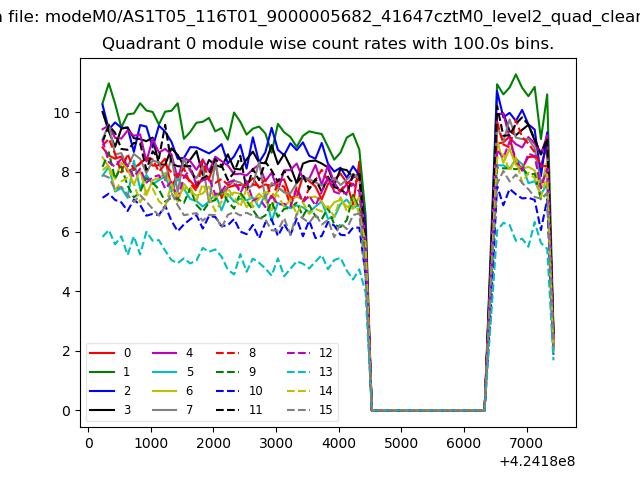 |
 |
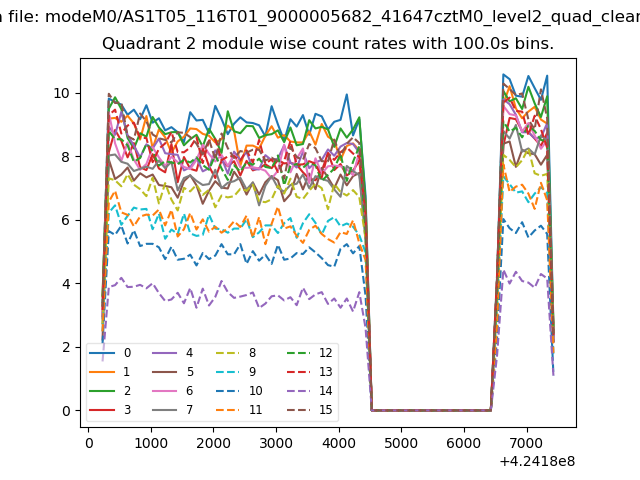
| Module-wise count rates for Quadrant B Data is divided into 100 sec bins |
 |
 |
| Module-wise count rates for Quadrant C Data is divided into 100 sec bins |
 |
 |
| Module-wise count rates for Quadrant D Data is divided into 100 sec bins |
 |
 |
| Parameter | Plot |
|---|---|
| CZT HV Monitor |  |
| D_VDD | 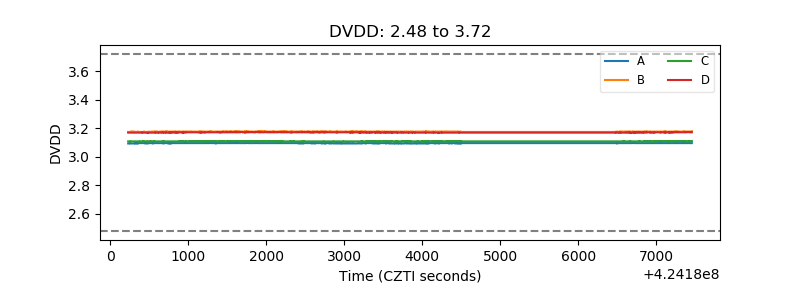 |
| Temperature 1 | 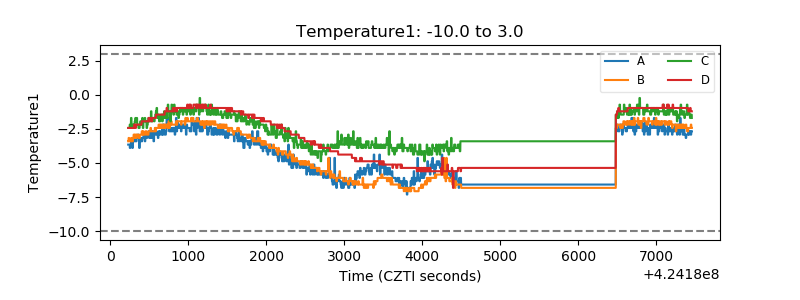 |
| Veto HV Monitor | 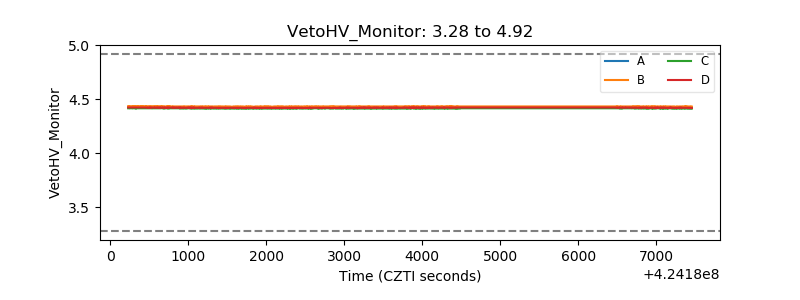 |
| Veto LLD | 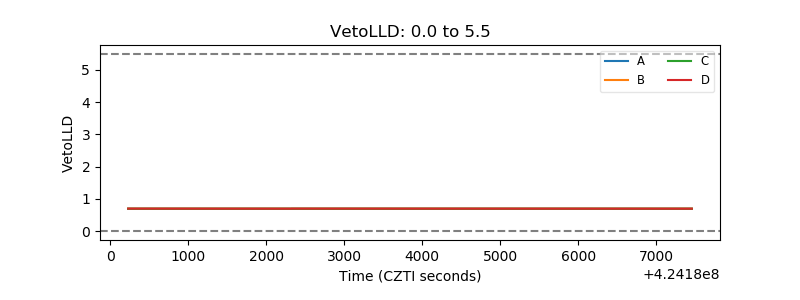 |
| Alpha Counter | 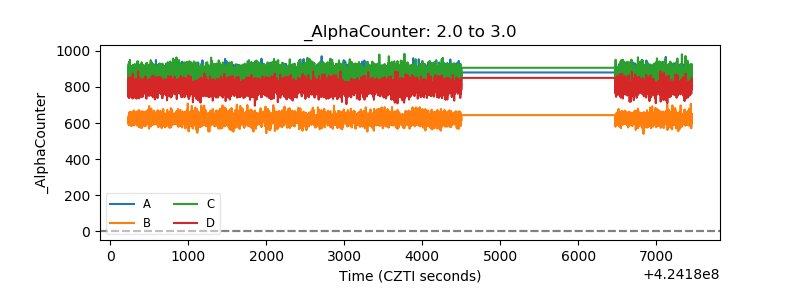 |
| _CPM_Rate |  |
| CZT Counter | 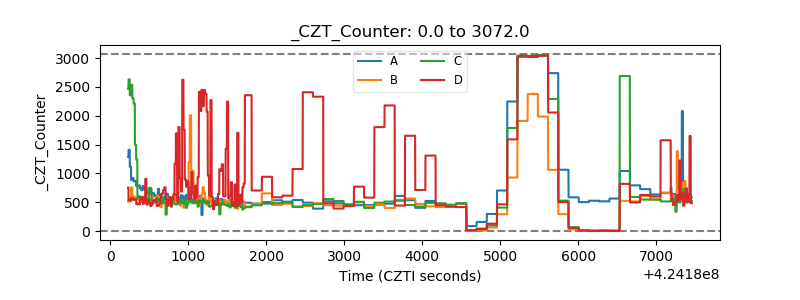 |
| +2.5 Volts monitor | 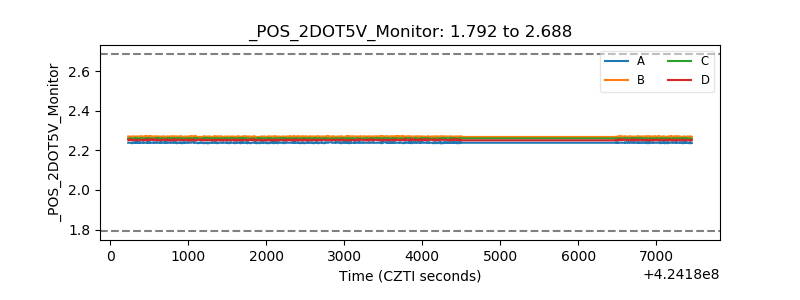 |
| +5 Volts monitor |  |
| _ROLL_ROT | 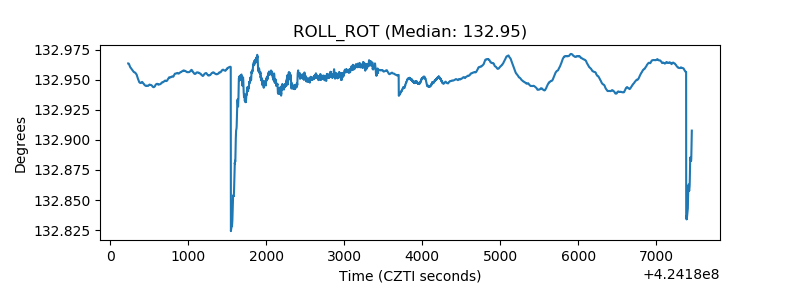 |
| _Roll_DEC | 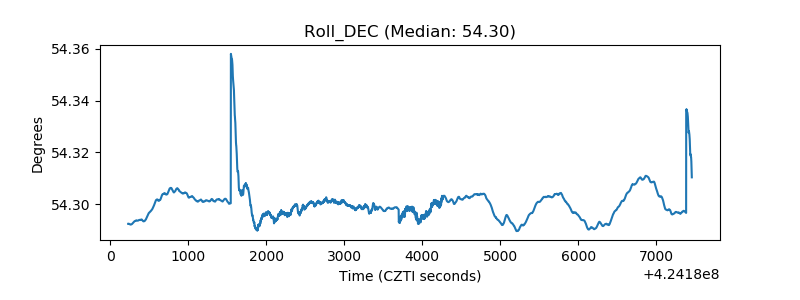 |
| _Roll_RA | 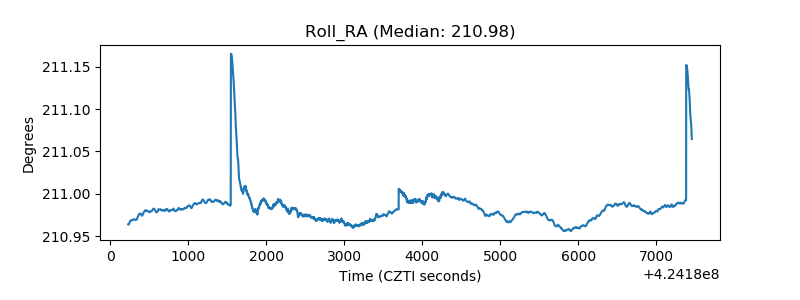 |
| Veto Counter | 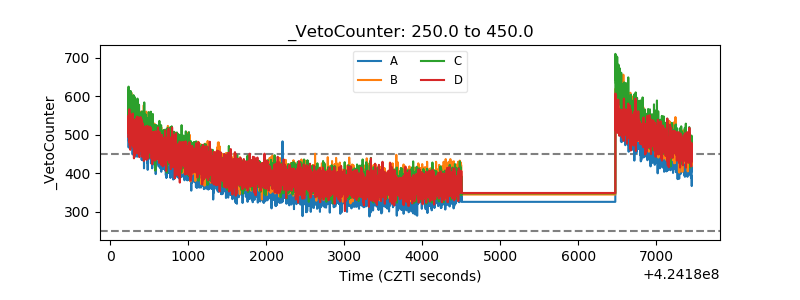 |