| Param | Original file | Final file |
|---|---|---|
| Filename | modeM0/AS1T05_116T01_9000005682_41648cztM0_level2.fits | modeM0/AS1T05_116T01_9000005682_41648cztM0_level2_quad_clean.evt |
| Size (bytes) | 332,081,280 | 92,761,920 |
| Size | 316.7 MB | 88.5 MB |
| Events in quadrant A | 2,957,912 | 639,761 |
| Events in quadrant B | 2,600,974 | 651,571 |
| Events in quadrant C | 3,081,765 | 596,049 |
| Events in quadrant D | 3,255,977 | 565,583 |
| Mode M0 | |||
|---|---|---|---|
| Quadrant | BADHDUFLAG | Total packets | Discarded packets |
| A | 0 | 11921 | 3 |
| B | 0 | 10947 | 2 |
| C | 0 | 12255 | 2 |
| D | 0 | 13099 | 2 |
| Mode M9 | |||
|---|---|---|---|
| Quadrant | BADHDUFLAG | Total packets | Discarded packets |
| A | 0 | 21 | 0 |
| B | 0 | 21 | 0 |
| C | 0 | 21 | 0 |
| D | 0 | 21 | 0 |
| Mode SS | |||
|---|---|---|---|
| Quadrant | BADHDUFLAG | Total packets | Discarded packets |
| A | 0 | 104 | 0 |
| B | 0 | 104 | 0 |
| C | 0 | 104 | 0 |
| D | 0 | 104 | 0 |
| Quadrant | Total seconds | Saturated seconds | Saturation percentage |
|---|---|---|---|
| A | 5081 | 32 | 0.629797% |
| B | 5081 | 6 | 0.118087% |
| C | 5081 | 226 | 4.447943% |
| D | 5082 | 161 | 3.168044% |
Noise dominated data is calculated using 1-second bins in cleaned event files. If a bin has >2000 counts, and if more than 50% of those come from <1% of pixels, then it is considered to be noise-dominated and hence unusable.
| Quadrant | # 1 sec bins | Bins with >0 counts | Bins with >2000 counts | High rate bins dominated by noise | Noise dominated (total time) | Noise dominated (detector-on time) | Marked lightcurve |
|---|---|---|---|---|---|---|---|
| A | 7174 | 5082 | 21 | 21 | 0.29% | 0.41% | 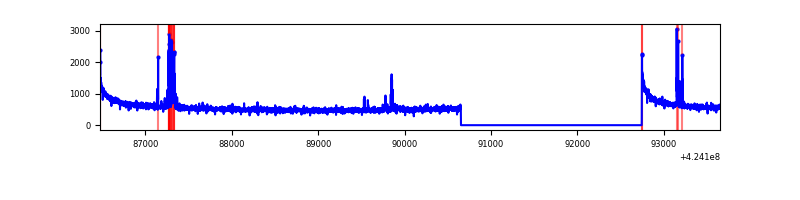 |
| B | 7174 | 5082 | 1 | 1 | 0.01% | 0.02% | 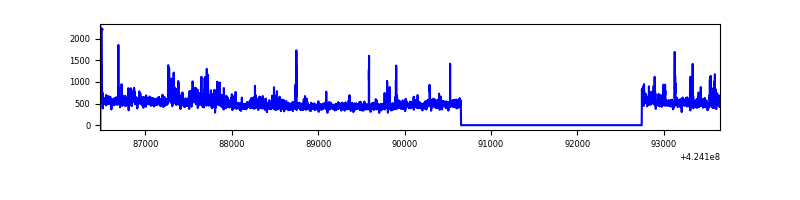 |
| C | 7174 | 5082 | 211 | 211 | 2.94% | 4.15% | 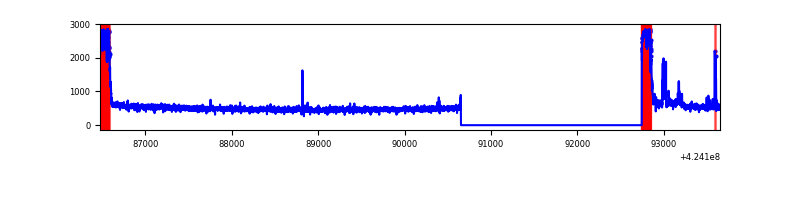 |
| D | 7175 | 5083 | 146 | 146 | 2.03% | 2.87% | 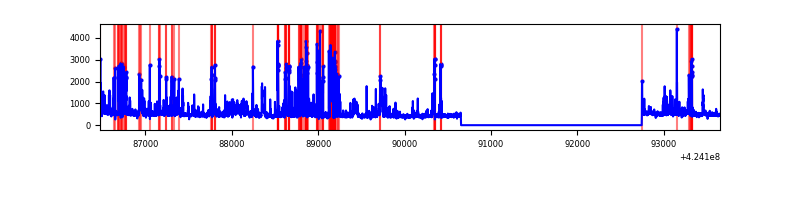 |
Top three noisy pixels from each quadrant. If the there are fewer than three noisy pixels in the level2.evt file, extra rows are filled as -1
| Pixel properties | Quadrant properties | ||||||
|---|---|---|---|---|---|---|---|
| Quadrant | DetID | PixID | Counts | Sigma | Mean | Median | Sigma |
| A | 10 | 83 | 539719 | 4484.64 | 592 | 582 | 120.2 |
| A | 13 | 248 | 95039 | 785.71 | 592 | 582 | 120.2 |
| A | 2 | 79 | 21333 | 172.61 | 592 | 582 | 120.2 |
| B | 0 | 190 | 113042 | 1015.52 | 586 | 570 | 110.8 |
| B | 7 | 202 | 75161 | 673.49 | 586 | 570 | 110.8 |
| B | 0 | 186 | 74851 | 670.69 | 586 | 570 | 110.8 |
| C | 0 | 10 | 593417 | 4595.1 | 565 | 569 | 129.0 |
| C | 15 | 214 | 202356 | 1564.03 | 565 | 569 | 129.0 |
| C | 14 | 254 | 77521 | 596.45 | 565 | 569 | 129.0 |
| D | 13 | 249 | 762161 | 5468.0 | 578 | 563 | 139.3 |
| D | 1 | 47 | 53902 | 382.95 | 578 | 563 | 139.3 |
| D | 12 | 217 | 35230 | 248.9 | 578 | 563 | 139.3 |
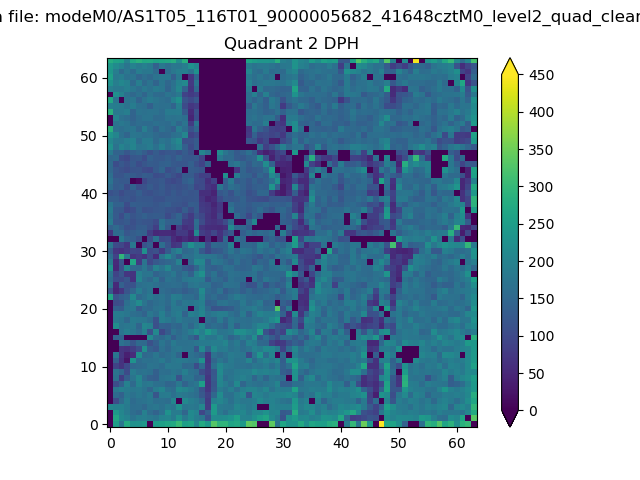
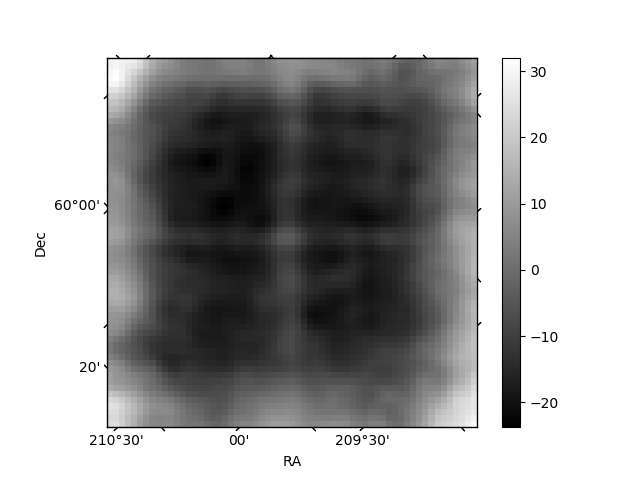
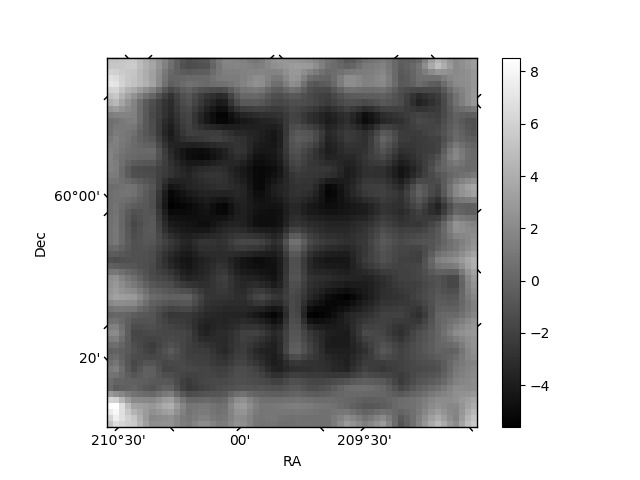
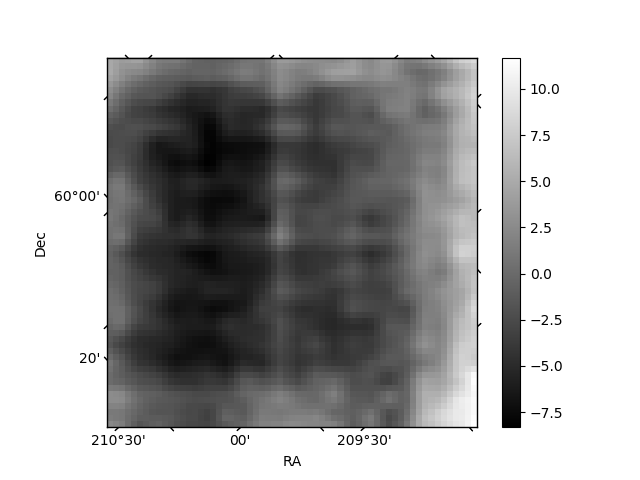
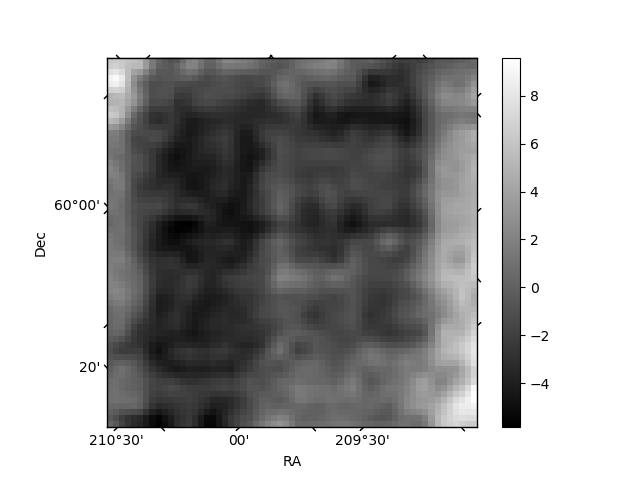
Histogram calculated using DETX and DETY for each event in the final _common_clean file
| Quadrant A | 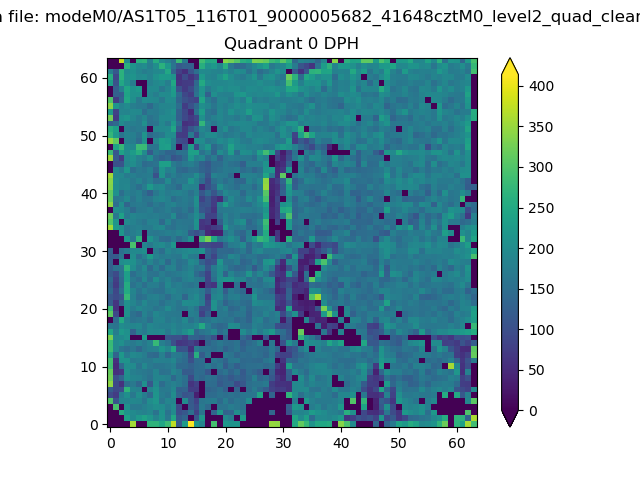 |
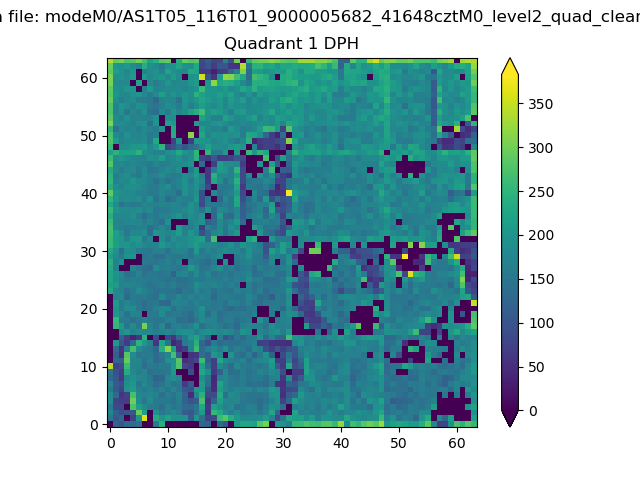 |
Quadrant B |
|---|---|---|---|
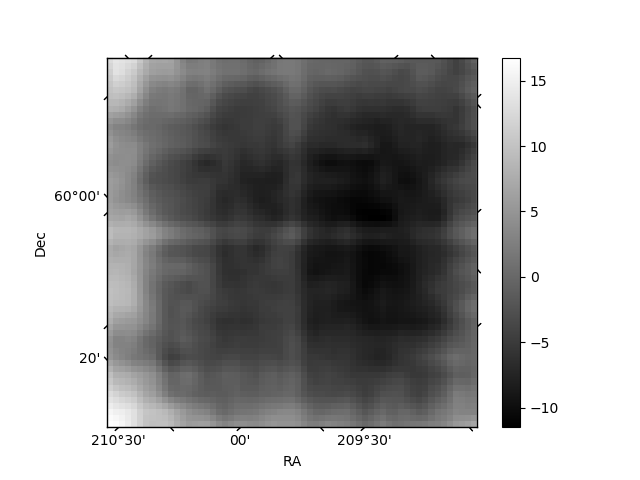
| Quadrant D | 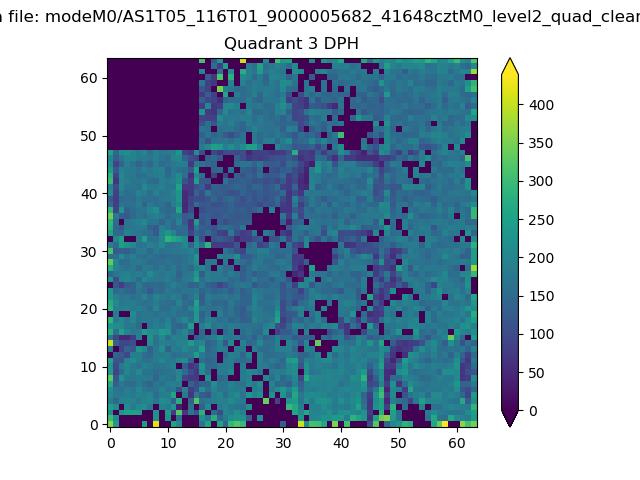 |
 |
Quadrant C |
| Plot type | Count rate plots | Images |
|---|---|---|
| Comparison with Poisson distribution Blue bars denote a histogram of data divided into 1 sec bins. Red curve is a Poisson curve with rate = median count rate of data. |
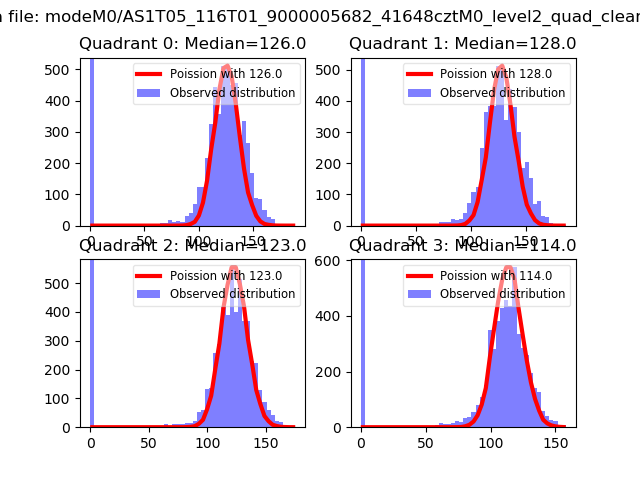 |
 |
| Quadrant-wise count rates Data is divided into 100 sec bins |
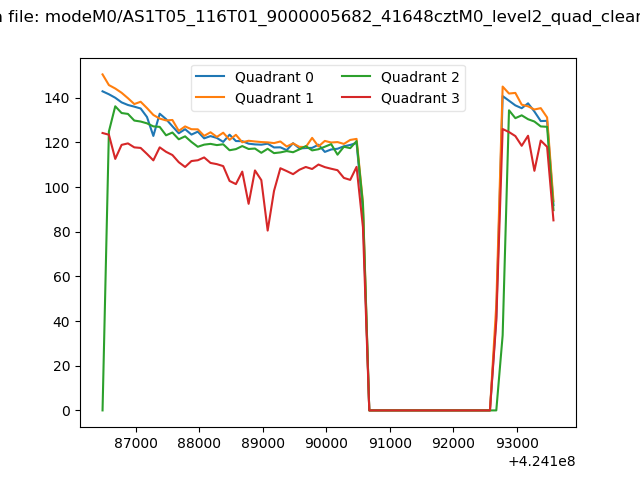 |
|
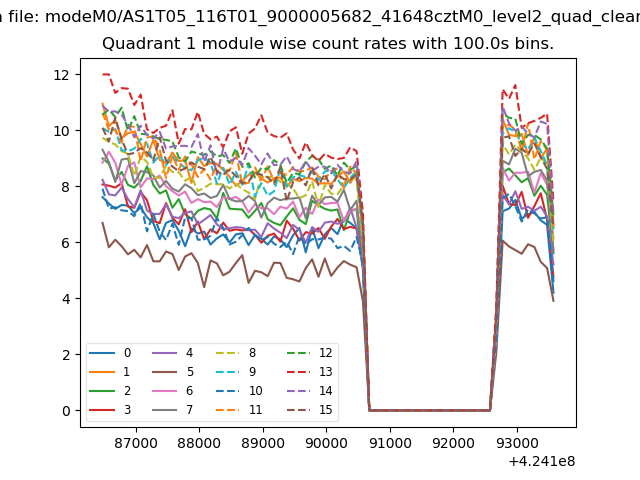
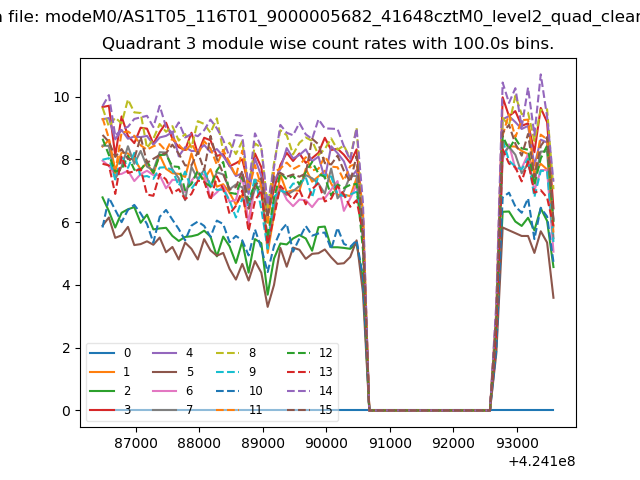
| Module-wise count rates for Quadrant A Data is divided into 100 sec bins |
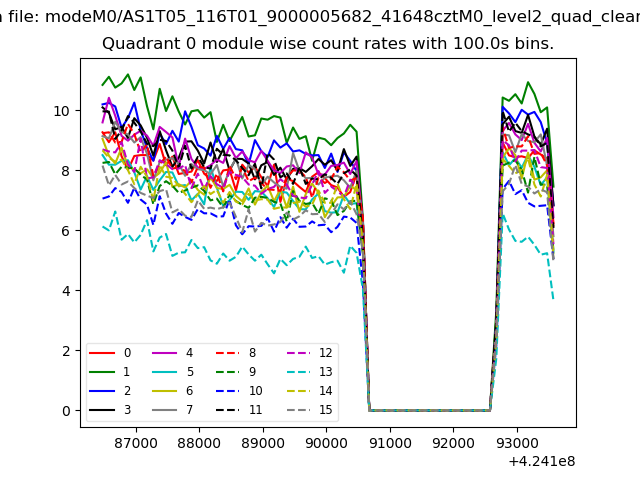 |
 |
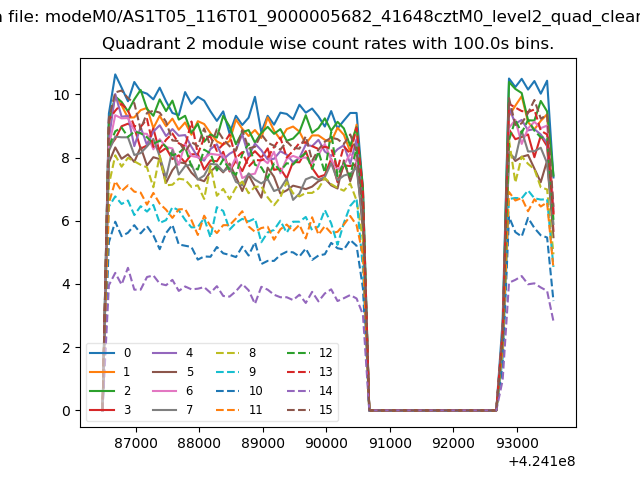
| Module-wise count rates for Quadrant B Data is divided into 100 sec bins |
 |
 |
| Module-wise count rates for Quadrant C Data is divided into 100 sec bins |
 |
 |
| Module-wise count rates for Quadrant D Data is divided into 100 sec bins |
 |
 |
| Parameter | Plot |
|---|---|
| CZT HV Monitor | 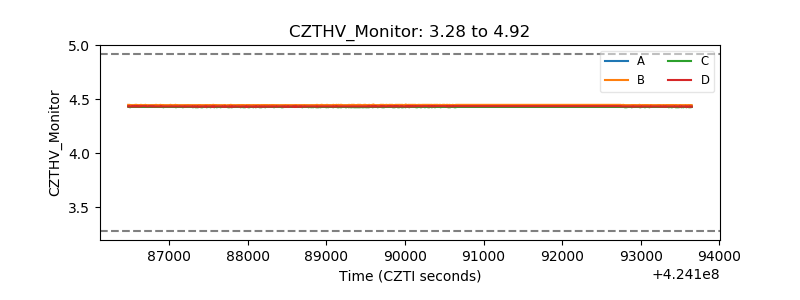 |
| D_VDD | 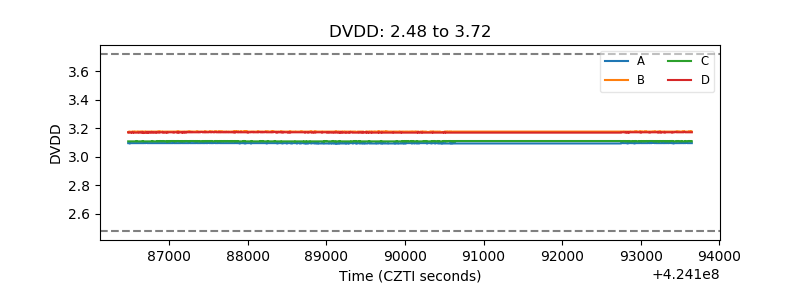 |
| Temperature 1 | 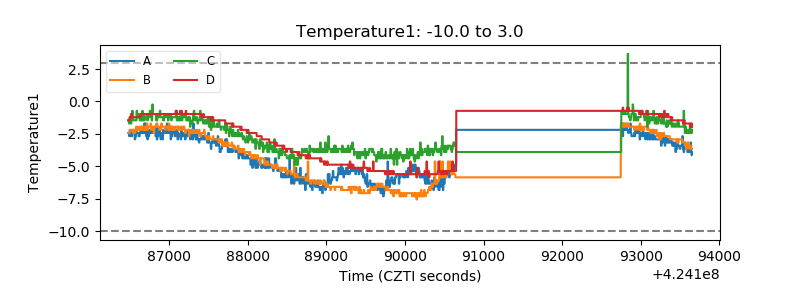 |
| Veto HV Monitor | 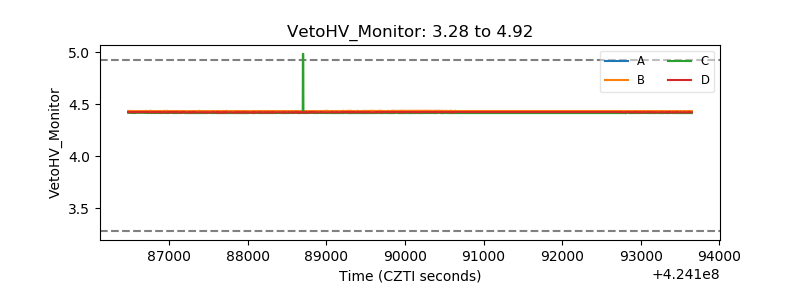 |
| Veto LLD | 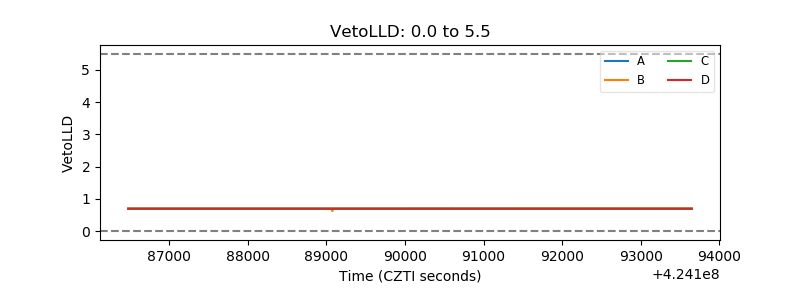 |
| Alpha Counter | 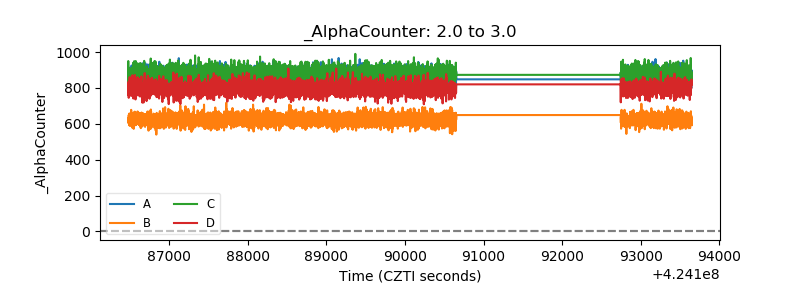 |
| _CPM_Rate | 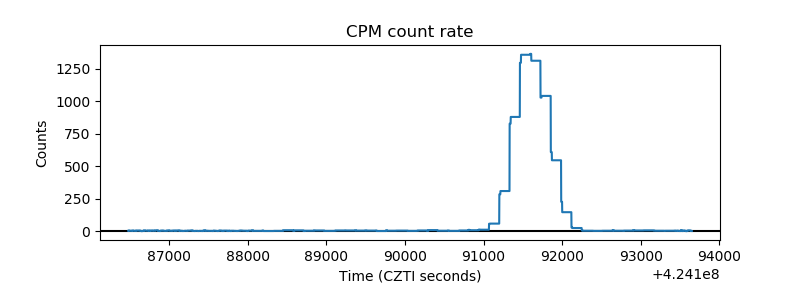 |
| CZT Counter | 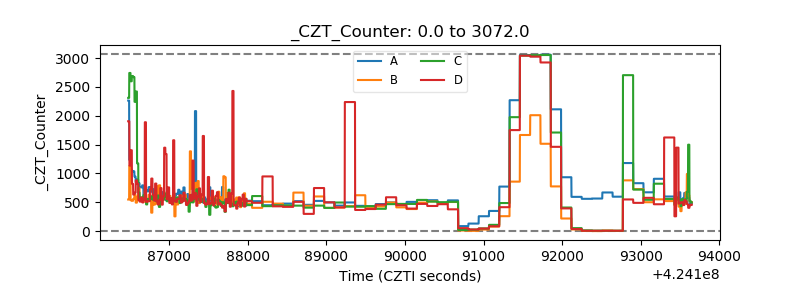 |
| +2.5 Volts monitor | 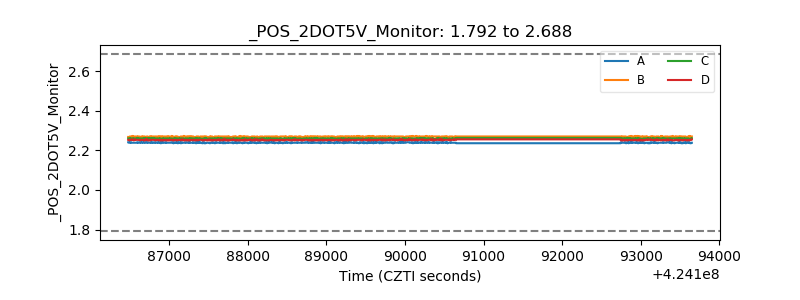 |
| +5 Volts monitor | 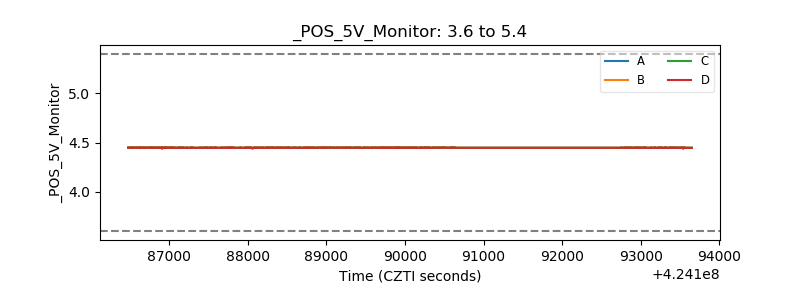 |
| _ROLL_ROT | 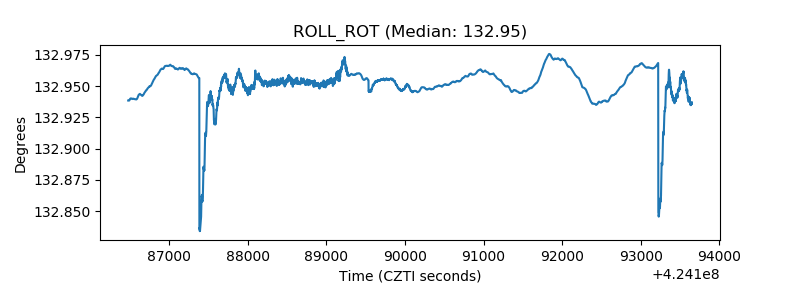 |
| _Roll_DEC | 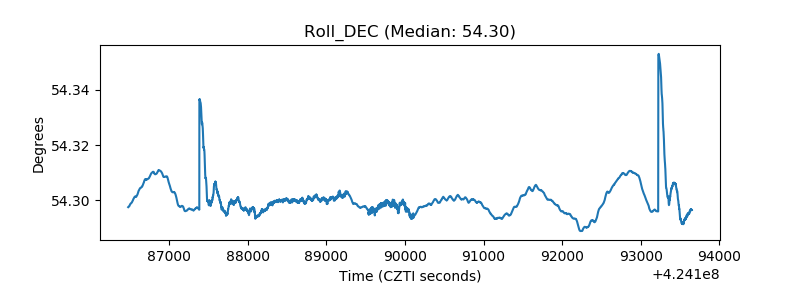 |
| _Roll_RA | 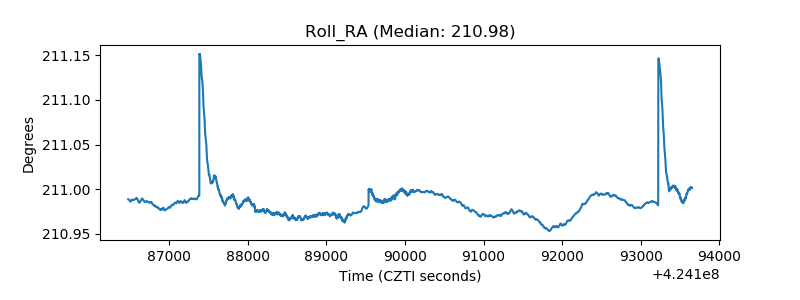 |
| Veto Counter | 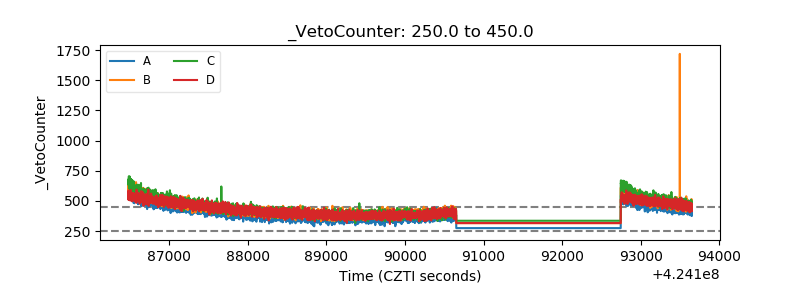 |