| Param | Original file | Final file |
|---|---|---|
| Filename | modeM0/AS1T05_116T01_9000005682_41650cztM0_level2.fits | modeM0/AS1T05_116T01_9000005682_41650cztM0_level2_quad_clean.evt |
| Size (bytes) | 301,648,320 | 84,954,240 |
| Size | 287.7 MB | 81.0 MB |
| Events in quadrant A | 2,632,664 | 576,822 |
| Events in quadrant B | 2,279,875 | 587,194 |
| Events in quadrant C | 2,980,259 | 541,372 |
| Events in quadrant D | 2,889,497 | 522,085 |
| Mode M0 | |||
|---|---|---|---|
| Quadrant | BADHDUFLAG | Total packets | Discarded packets |
| A | 0 | 10883 | 2 |
| B | 0 | 10224 | 2 |
| C | 0 | 12001 | 2 |
| D | 0 | 12061 | 6 |
| Mode M9 | |||
|---|---|---|---|
| Quadrant | BADHDUFLAG | Total packets | Discarded packets |
| A | 0 | 31 | 0 |
| B | 0 | 32 | 0 |
| C | 0 | 32 | 0 |
| D | 0 | 32 | 0 |
| Mode SS | |||
|---|---|---|---|
| Quadrant | BADHDUFLAG | Total packets | Discarded packets |
| A | 0 | 100 | 0 |
| B | 0 | 100 | 0 |
| C | 0 | 100 | 0 |
| D | 0 | 100 | 0 |
| Quadrant | Total seconds | Saturated seconds | Saturation percentage |
|---|---|---|---|
| A | 4920 | 14 | 0.284553% |
| B | 4920 | 24 | 0.487805% |
| C | 4920 | 276 | 5.609756% |
| D | 4919 | 103 | 2.093922% |
Noise dominated data is calculated using 1-second bins in cleaned event files. If a bin has >2000 counts, and if more than 50% of those come from <1% of pixels, then it is considered to be noise-dominated and hence unusable.
| Quadrant | # 1 sec bins | Bins with >0 counts | Bins with >2000 counts | High rate bins dominated by noise | Noise dominated (total time) | Noise dominated (detector-on time) | Marked lightcurve |
|---|---|---|---|---|---|---|---|
| A | 7043 | 4921 | 3 | 3 | 0.04% | 0.06% | 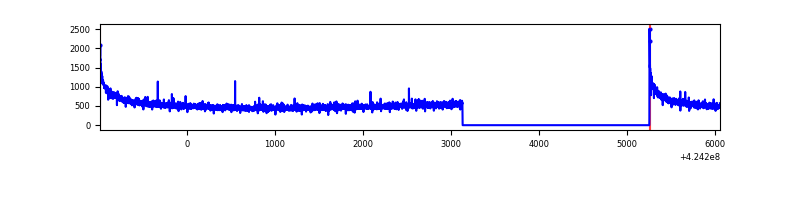 |
| B | 7043 | 4921 | 10 | 10 | 0.14% | 0.20% | 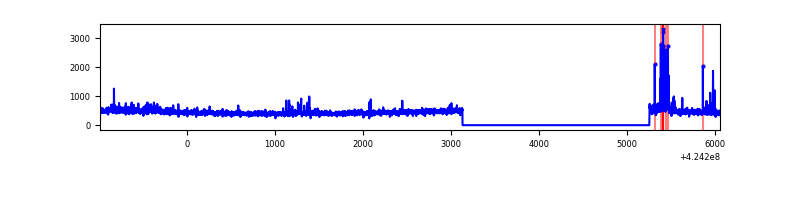 |
| C | 7043 | 4921 | 264 | 264 | 3.75% | 5.36% | 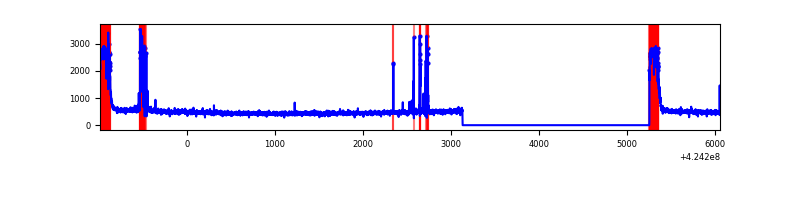 |
| D | 7042 | 4920 | 95 | 95 | 1.35% | 1.93% | 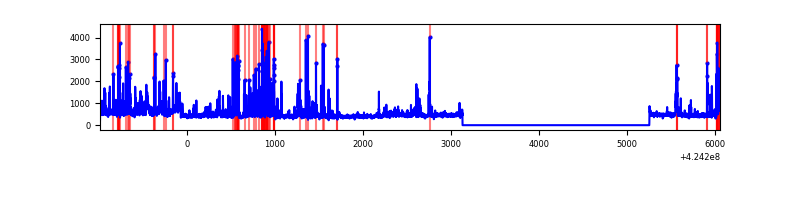 |
Top three noisy pixels from each quadrant. If the there are fewer than three noisy pixels in the level2.evt file, extra rows are filled as -1
| Pixel properties | Quadrant properties | ||||||
|---|---|---|---|---|---|---|---|
| Quadrant | DetID | PixID | Counts | Sigma | Mean | Median | Sigma |
| A | 10 | 83 | 520859 | 4715.86 | 540 | 530 | 110.3 |
| A | 2 | 79 | 12846 | 111.62 | 540 | 530 | 110.3 |
| A | 13 | 254 | 7194 | 60.4 | 540 | 530 | 110.3 |
| B | 4 | 81 | 70329 | 677.17 | 538 | 524 | 103.1 |
| B | 0 | 190 | 51848 | 497.89 | 538 | 524 | 103.1 |
| B | 5 | 255 | 39322 | 376.38 | 538 | 524 | 103.1 |
| C | 0 | 10 | 578060 | 4831.8 | 515 | 519 | 119.5 |
| C | 14 | 254 | 197474 | 1647.76 | 515 | 519 | 119.5 |
| C | 15 | 214 | 193754 | 1616.64 | 515 | 519 | 119.5 |
| D | 13 | 249 | 448215 | 3412.56 | 530 | 516 | 131.2 |
| D | 5 | 222 | 188312 | 1431.46 | 530 | 516 | 131.2 |
| D | 10 | 34 | 54994 | 415.25 | 530 | 516 | 131.2 |
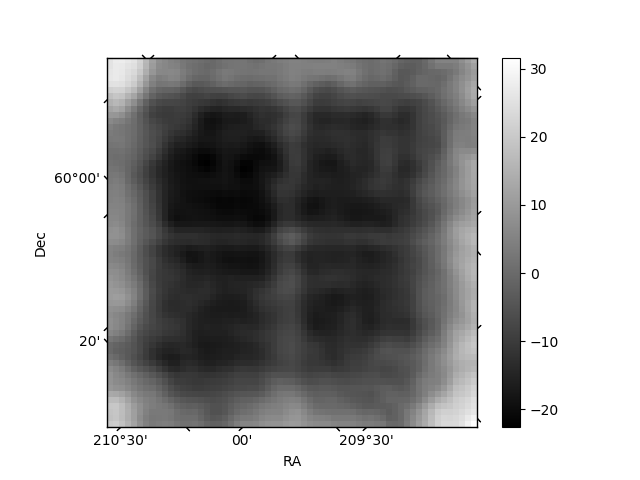
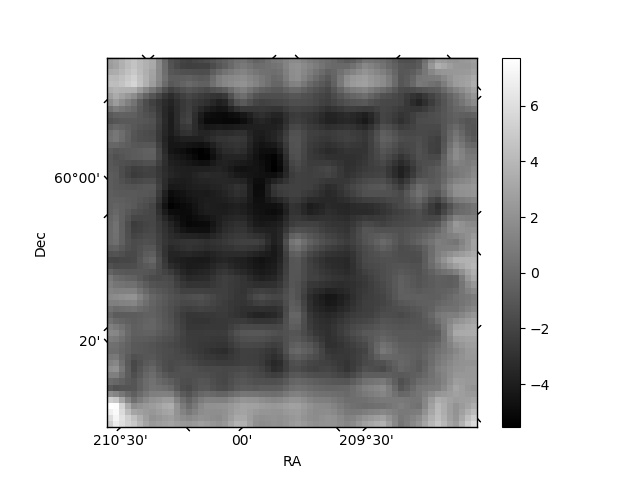
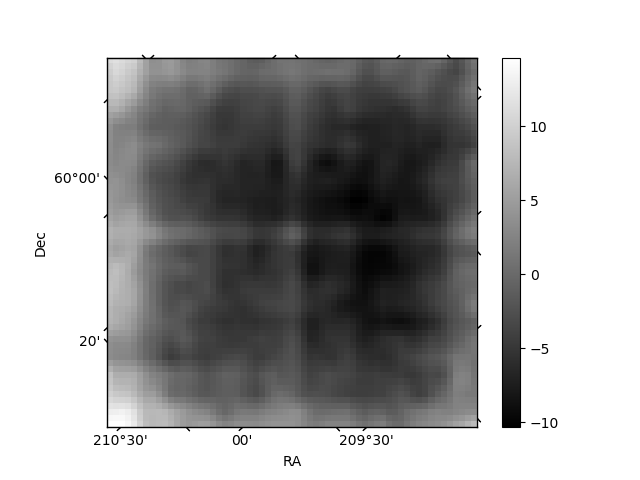
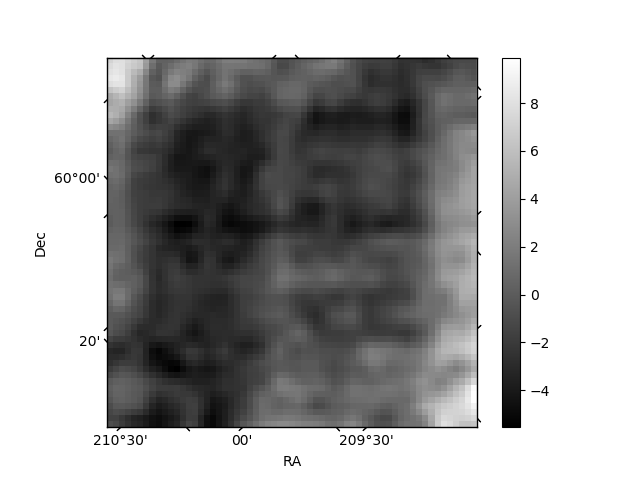
Histogram calculated using DETX and DETY for each event in the final _common_clean file
| Quadrant A | 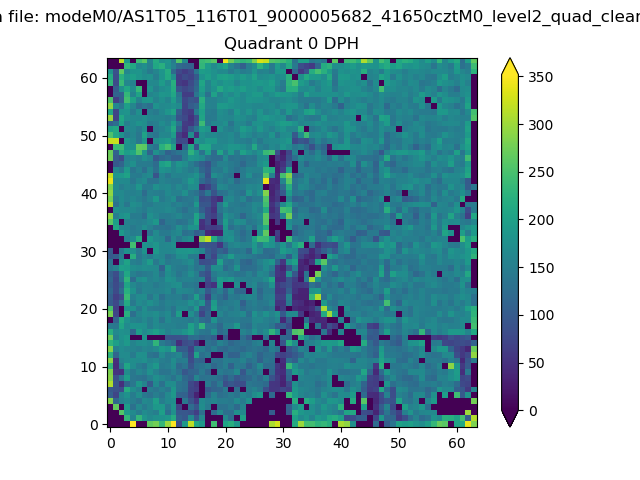 |
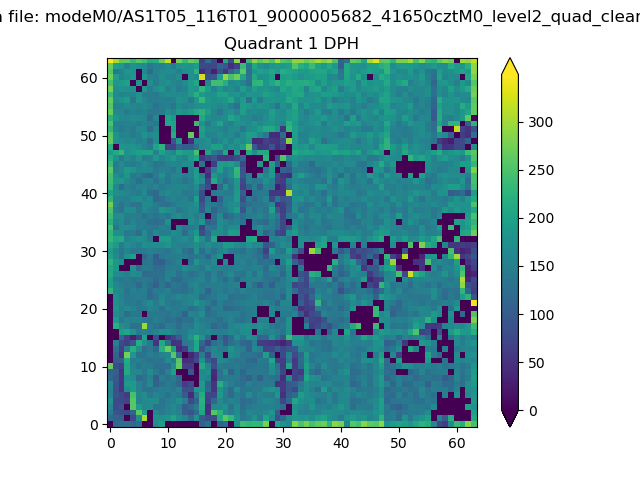 |
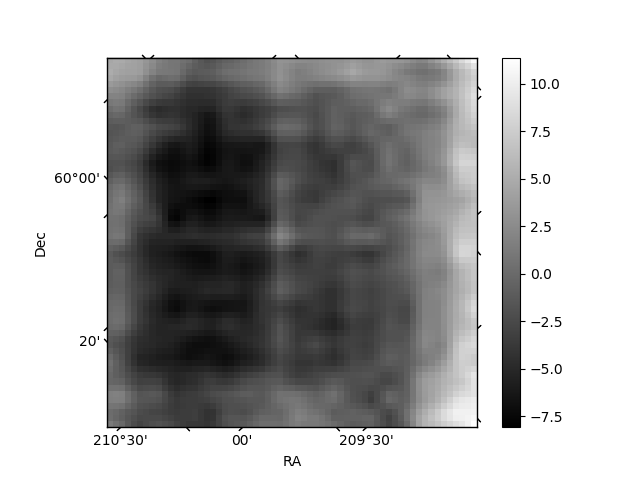
Quadrant B |
|---|---|---|---|
| Quadrant D | 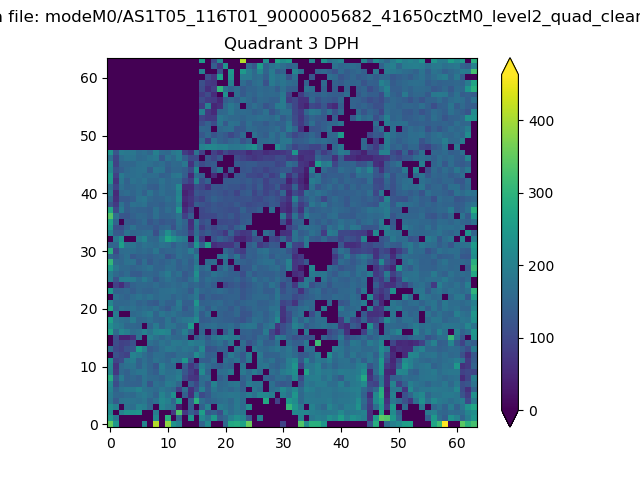 |
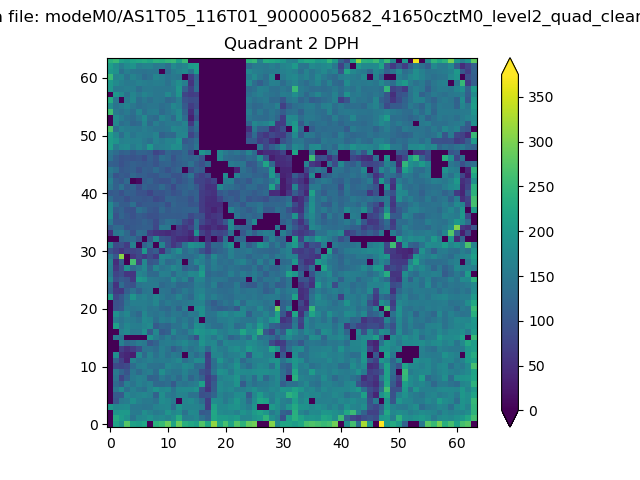 |
Quadrant C |
| Plot type | Count rate plots | Images |
|---|---|---|
| Comparison with Poisson distribution Blue bars denote a histogram of data divided into 1 sec bins. Red curve is a Poisson curve with rate = median count rate of data. |
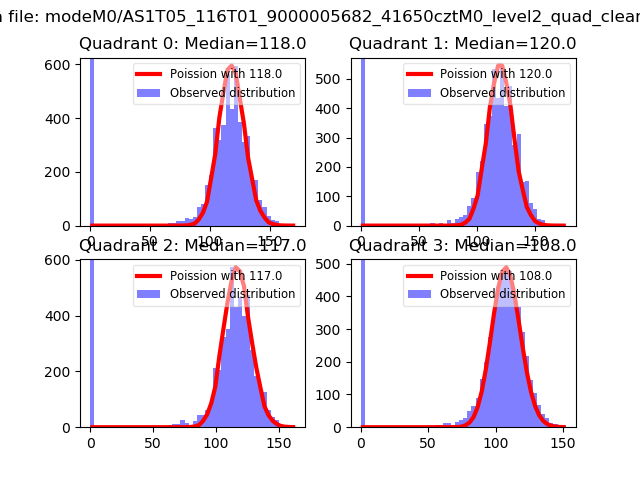 |
 |
| Quadrant-wise count rates Data is divided into 100 sec bins |
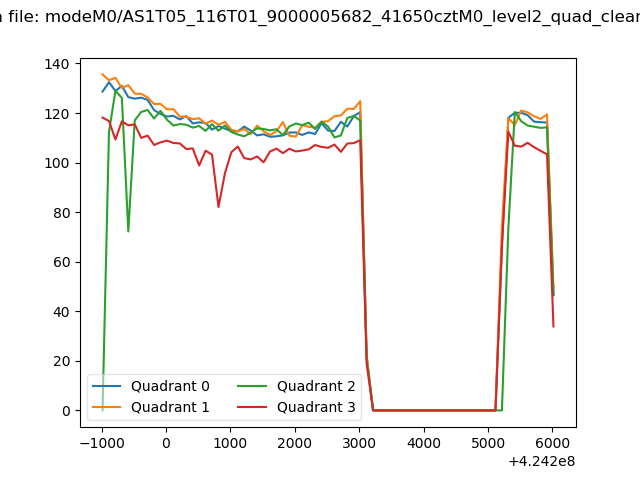 |
|
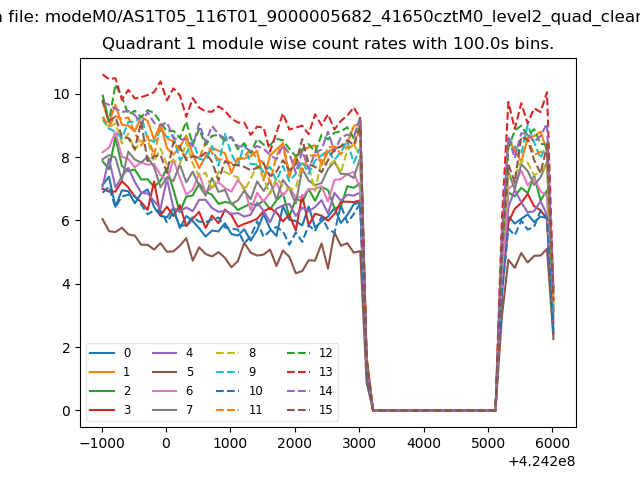
| Module-wise count rates for Quadrant A Data is divided into 100 sec bins |
 |
 |
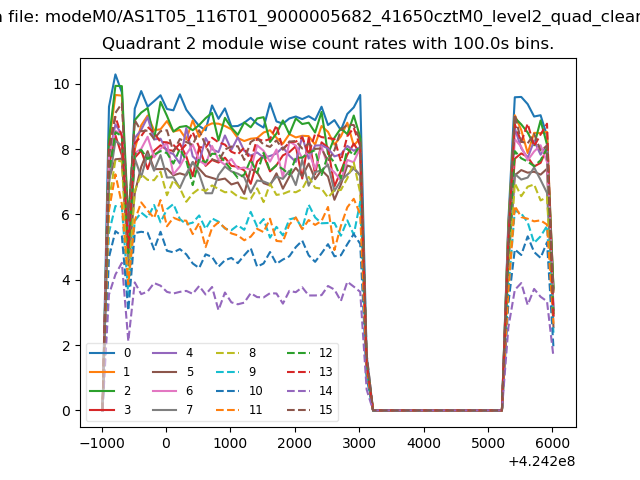
| Module-wise count rates for Quadrant B Data is divided into 100 sec bins |
 |
 |
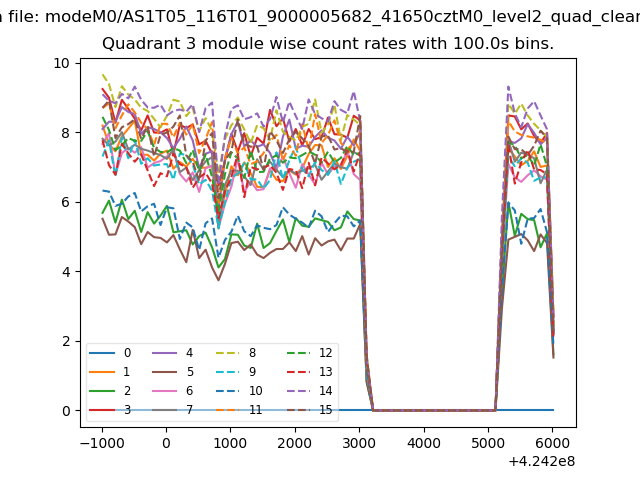
| Module-wise count rates for Quadrant C Data is divided into 100 sec bins |
 |
 |
| Module-wise count rates for Quadrant D Data is divided into 100 sec bins |
 |
 |
| Parameter | Plot |
|---|---|
| CZT HV Monitor | 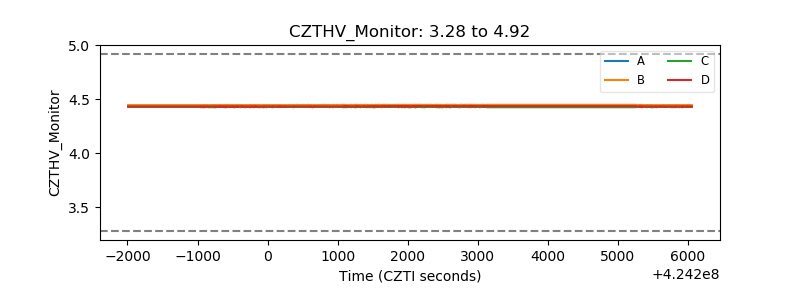 |
| D_VDD | 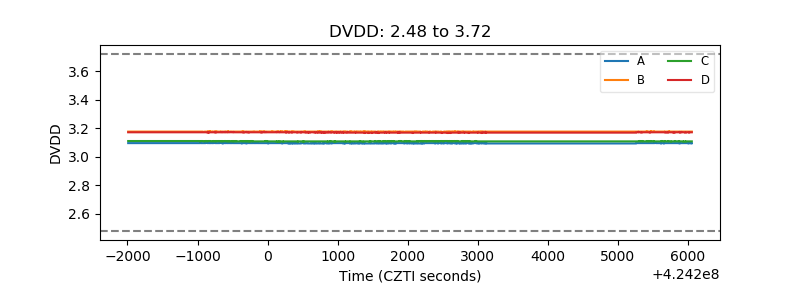 |
| Temperature 1 |  |
| Veto HV Monitor | 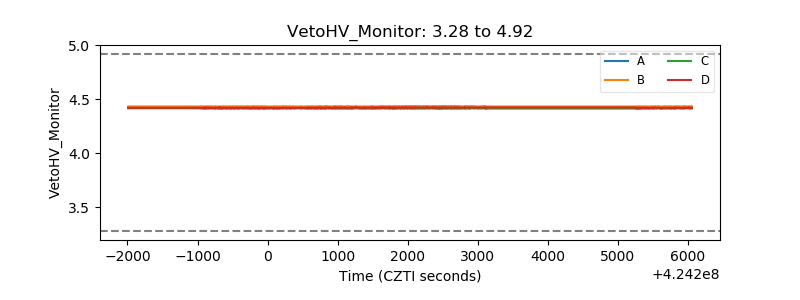 |
| Veto LLD | 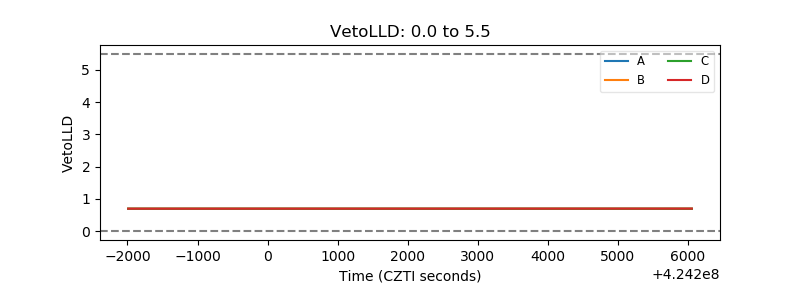 |
| Alpha Counter | 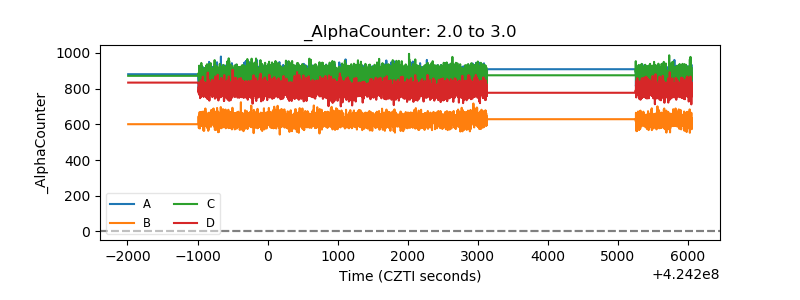 |
| _CPM_Rate | 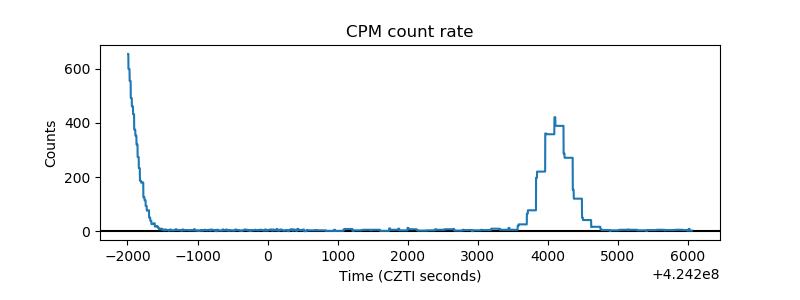 |
| CZT Counter | 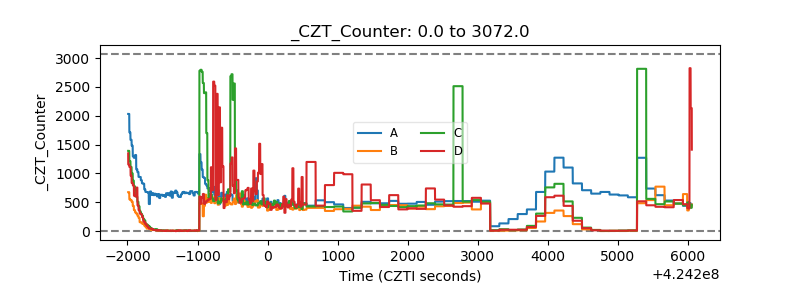 |
| +2.5 Volts monitor | 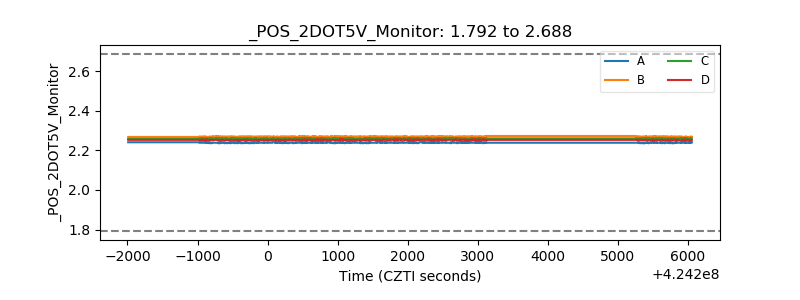 |
| +5 Volts monitor | 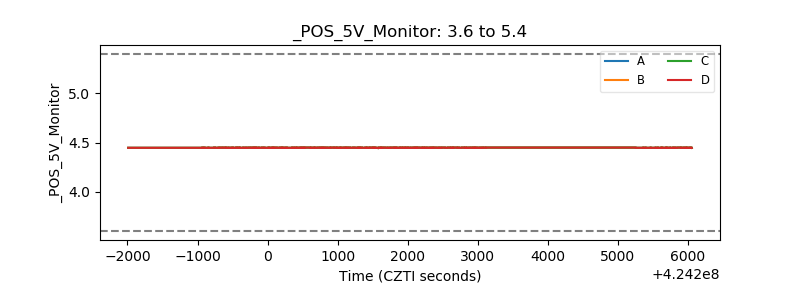 |
| _ROLL_ROT |  |
| _Roll_DEC | 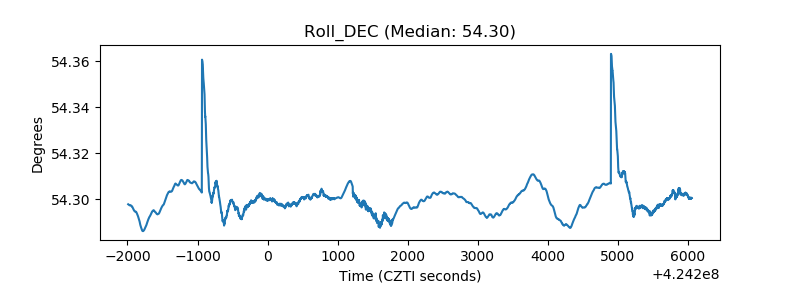 |
| _Roll_RA | 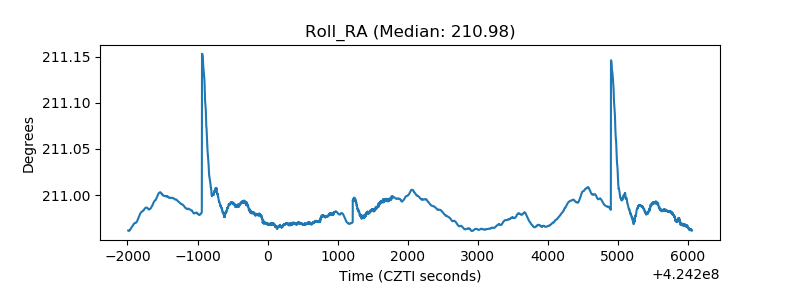 |
| Veto Counter | 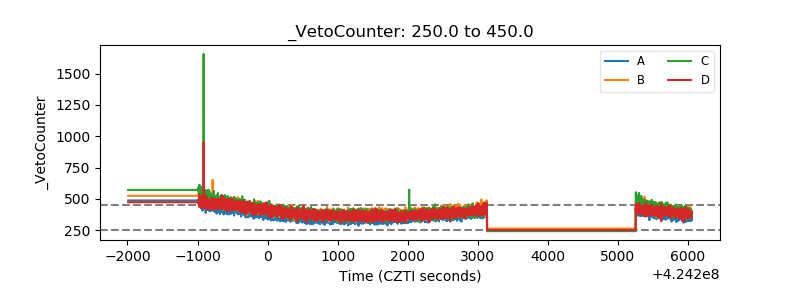 |