| Param | Original file | Final file |
|---|---|---|
| Filename | modeM0/AS1T05_116T01_9000005682_41651cztM0_level2.fits | modeM0/AS1T05_116T01_9000005682_41651cztM0_level2_quad_clean.evt |
| Size (bytes) | 306,178,560 | 83,658,240 |
| Size | 292.0 MB | 79.8 MB |
| Events in quadrant A | 2,633,372 | 562,931 |
| Events in quadrant B | 2,337,150 | 575,104 |
| Events in quadrant C | 2,799,114 | 539,711 |
| Events in quadrant D | 3,169,143 | 500,740 |
| Mode M0 | |||
|---|---|---|---|
| Quadrant | BADHDUFLAG | Total packets | Discarded packets |
| A | 0 | 10998 | 2 |
| B | 0 | 10615 | 2 |
| C | 0 | 11622 | 2 |
| D | 0 | 13062 | 2 |
| Mode M9 | |||
|---|---|---|---|
| Quadrant | BADHDUFLAG | Total packets | Discarded packets |
| A | 0 | 28 | 0 |
| B | 0 | 28 | 0 |
| C | 0 | 29 | 0 |
| D | 0 | 29 | 0 |
| Mode SS | |||
|---|---|---|---|
| Quadrant | BADHDUFLAG | Total packets | Discarded packets |
| A | 0 | 102 | 0 |
| B | 0 | 102 | 0 |
| C | 0 | 102 | 0 |
| D | 0 | 102 | 0 |
| Quadrant | Total seconds | Saturated seconds | Saturation percentage |
|---|---|---|---|
| A | 5064 | 13 | 0.256714% |
| B | 5064 | 34 | 0.671406% |
| C | 5063 | 201 | 3.969978% |
| D | 5063 | 232 | 4.582263% |
Noise dominated data is calculated using 1-second bins in cleaned event files. If a bin has >2000 counts, and if more than 50% of those come from <1% of pixels, then it is considered to be noise-dominated and hence unusable.
| Quadrant | # 1 sec bins | Bins with >0 counts | Bins with >2000 counts | High rate bins dominated by noise | Noise dominated (total time) | Noise dominated (detector-on time) | Marked lightcurve |
|---|---|---|---|---|---|---|---|
| A | 7037 | 5065 | 4 | 4 | 0.06% | 0.08% | 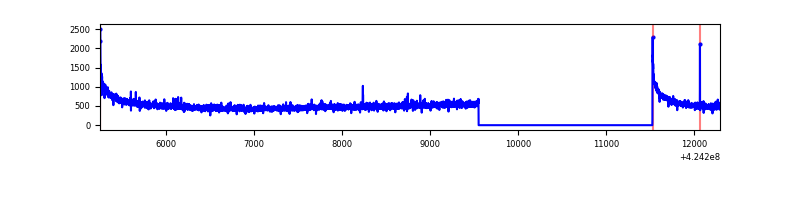 |
| B | 7037 | 5065 | 14 | 14 | 0.20% | 0.28% | 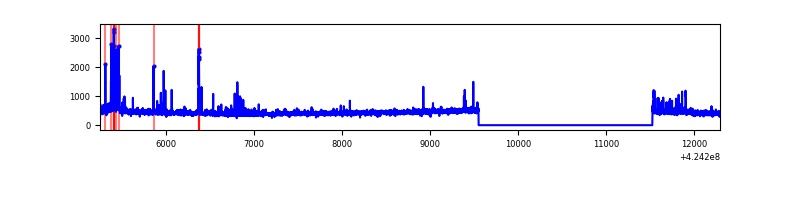 |
| C | 7036 | 5064 | 199 | 199 | 2.83% | 3.93% | 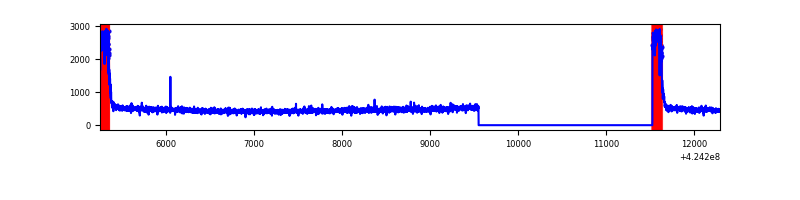 |
| D | 7036 | 5064 | 221 | 221 | 3.14% | 4.36% | 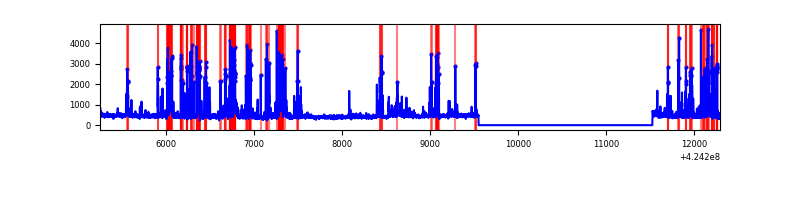 |
Top three noisy pixels from each quadrant. If the there are fewer than three noisy pixels in the level2.evt file, extra rows are filled as -1
| Pixel properties | Quadrant properties | ||||||
|---|---|---|---|---|---|---|---|
| Quadrant | DetID | PixID | Counts | Sigma | Mean | Median | Sigma |
| A | 10 | 83 | 510154 | 4606.94 | 539 | 528 | 110.6 |
| A | 3 | 1 | 14212 | 123.7 | 539 | 528 | 110.6 |
| A | 2 | 79 | 9812 | 83.93 | 539 | 528 | 110.6 |
| B | 4 | 81 | 73756 | 708.36 | 538 | 521 | 103.4 |
| B | 5 | 255 | 51063 | 488.86 | 538 | 521 | 103.4 |
| B | 7 | 202 | 50464 | 483.07 | 538 | 521 | 103.4 |
| C | 0 | 10 | 563730 | 4597.18 | 520 | 522 | 122.5 |
| C | 15 | 214 | 202521 | 1648.81 | 520 | 522 | 122.5 |
| C | 14 | 254 | 5695 | 42.22 | 520 | 522 | 122.5 |
| D | 13 | 249 | 729922 | 5735.91 | 520 | 506 | 127.2 |
| D | 1 | 47 | 122693 | 960.84 | 520 | 506 | 127.2 |
| D | 2 | 249 | 95800 | 749.36 | 520 | 506 | 127.2 |
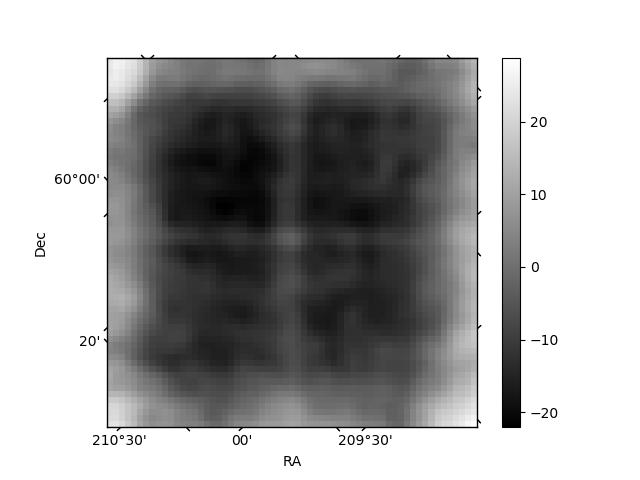
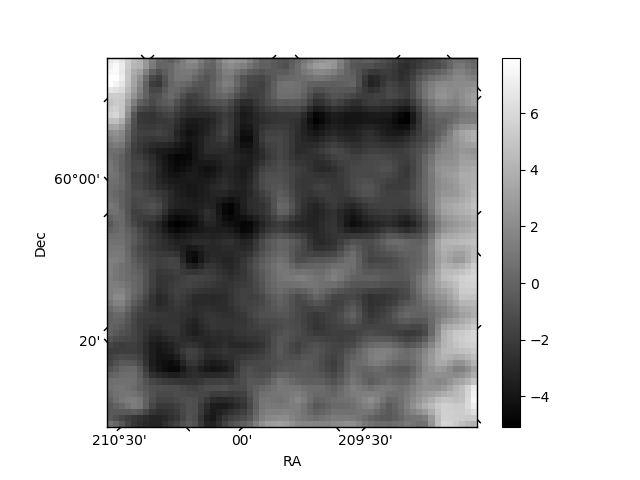
Histogram calculated using DETX and DETY for each event in the final _common_clean file
| Quadrant A | 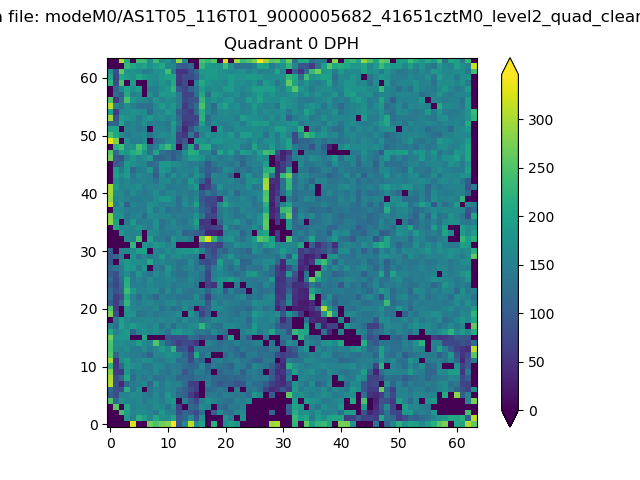 |
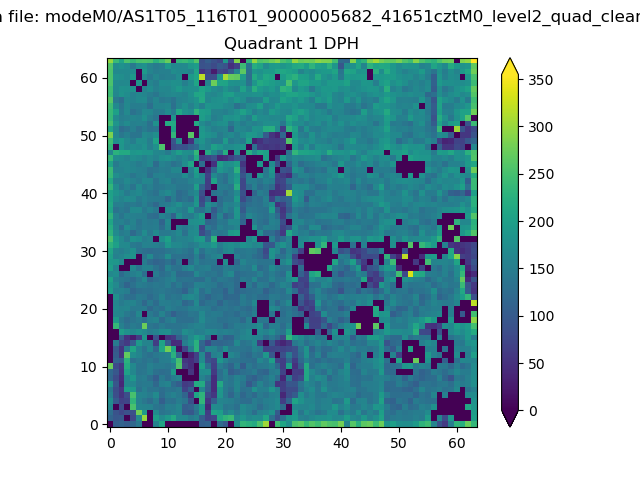 |
Quadrant B |
|---|---|---|---|
| Quadrant D | 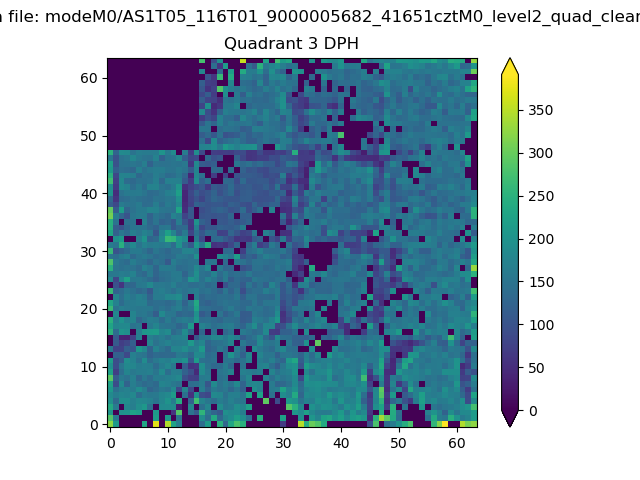 |
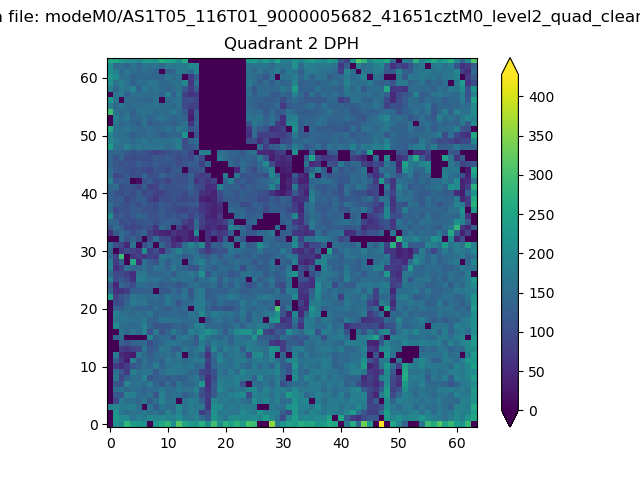 |
Quadrant C |
| Plot type | Count rate plots | Images |
|---|---|---|
| Comparison with Poisson distribution Blue bars denote a histogram of data divided into 1 sec bins. Red curve is a Poisson curve with rate = median count rate of data. |
 |
 |
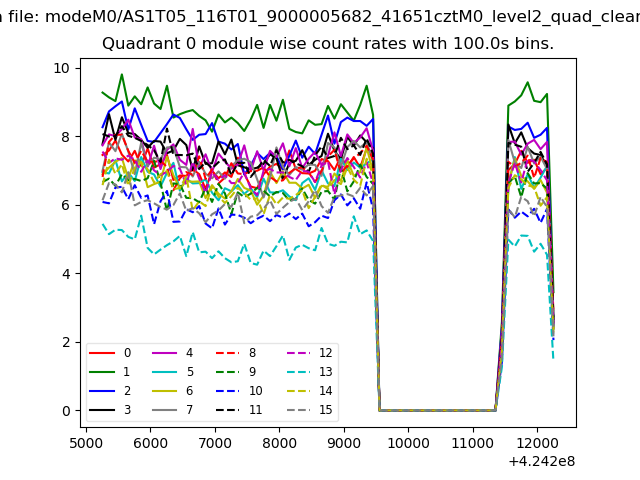
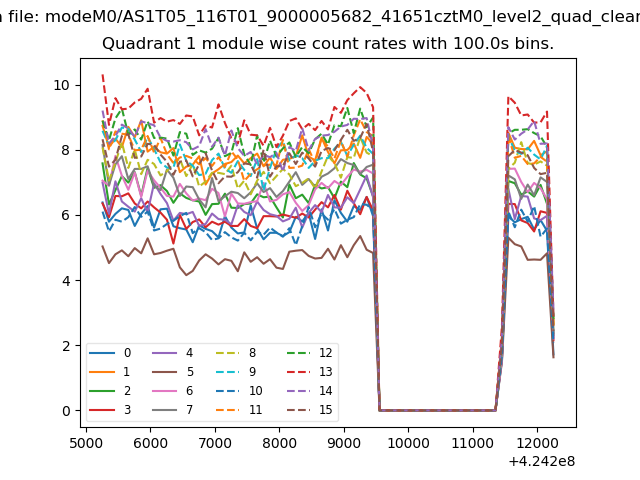
| Quadrant-wise count rates Data is divided into 100 sec bins |
 |
|
| Module-wise count rates for Quadrant A Data is divided into 100 sec bins |
 |
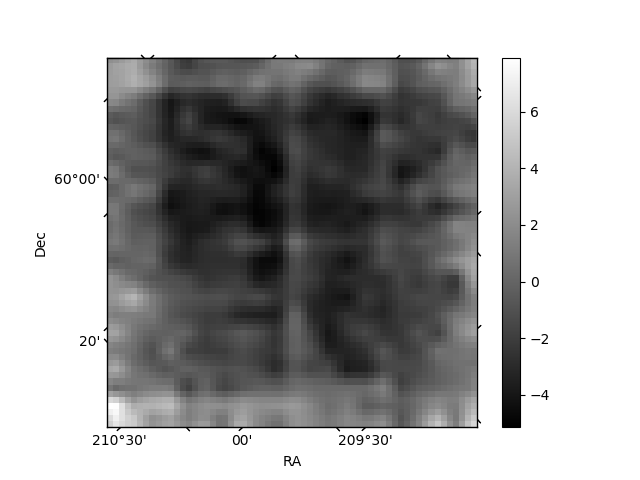 |
| Module-wise count rates for Quadrant B Data is divided into 100 sec bins |
 |
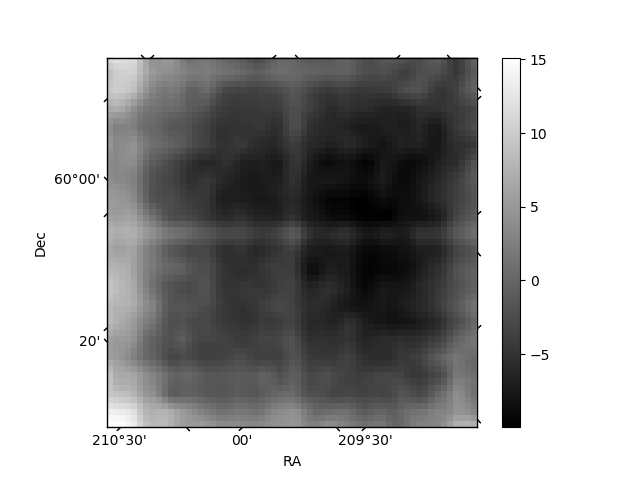 |
| Module-wise count rates for Quadrant C Data is divided into 100 sec bins |
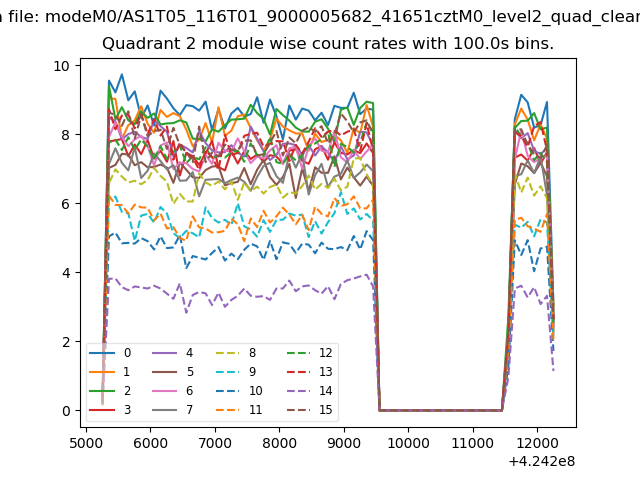 |
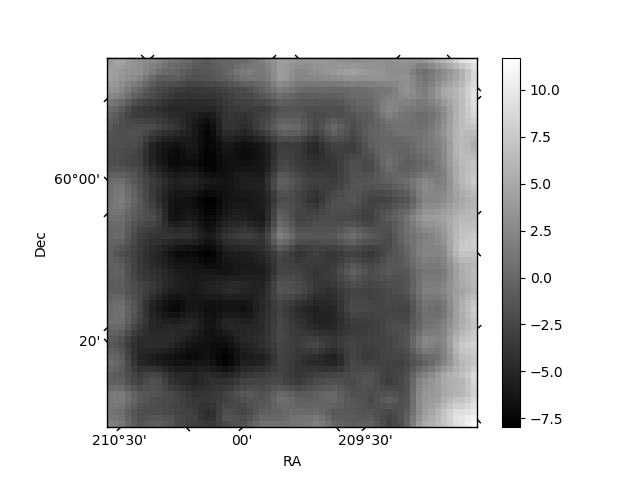 |
| Module-wise count rates for Quadrant D Data is divided into 100 sec bins |
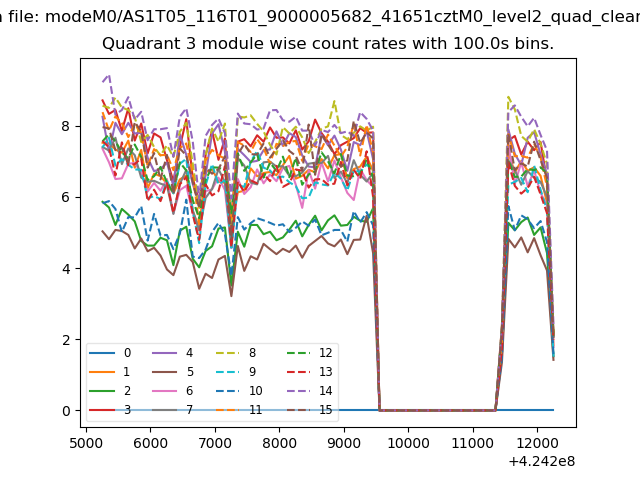 |
 |
| Parameter | Plot |
|---|---|
| CZT HV Monitor | 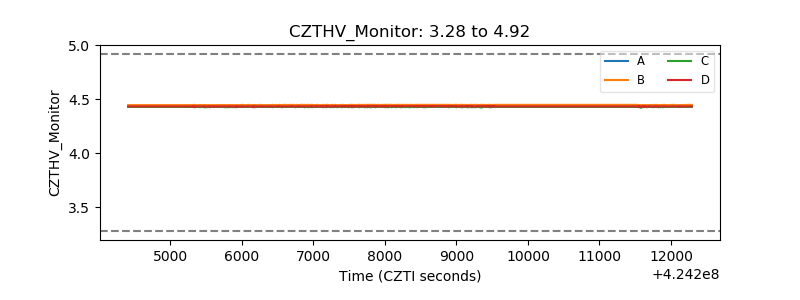 |
| D_VDD | 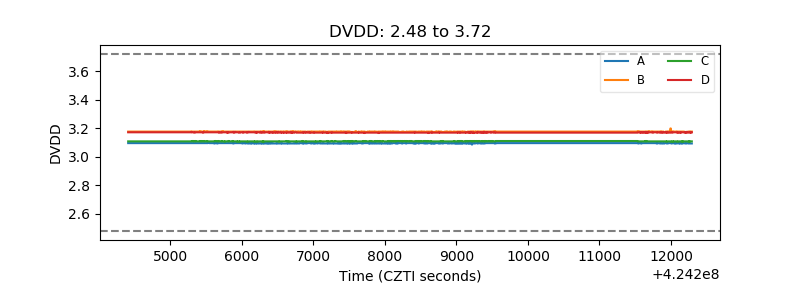 |
| Temperature 1 | 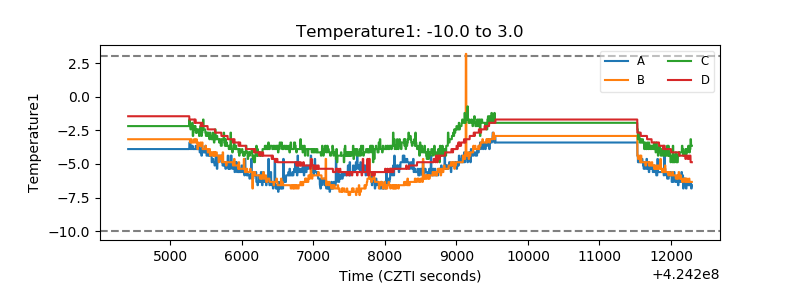 |
| Veto HV Monitor | 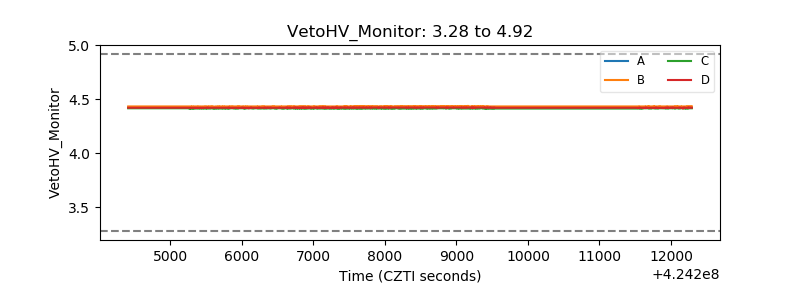 |
| Veto LLD | 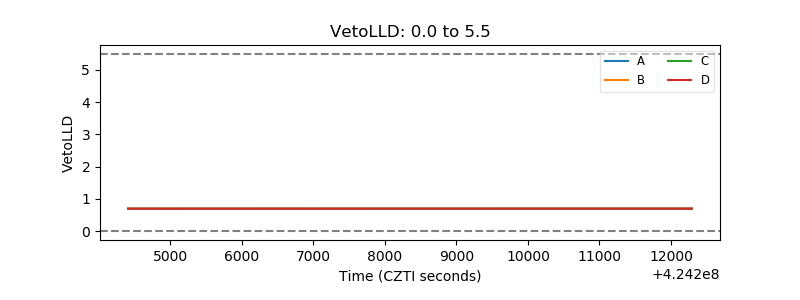 |
| Alpha Counter |  |
| _CPM_Rate | 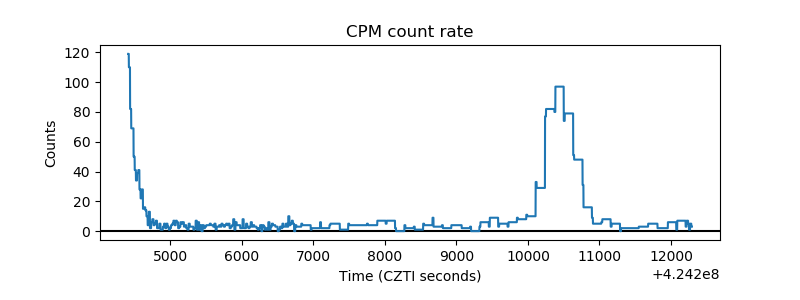 |
| CZT Counter | 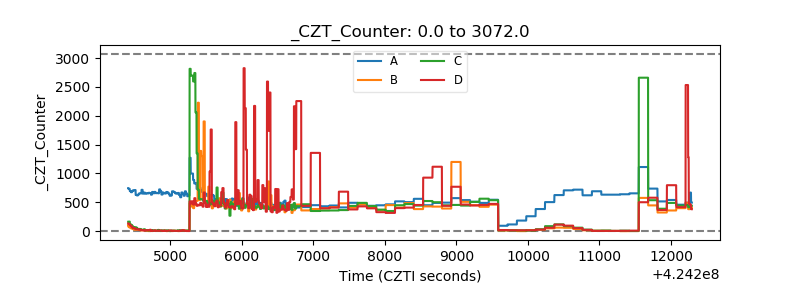 |
| +2.5 Volts monitor | 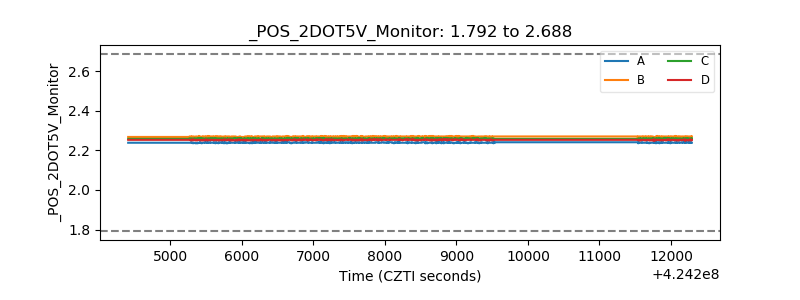 |
| +5 Volts monitor |  |
| _ROLL_ROT |  |
| _Roll_DEC | 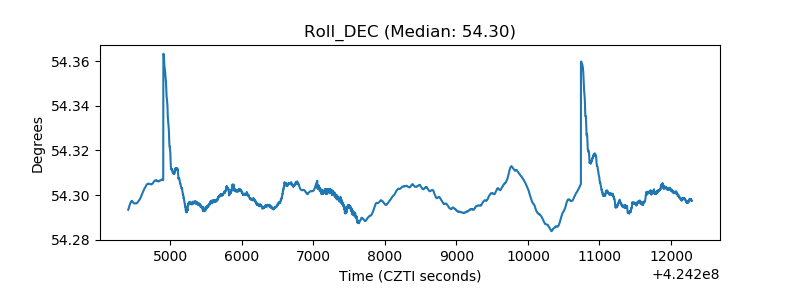 |
| _Roll_RA | 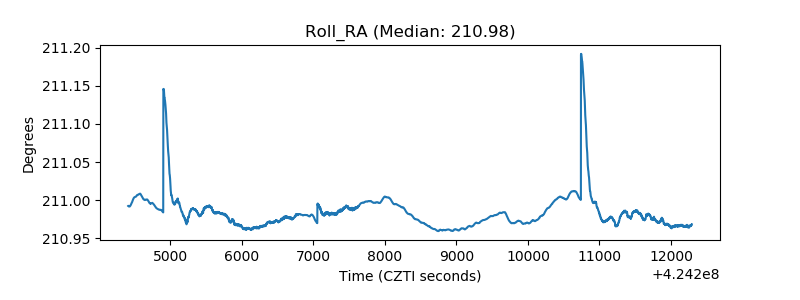 |
| Veto Counter | 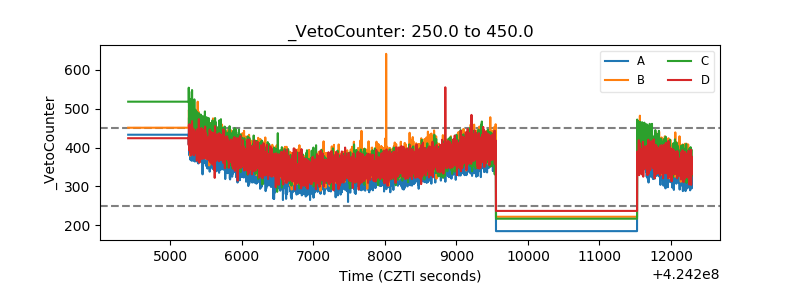 |