| Param | Original file | Final file |
|---|---|---|
| Filename | modeM0/AS1T05_116T01_9000005682_41652cztM0_level2.fits | modeM0/AS1T05_116T01_9000005682_41652cztM0_level2_quad_clean.evt |
| Size (bytes) | 317,842,560 | 86,912,640 |
| Size | 303.1 MB | 82.9 MB |
| Events in quadrant A | 2,758,578 | 582,554 |
| Events in quadrant B | 2,358,227 | 598,804 |
| Events in quadrant C | 3,011,494 | 556,048 |
| Events in quadrant D | 3,217,296 | 517,173 |
| Mode M0 | |||
|---|---|---|---|
| Quadrant | BADHDUFLAG | Total packets | Discarded packets |
| A | 0 | 11580 | 2 |
| B | 0 | 11001 | 2 |
| C | 0 | 12457 | 2 |
| D | 0 | 13602 | 2 |
| Mode M9 | |||
|---|---|---|---|
| Quadrant | BADHDUFLAG | Total packets | Discarded packets |
| A | 0 | 24 | 0 |
| B | 0 | 25 | 0 |
| C | 0 | 25 | 0 |
| D | 0 | 25 | 0 |
| Mode SS | |||
|---|---|---|---|
| Quadrant | BADHDUFLAG | Total packets | Discarded packets |
| A | 0 | 110 | 0 |
| B | 0 | 110 | 0 |
| C | 0 | 110 | 0 |
| D | 0 | 110 | 0 |
| Quadrant | Total seconds | Saturated seconds | Saturation percentage |
|---|---|---|---|
| A | 5383 | 10 | 0.185770% |
| B | 5383 | 14 | 0.260078% |
| C | 5383 | 222 | 4.124094% |
| D | 5383 | 220 | 4.086940% |
Noise dominated data is calculated using 1-second bins in cleaned event files. If a bin has >2000 counts, and if more than 50% of those come from <1% of pixels, then it is considered to be noise-dominated and hence unusable.
| Quadrant | # 1 sec bins | Bins with >0 counts | Bins with >2000 counts | High rate bins dominated by noise | Noise dominated (total time) | Noise dominated (detector-on time) | Marked lightcurve |
|---|---|---|---|---|---|---|---|
| A | 7026 | 5384 | 4 | 4 | 0.06% | 0.07% | 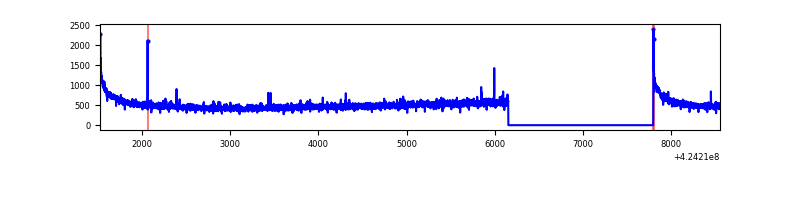 |
| B | 7026 | 5384 | 2 | 2 | 0.03% | 0.04% | 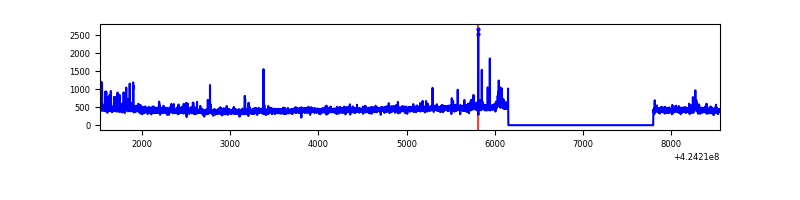 |
| C | 7026 | 5384 | 219 | 219 | 3.12% | 4.07% | 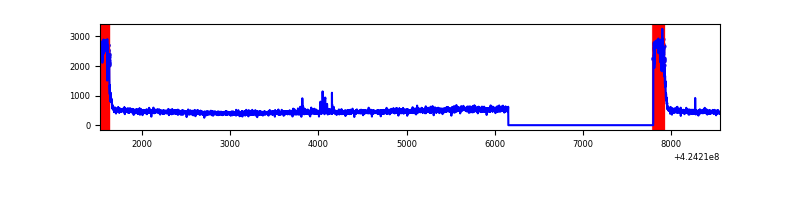 |
| D | 7026 | 5384 | 197 | 197 | 2.80% | 3.66% | 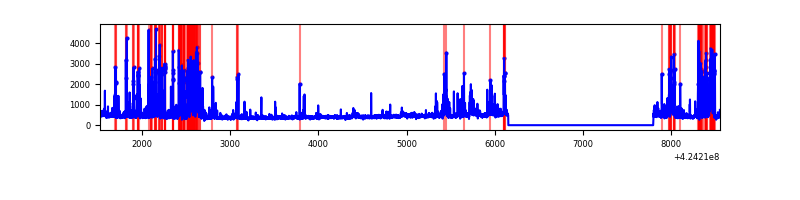 |
Top three noisy pixels from each quadrant. If the there are fewer than three noisy pixels in the level2.evt file, extra rows are filled as -1
| Pixel properties | Quadrant properties | ||||||
|---|---|---|---|---|---|---|---|
| Quadrant | DetID | PixID | Counts | Sigma | Mean | Median | Sigma |
| A | 10 | 83 | 518857 | 4433.48 | 573 | 561 | 116.9 |
| A | 2 | 79 | 13401 | 109.83 | 573 | 561 | 116.9 |
| A | 13 | 254 | 7358 | 58.14 | 573 | 561 | 116.9 |
| B | 0 | 190 | 41379 | 368.69 | 571 | 554 | 110.7 |
| B | 7 | 202 | 32109 | 284.98 | 571 | 554 | 110.7 |
| B | 5 | 255 | 15179 | 132.08 | 571 | 554 | 110.7 |
| C | 0 | 10 | 643884 | 4958.53 | 549 | 552 | 129.7 |
| C | 15 | 214 | 214077 | 1645.76 | 549 | 552 | 129.7 |
| C | 14 | 254 | 15157 | 112.57 | 549 | 552 | 129.7 |
| D | 13 | 249 | 754631 | 5591.77 | 550 | 536 | 134.9 |
| D | 2 | 249 | 135361 | 999.75 | 550 | 536 | 134.9 |
| D | 1 | 47 | 113492 | 837.59 | 550 | 536 | 134.9 |
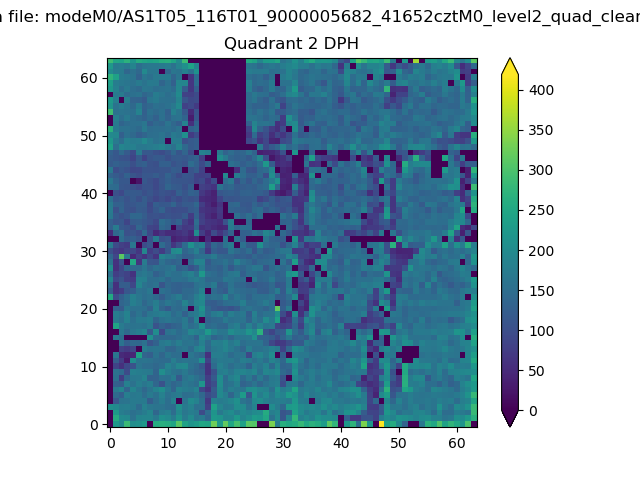
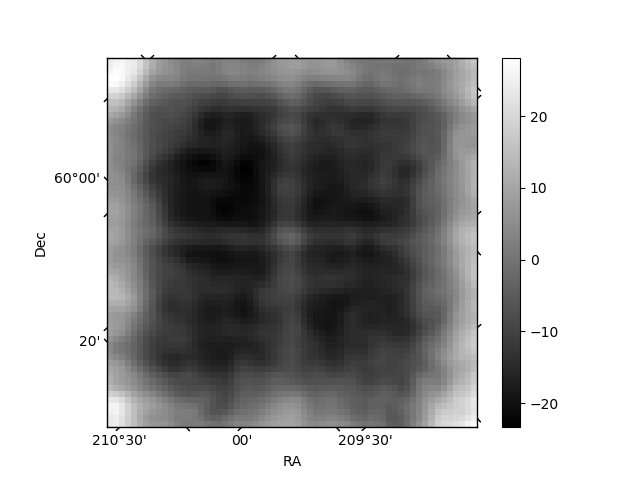
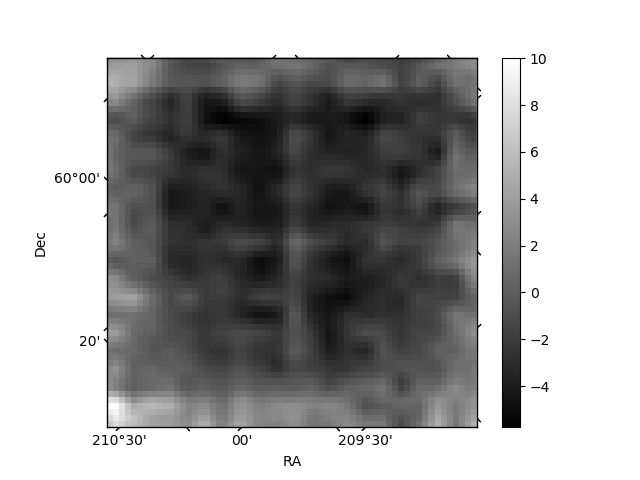
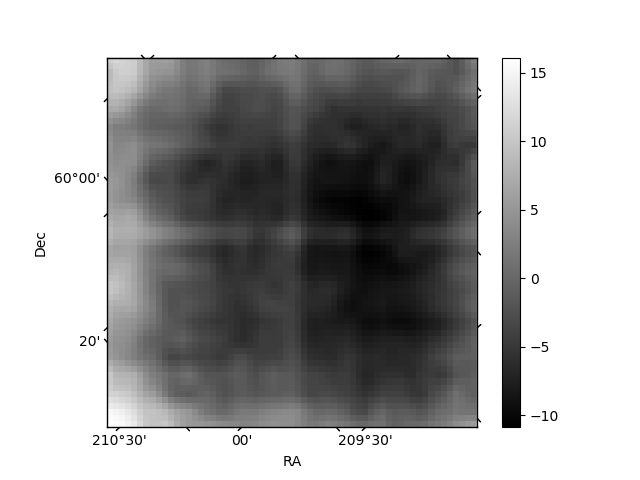
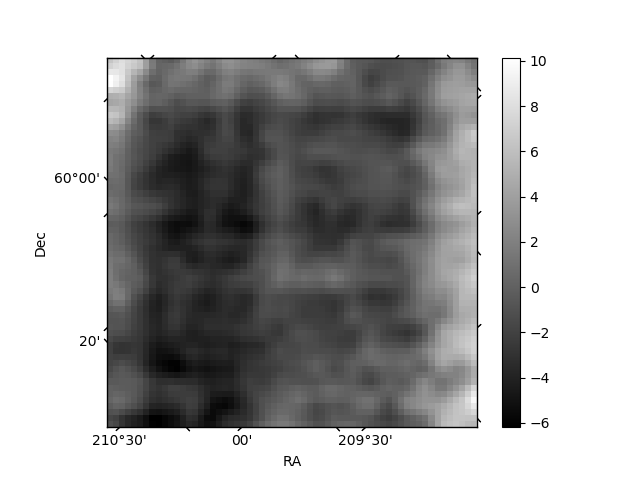
Histogram calculated using DETX and DETY for each event in the final _common_clean file
| Quadrant A | 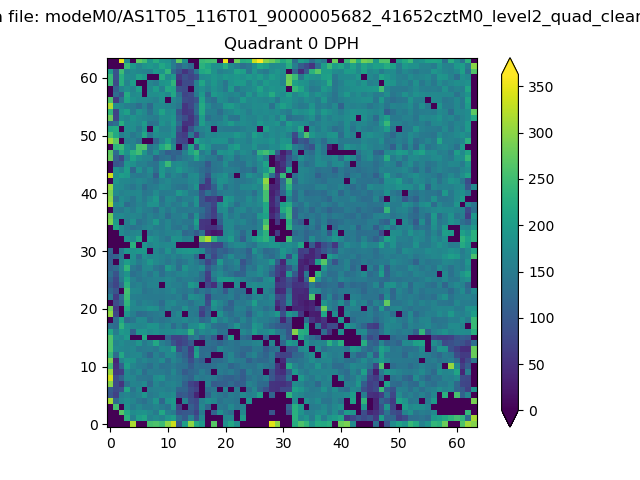 |
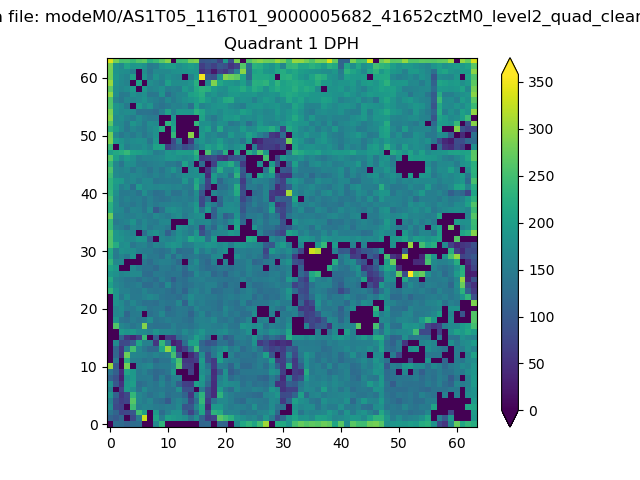 |
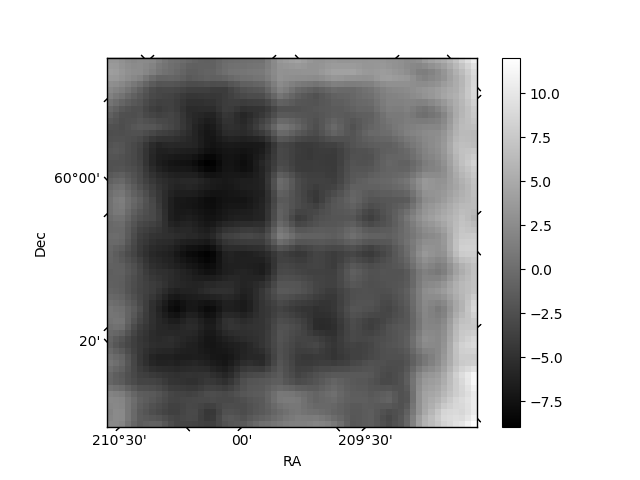
Quadrant B |
|---|---|---|---|
| Quadrant D | 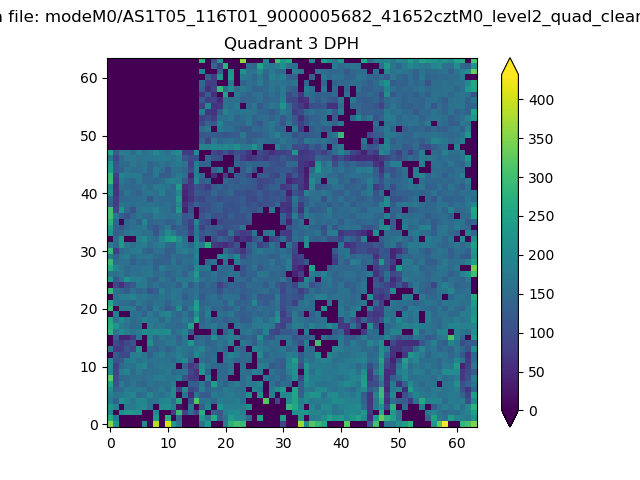 |
 |
Quadrant C |
| Plot type | Count rate plots | Images |
|---|---|---|
| Comparison with Poisson distribution Blue bars denote a histogram of data divided into 1 sec bins. Red curve is a Poisson curve with rate = median count rate of data. |
 |
 |
| Quadrant-wise count rates Data is divided into 100 sec bins |
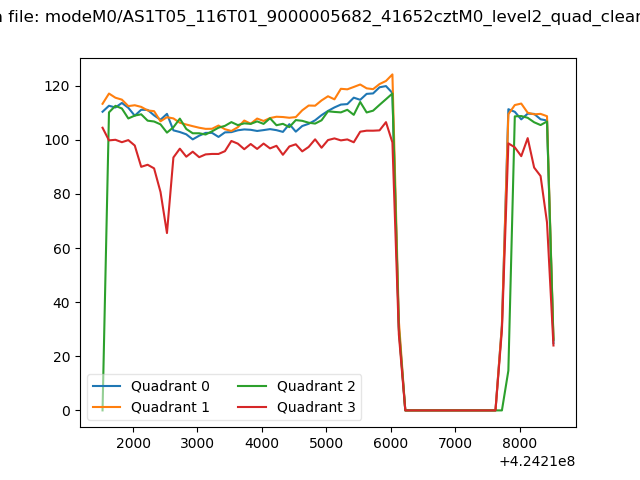 |
|
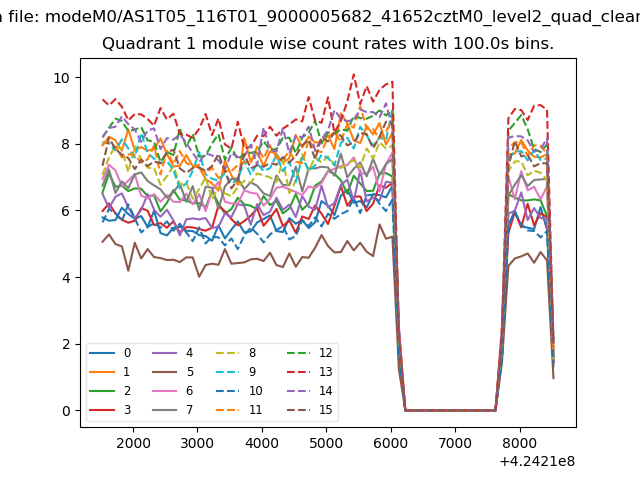
| Module-wise count rates for Quadrant A Data is divided into 100 sec bins |
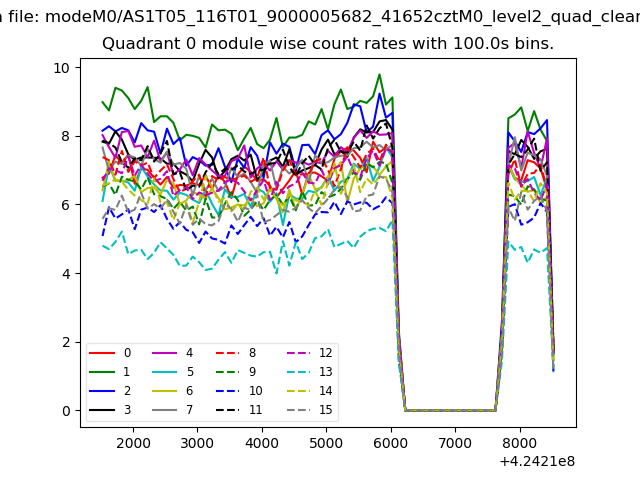 |
 |
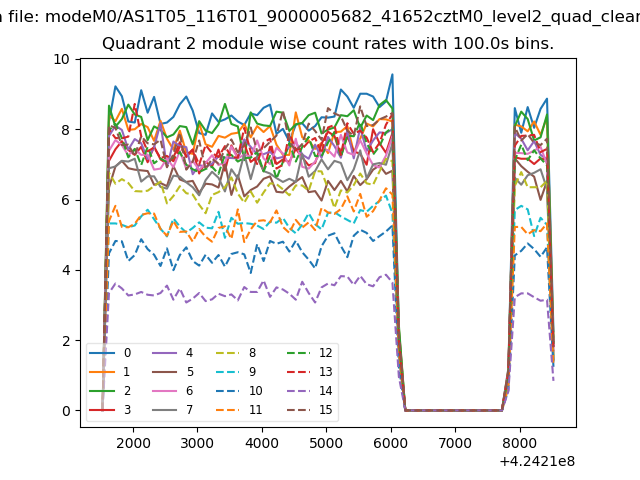
| Module-wise count rates for Quadrant B Data is divided into 100 sec bins |
 |
 |
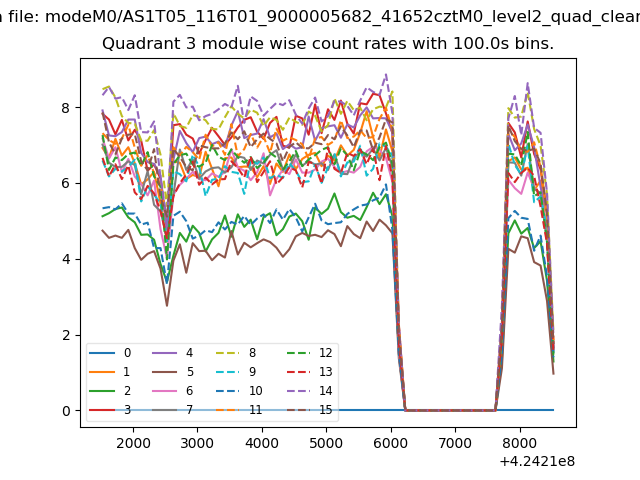
| Module-wise count rates for Quadrant C Data is divided into 100 sec bins |
 |
 |
| Module-wise count rates for Quadrant D Data is divided into 100 sec bins |
 |
 |
| Parameter | Plot |
|---|---|
| CZT HV Monitor | 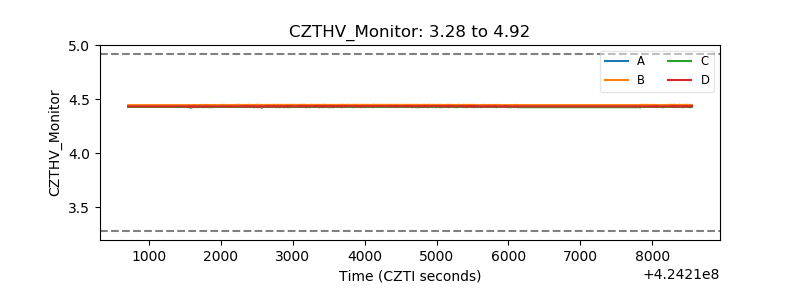 |
| D_VDD | 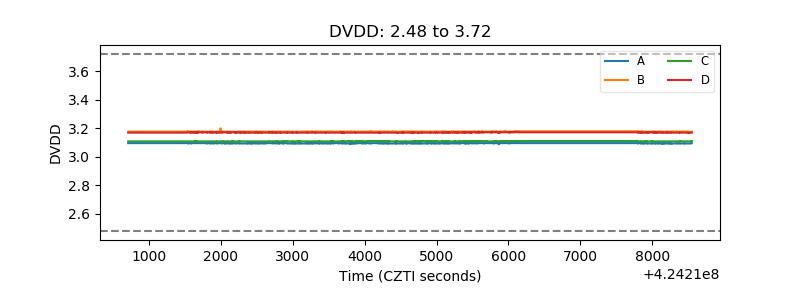 |
| Temperature 1 | 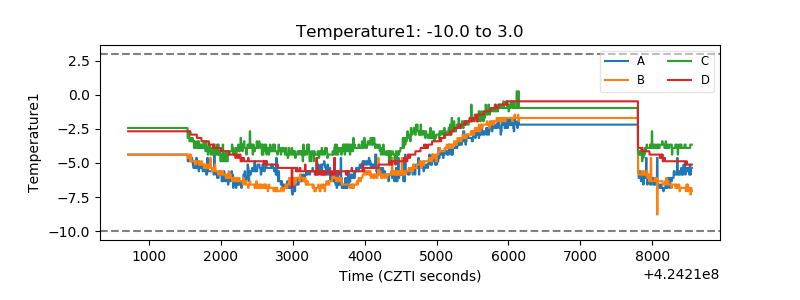 |
| Veto HV Monitor | 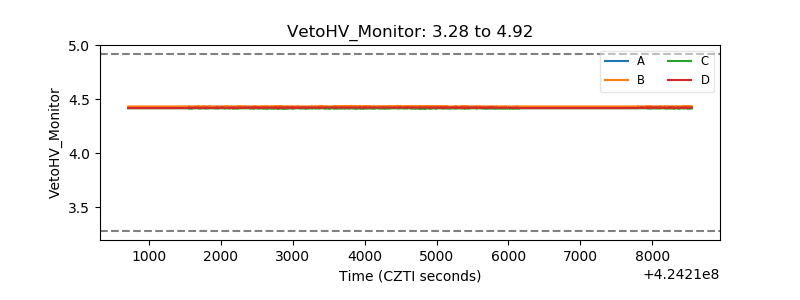 |
| Veto LLD | 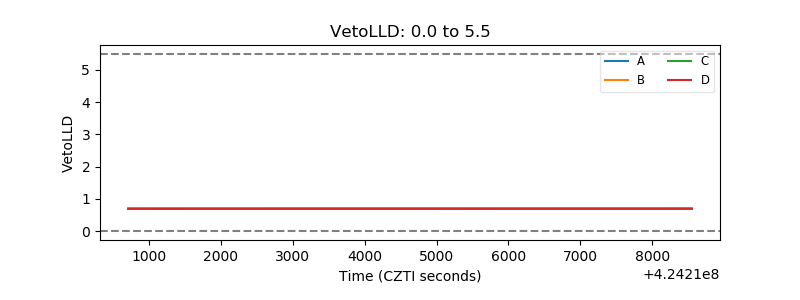 |
| Alpha Counter | 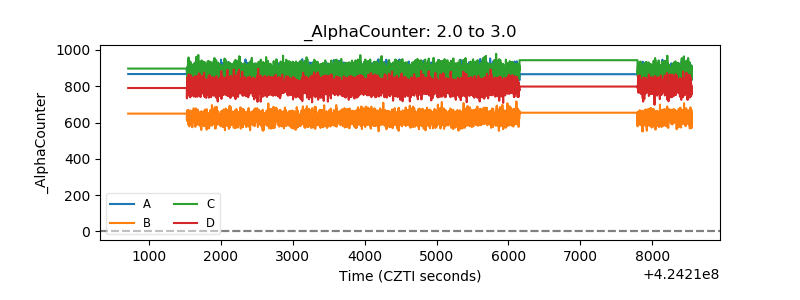 |
| _CPM_Rate | 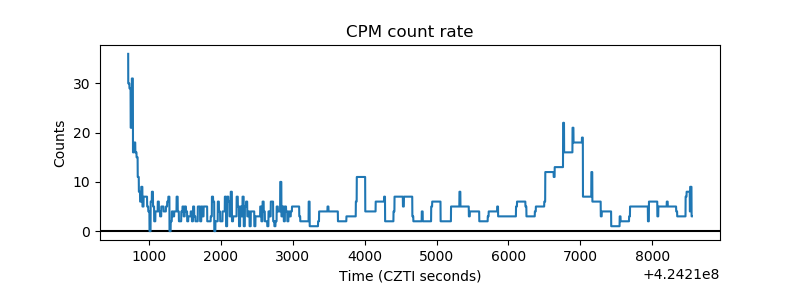 |
| CZT Counter | 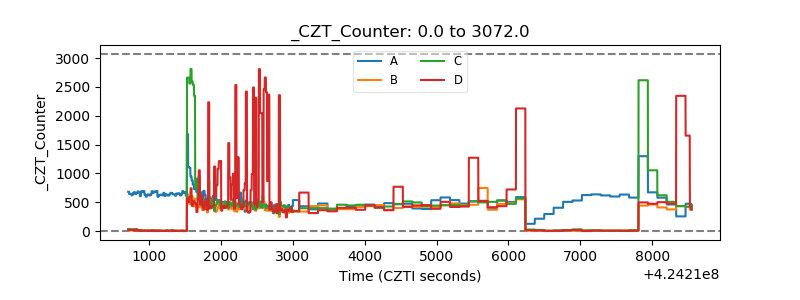 |
| +2.5 Volts monitor | 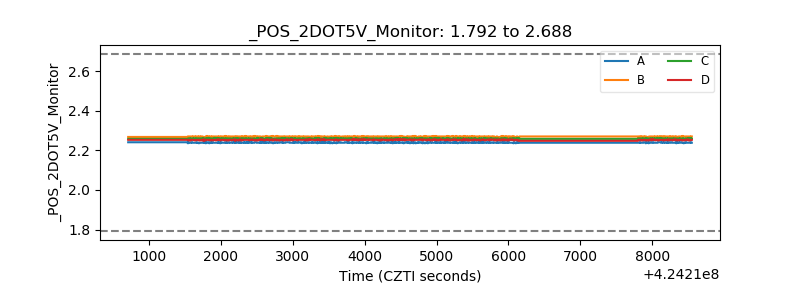 |
| +5 Volts monitor | 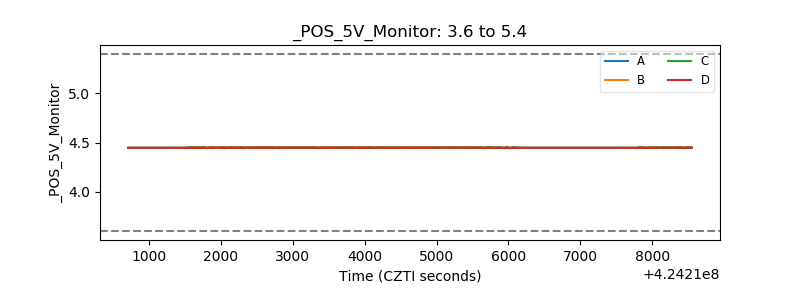 |
| _ROLL_ROT |  |
| _Roll_DEC | 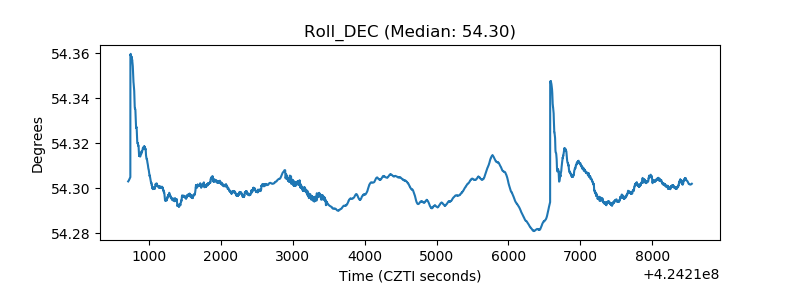 |
| _Roll_RA | 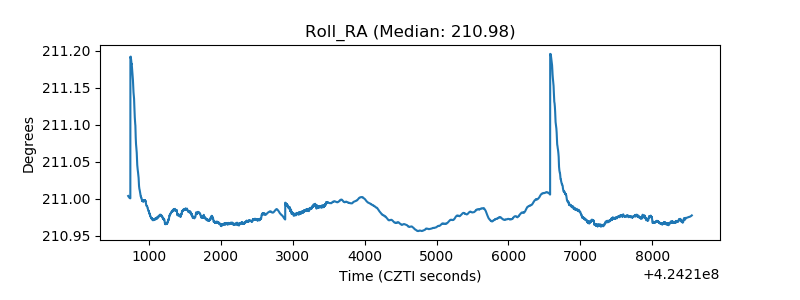 |
| Veto Counter |  |