| Param | Original file | Final file |
|---|---|---|
| Filename | modeM0/AS1T05_116T01_9000005682_41653cztM0_level2.fits | modeM0/AS1T05_116T01_9000005682_41653cztM0_level2_quad_clean.evt |
| Size (bytes) | 401,451,840 | 94,610,880 |
| Size | 382.9 MB | 90.2 MB |
| Events in quadrant A | 3,105,351 | 645,209 |
| Events in quadrant B | 2,725,036 | 660,420 |
| Events in quadrant C | 3,597,208 | 605,224 |
| Events in quadrant D | 4,965,617 | 534,801 |
| Mode M0 | |||
|---|---|---|---|
| Quadrant | BADHDUFLAG | Total packets | Discarded packets |
| A | 0 | 12971 | 2 |
| B | 0 | 12566 | 2 |
| C | 0 | 14556 | 2 |
| D | 0 | 19099 | 2 |
| Mode M9 | |||
|---|---|---|---|
| Quadrant | BADHDUFLAG | Total packets | Discarded packets |
| A | 0 | 30 | 0 |
| B | 0 | 30 | 0 |
| C | 0 | 30 | 0 |
| D | 0 | 30 | 0 |
| Mode SS | |||
|---|---|---|---|
| Quadrant | BADHDUFLAG | Total packets | Discarded packets |
| A | 0 | 124 | 0 |
| B | 0 | 124 | 0 |
| C | 0 | 124 | 0 |
| D | 0 | 124 | 0 |
| Quadrant | Total seconds | Saturated seconds | Saturation percentage |
|---|---|---|---|
| A | 5998 | 14 | 0.233411% |
| B | 5999 | 21 | 0.350058% |
| C | 5999 | 316 | 5.267545% |
| D | 5999 | 699 | 11.651942% |
Noise dominated data is calculated using 1-second bins in cleaned event files. If a bin has >2000 counts, and if more than 50% of those come from <1% of pixels, then it is considered to be noise-dominated and hence unusable.
| Quadrant | # 1 sec bins | Bins with >0 counts | Bins with >2000 counts | High rate bins dominated by noise | Noise dominated (total time) | Noise dominated (detector-on time) | Marked lightcurve |
|---|---|---|---|---|---|---|---|
| A | 9014 | 6000 | 5 | 5 | 0.06% | 0.08% | 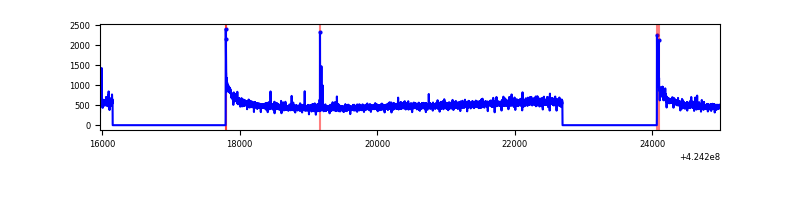 |
| B | 9015 | 6001 | 7 | 7 | 0.08% | 0.12% | 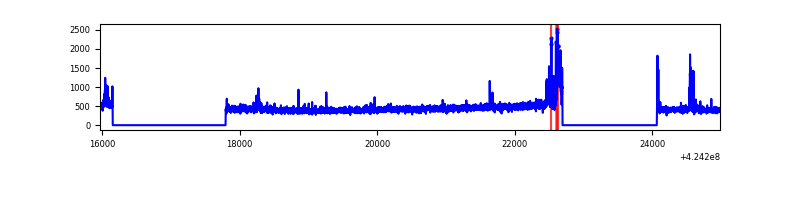 |
| C | 9015 | 6001 | 286 | 286 | 3.17% | 4.77% | 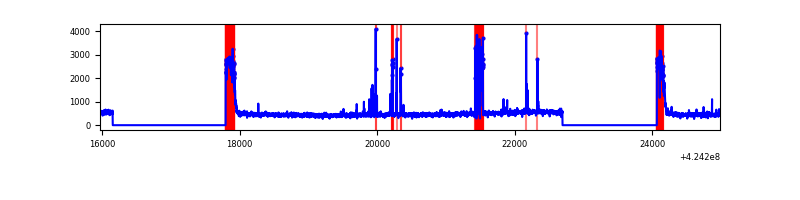 |
| D | 9015 | 6001 | 617 | 617 | 6.84% | 10.28% | 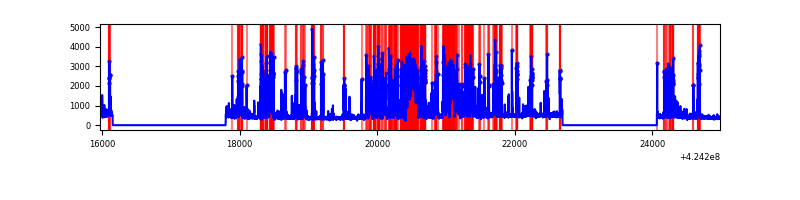 |
Top three noisy pixels from each quadrant. If the there are fewer than three noisy pixels in the level2.evt file, extra rows are filled as -1
| Pixel properties | Quadrant properties | ||||||
|---|---|---|---|---|---|---|---|
| Quadrant | DetID | PixID | Counts | Sigma | Mean | Median | Sigma |
| A | 10 | 83 | 566659 | 4286.09 | 646 | 632 | 132.1 |
| A | 13 | 6 | 11070 | 79.04 | 646 | 632 | 132.1 |
| A | 13 | 248 | 8465 | 59.31 | 646 | 632 | 132.1 |
| B | 0 | 186 | 117232 | 931.31 | 642 | 624 | 125.2 |
| B | 0 | 190 | 49305 | 388.79 | 642 | 624 | 125.2 |
| B | 4 | 81 | 21280 | 164.97 | 642 | 624 | 125.2 |
| C | 0 | 10 | 632854 | 4370.52 | 617 | 619 | 144.7 |
| C | 14 | 254 | 318507 | 2197.5 | 617 | 619 | 144.7 |
| C | 15 | 214 | 239124 | 1648.74 | 617 | 619 | 144.7 |
| D | 13 | 249 | 2160270 | 14664.79 | 599 | 581 | 147.3 |
| D | 2 | 249 | 241093 | 1633.13 | 599 | 581 | 147.3 |
| D | 1 | 47 | 120800 | 816.31 | 599 | 581 | 147.3 |
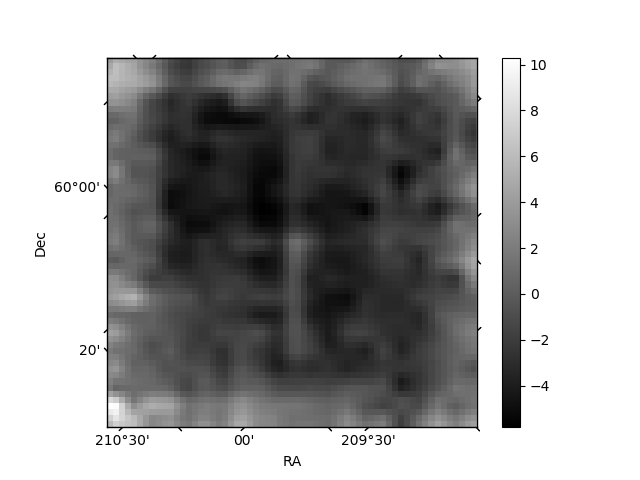
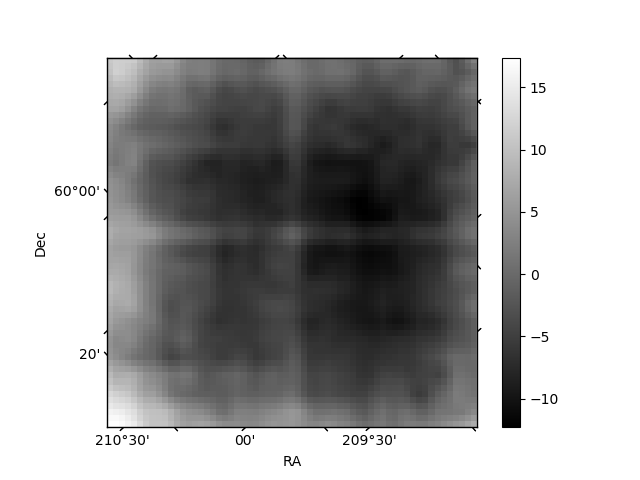
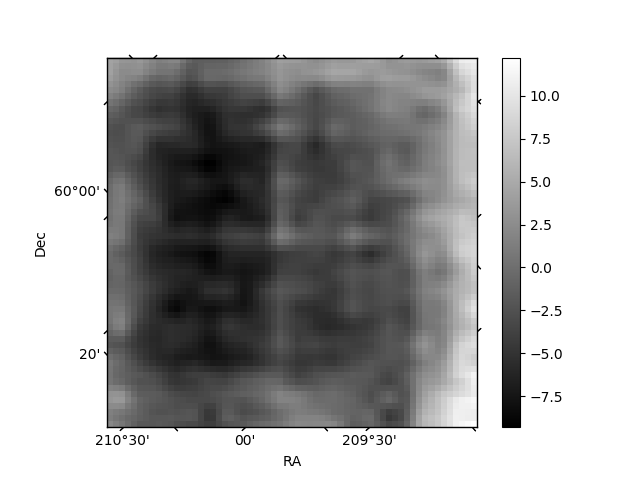
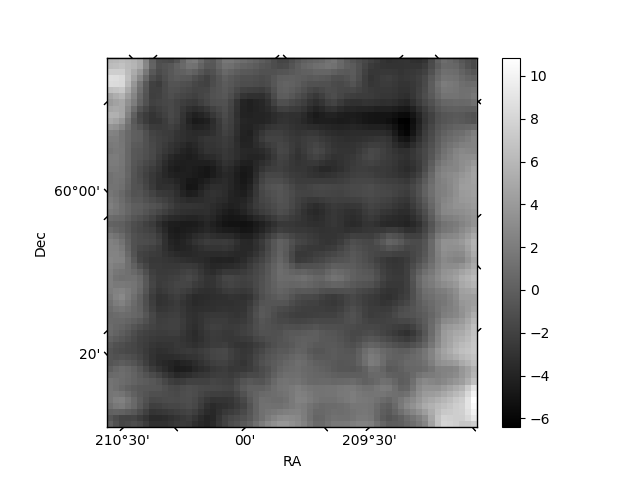
Histogram calculated using DETX and DETY for each event in the final _common_clean file
| Quadrant A | 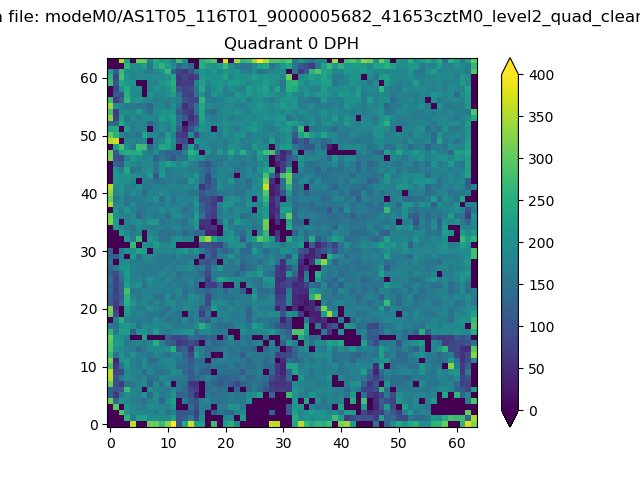 |
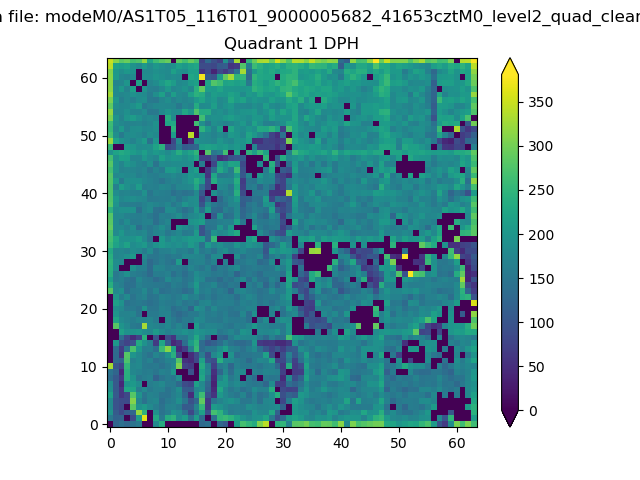 |
Quadrant B |
|---|---|---|---|
| Quadrant D | 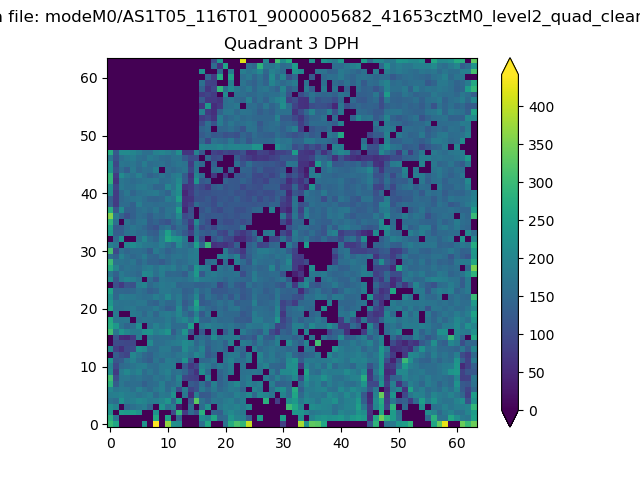 |
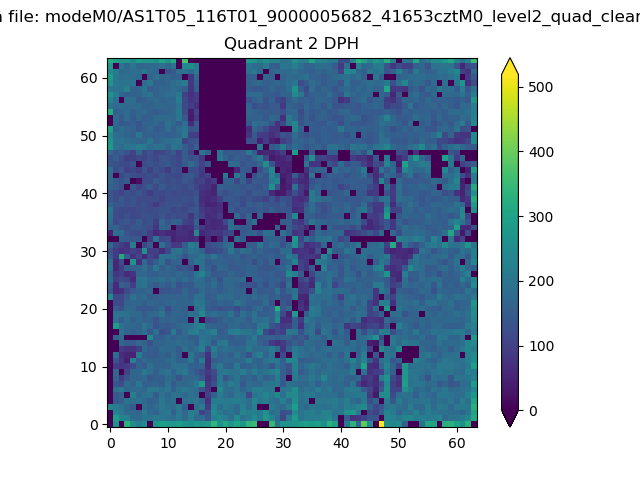 |
Quadrant C |
| Plot type | Count rate plots | Images |
|---|---|---|
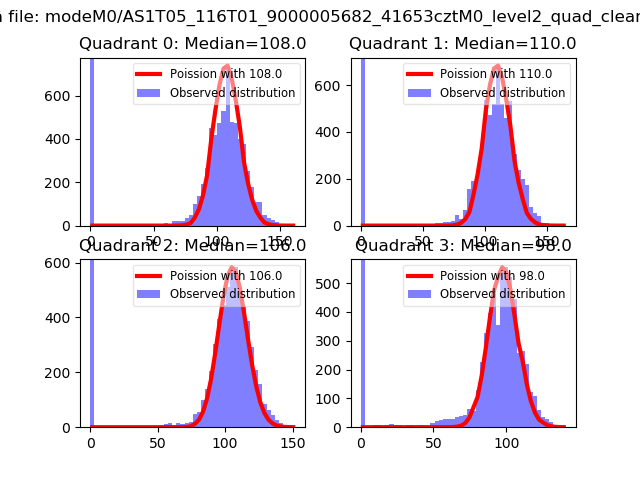
| Comparison with Poisson distribution Blue bars denote a histogram of data divided into 1 sec bins. Red curve is a Poisson curve with rate = median count rate of data. |
 |
 |
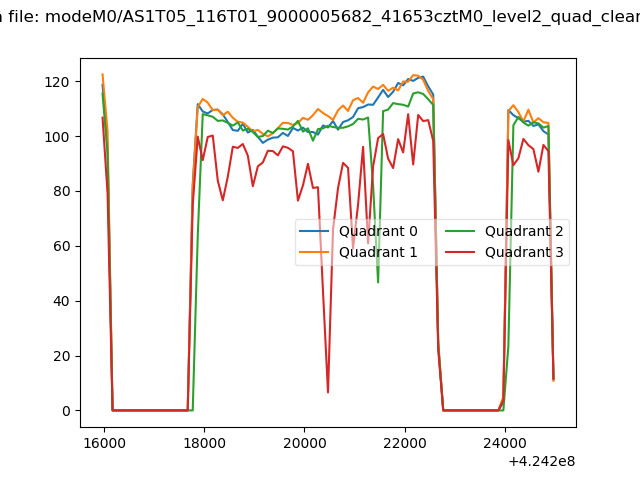
| Quadrant-wise count rates Data is divided into 100 sec bins |
 |
|
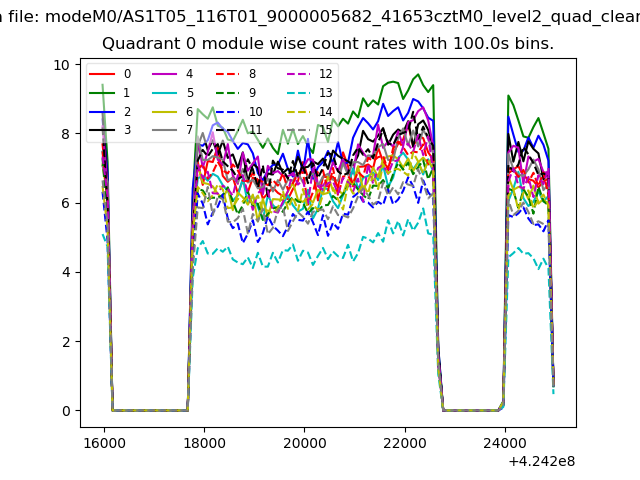
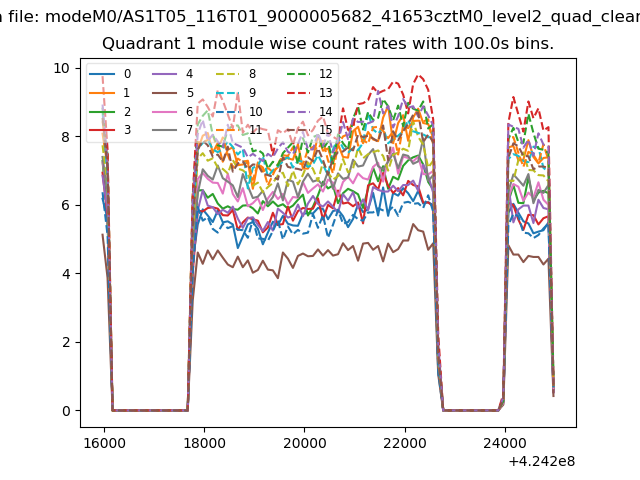
| Module-wise count rates for Quadrant A Data is divided into 100 sec bins |
 |
 |
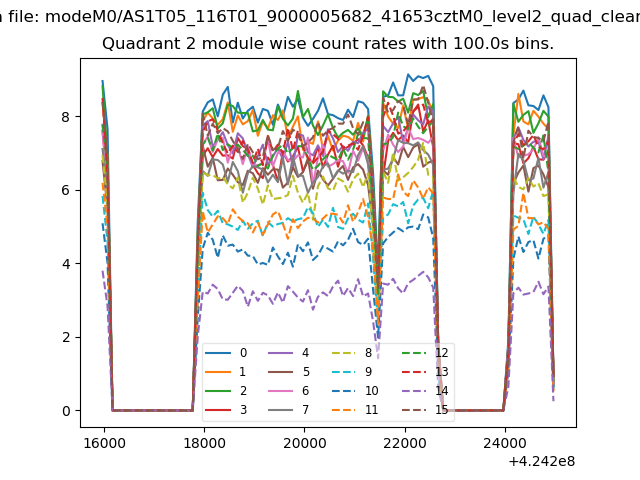
| Module-wise count rates for Quadrant B Data is divided into 100 sec bins |
 |
 |
| Module-wise count rates for Quadrant C Data is divided into 100 sec bins |
 |
 |
| Module-wise count rates for Quadrant D Data is divided into 100 sec bins |
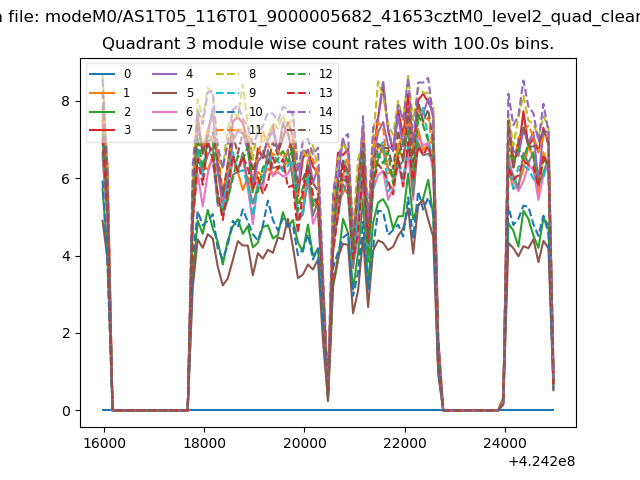 |
 |
| Parameter | Plot |
|---|---|
| CZT HV Monitor | 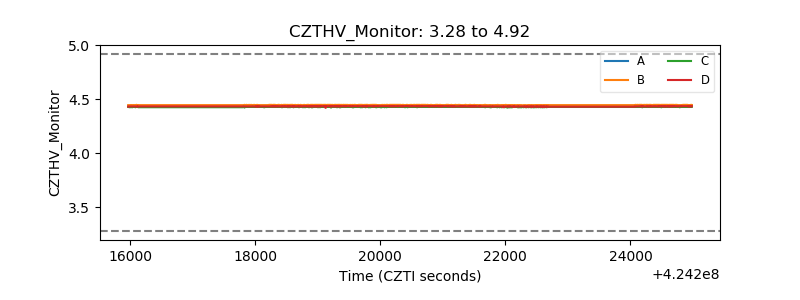 |
| D_VDD | 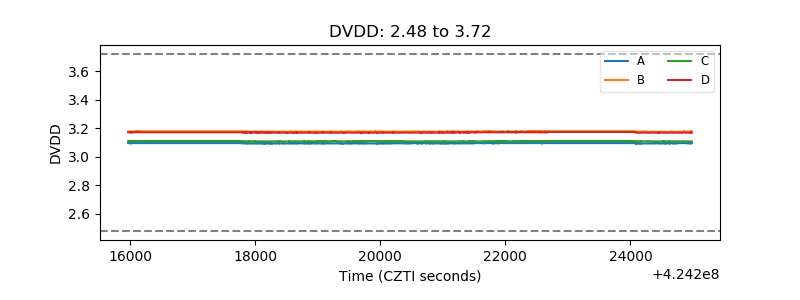 |
| Temperature 1 | 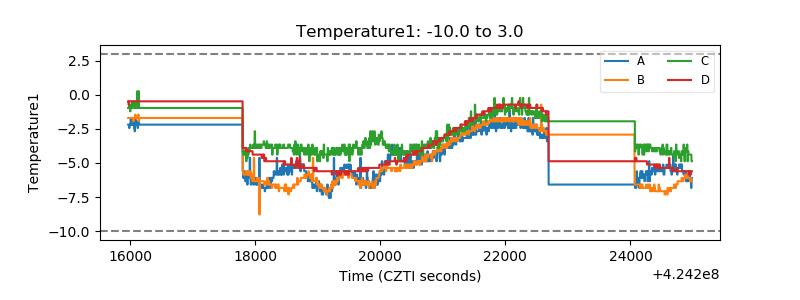 |
| Veto HV Monitor | 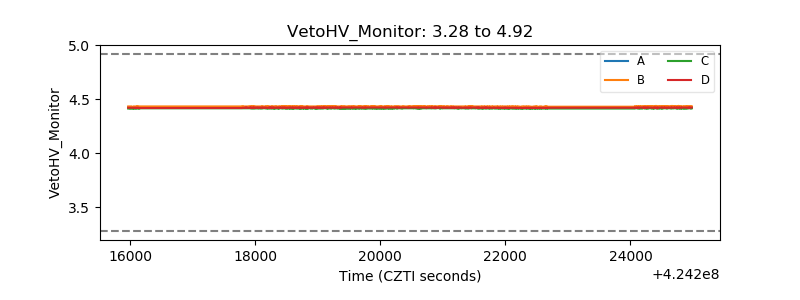 |
| Veto LLD | 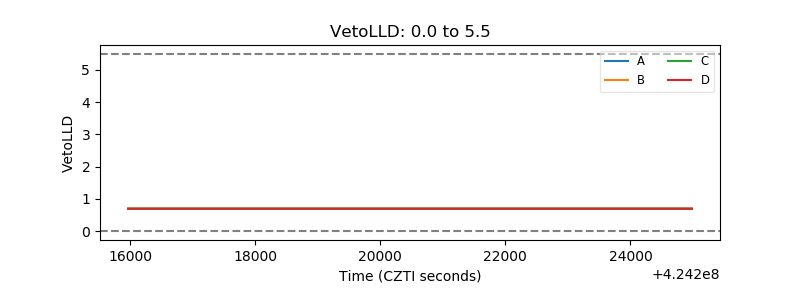 |
| Alpha Counter | 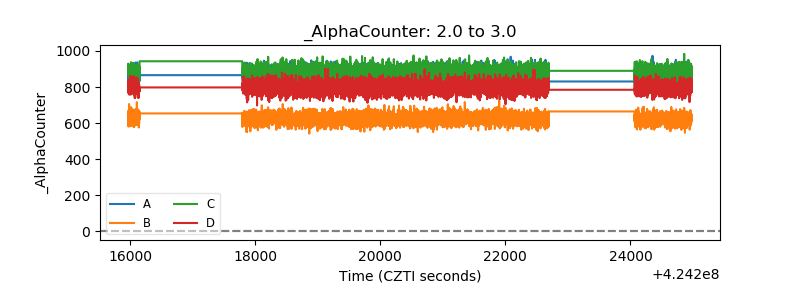 |
| _CPM_Rate | 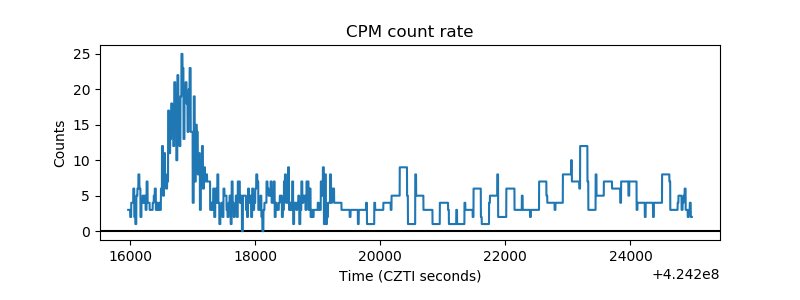 |
| CZT Counter | 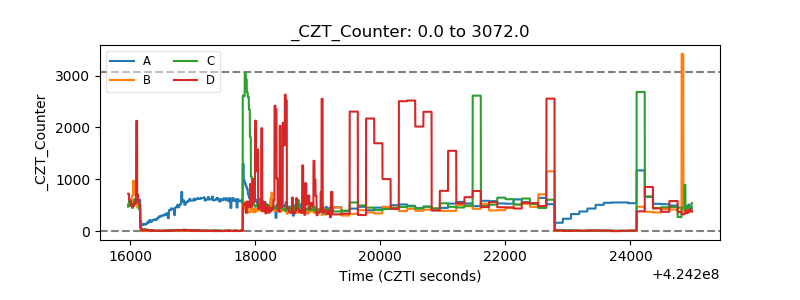 |
| +2.5 Volts monitor |  |
| +5 Volts monitor |  |
| _ROLL_ROT |  |
| _Roll_DEC | 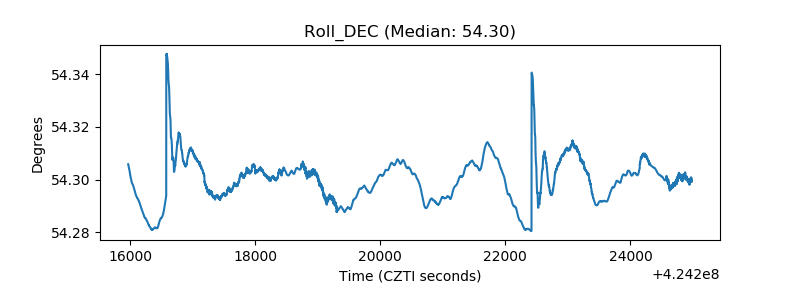 |
| _Roll_RA | 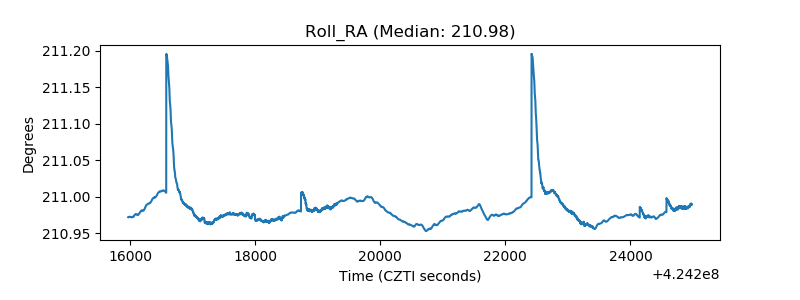 |
| Veto Counter | 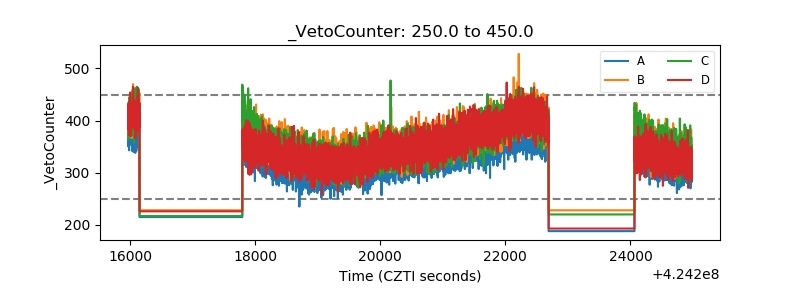 |