| Param | Original file | Final file |
|---|---|---|
| Filename | modeM0/AS1T05_116T01_9000005682_41654cztM0_level2.fits | modeM0/AS1T05_116T01_9000005682_41654cztM0_level2_quad_clean.evt |
| Size (bytes) | 448,286,400 | 100,440,000 |
| Size | 427.5 MB | 95.8 MB |
| Events in quadrant A | 3,416,005 | 697,816 |
| Events in quadrant B | 3,908,249 | 676,675 |
| Events in quadrant C | 4,740,651 | 592,525 |
| Events in quadrant D | 4,024,034 | 621,519 |
| Mode M0 | |||
|---|---|---|---|
| Quadrant | BADHDUFLAG | Total packets | Discarded packets |
| A | 0 | 14079 | 2 |
| B | 0 | 16338 | 2 |
| C | 0 | 18203 | 2 |
| D | 0 | 16632 | 2 |
| Mode M9 | |||
|---|---|---|---|
| Quadrant | BADHDUFLAG | Total packets | Discarded packets |
| A | 0 | 27 | 0 |
| B | 0 | 27 | 0 |
| C | 0 | 27 | 0 |
| D | 0 | 27 | 0 |
| Mode SS | |||
|---|---|---|---|
| Quadrant | BADHDUFLAG | Total packets | Discarded packets |
| A | 0 | 134 | 0 |
| B | 0 | 134 | 0 |
| C | 0 | 134 | 0 |
| D | 0 | 134 | 0 |
| Quadrant | Total seconds | Saturated seconds | Saturation percentage |
|---|---|---|---|
| A | 6488 | 8 | 0.123305% |
| B | 6489 | 397 | 6.118046% |
| C | 6489 | 985 | 15.179535% |
| D | 6489 | 227 | 3.498228% |
Noise dominated data is calculated using 1-second bins in cleaned event files. If a bin has >2000 counts, and if more than 50% of those come from <1% of pixels, then it is considered to be noise-dominated and hence unusable.
| Quadrant | # 1 sec bins | Bins with >0 counts | Bins with >2000 counts | High rate bins dominated by noise | Noise dominated (total time) | Noise dominated (detector-on time) | Marked lightcurve |
|---|---|---|---|---|---|---|---|
| A | 9173 | 6490 | 4 | 4 | 0.04% | 0.06% | 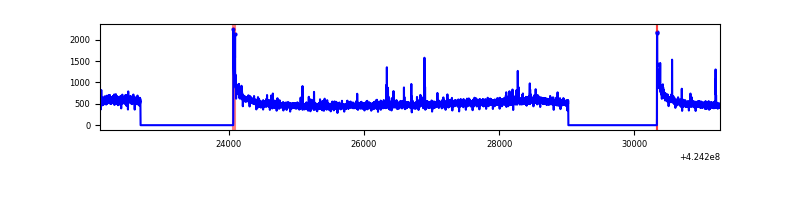 |
| B | 9174 | 6491 | 246 | 246 | 2.68% | 3.79% | 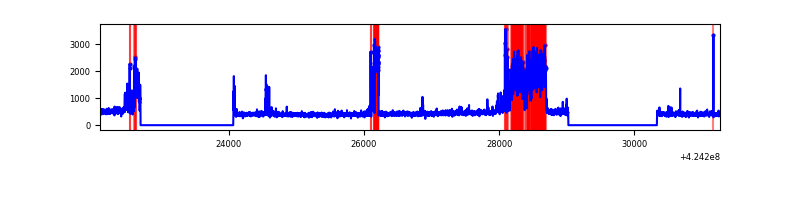 |
| C | 9174 | 6491 | 583 | 583 | 6.35% | 8.98% | 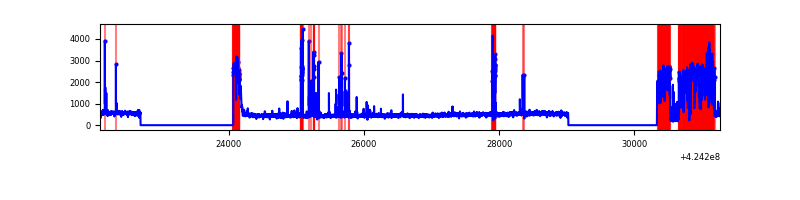 |
| D | 9174 | 6491 | 211 | 211 | 2.30% | 3.25% | 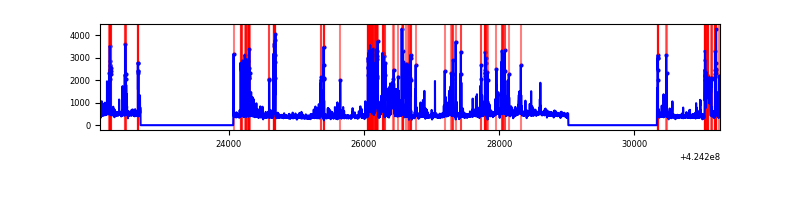 |
Top three noisy pixels from each quadrant. If the there are fewer than three noisy pixels in the level2.evt file, extra rows are filled as -1
| Pixel properties | Quadrant properties | ||||||
|---|---|---|---|---|---|---|---|
| Quadrant | DetID | PixID | Counts | Sigma | Mean | Median | Sigma |
| A | 10 | 83 | 607605 | 4133.07 | 713 | 697 | 146.8 |
| A | 13 | 248 | 29905 | 198.91 | 713 | 697 | 146.8 |
| A | 2 | 79 | 9321 | 58.73 | 713 | 697 | 146.8 |
| B | 0 | 186 | 853144 | 6320.34 | 694 | 675 | 134.9 |
| B | 5 | 255 | 188138 | 1389.88 | 694 | 675 | 134.9 |
| B | 0 | 190 | 69120 | 507.46 | 694 | 675 | 134.9 |
| C | 14 | 254 | 1792315 | 12404.68 | 615 | 618 | 144.4 |
| C | 0 | 10 | 319671 | 2208.94 | 615 | 618 | 144.4 |
| C | 15 | 214 | 227395 | 1570.07 | 615 | 618 | 144.4 |
| D | 13 | 249 | 943418 | 5559.47 | 688 | 668 | 169.6 |
| D | 2 | 249 | 170281 | 1000.22 | 688 | 668 | 169.6 |
| D | 1 | 47 | 117907 | 691.37 | 688 | 668 | 169.6 |
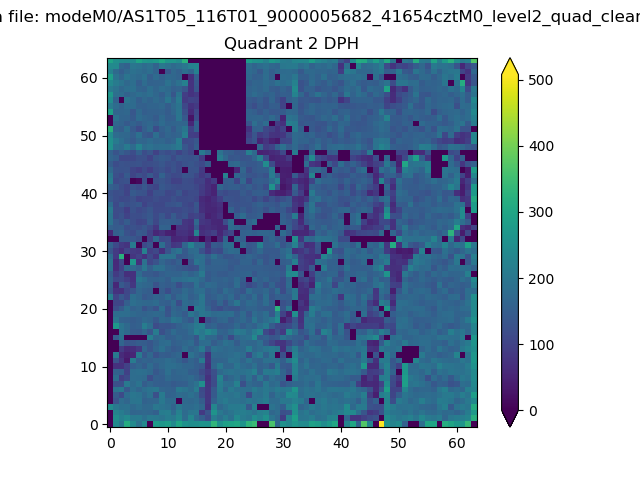
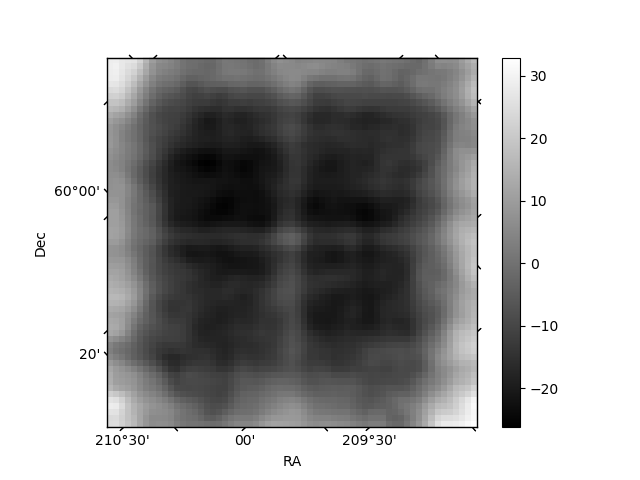
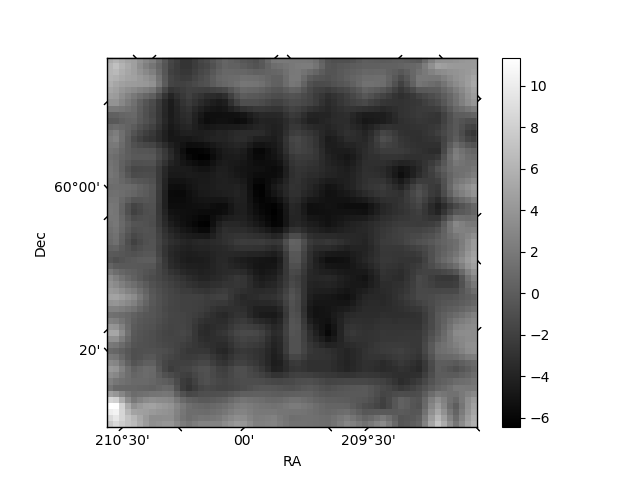
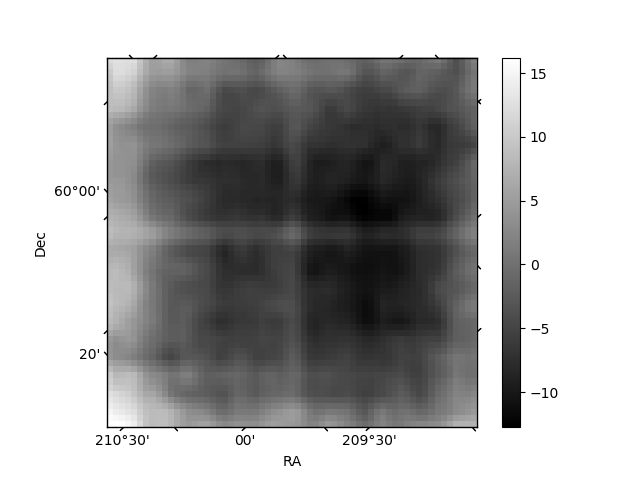
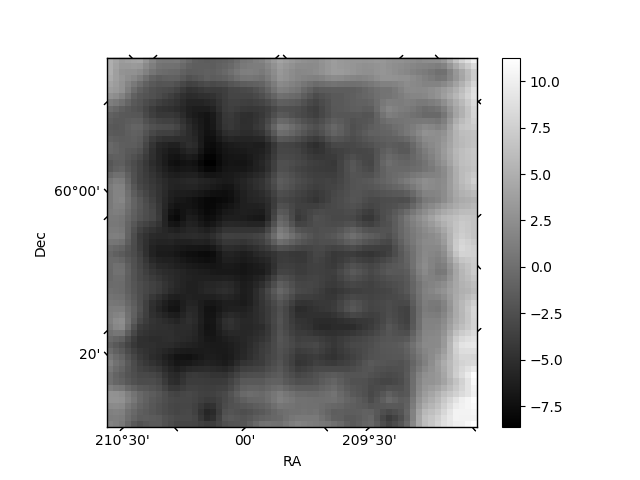
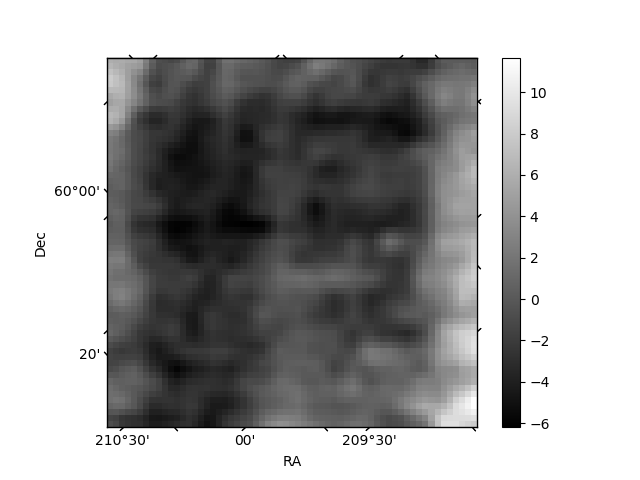
Histogram calculated using DETX and DETY for each event in the final _common_clean file
| Quadrant A | 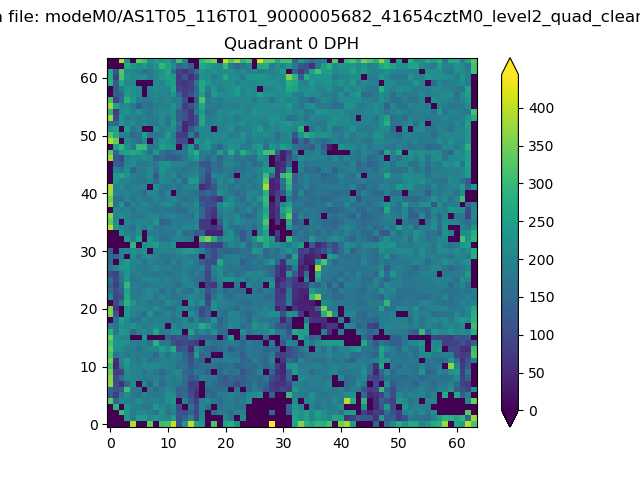 |
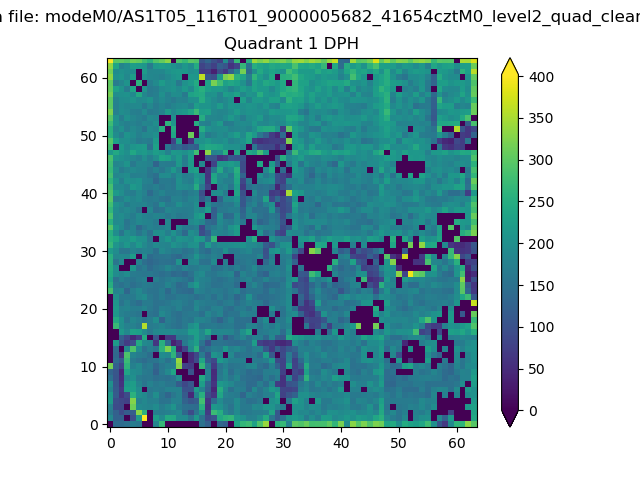 |
Quadrant B |
|---|---|---|---|
| Quadrant D | 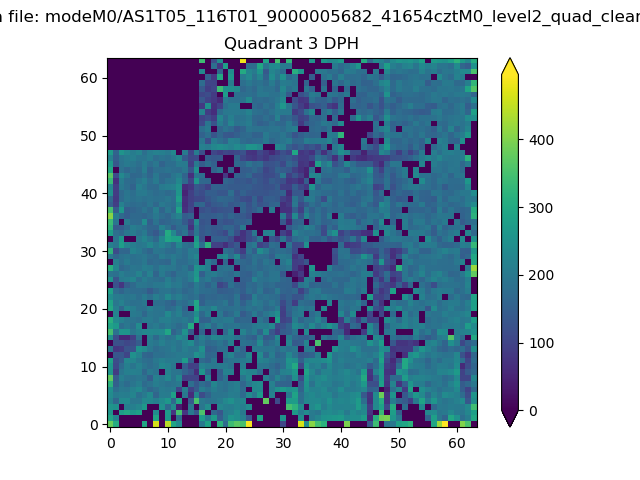 |
 |
Quadrant C |
| Plot type | Count rate plots | Images |
|---|---|---|
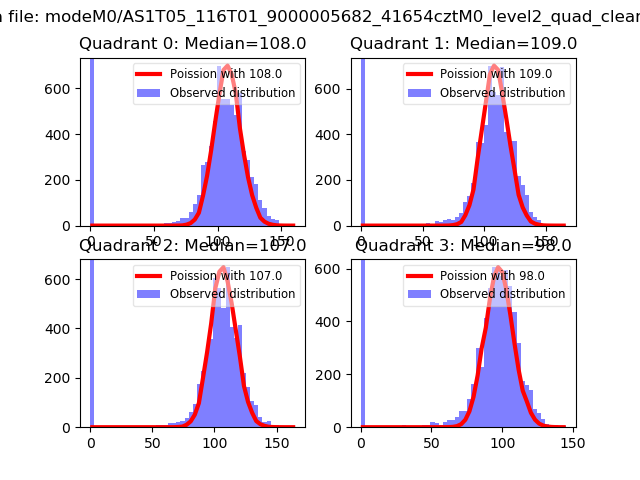
| Comparison with Poisson distribution Blue bars denote a histogram of data divided into 1 sec bins. Red curve is a Poisson curve with rate = median count rate of data. |
 |
 |
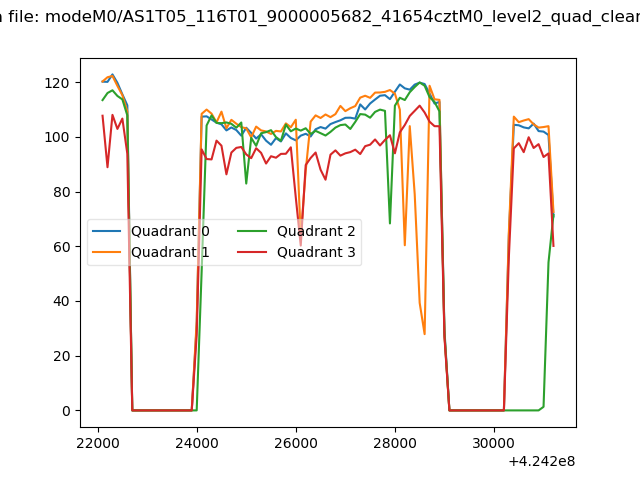
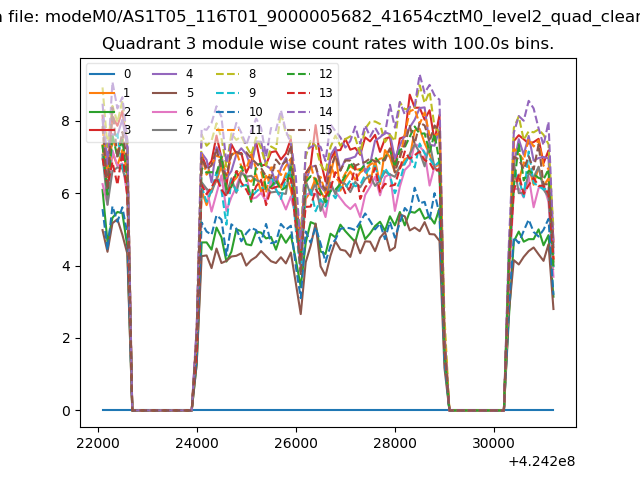
| Quadrant-wise count rates Data is divided into 100 sec bins |
 |
|
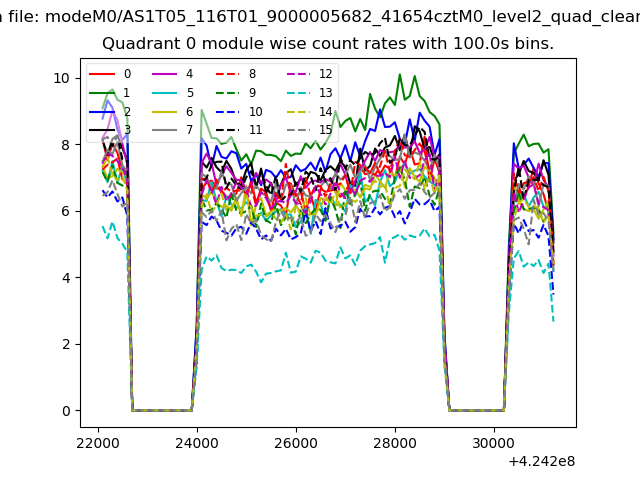
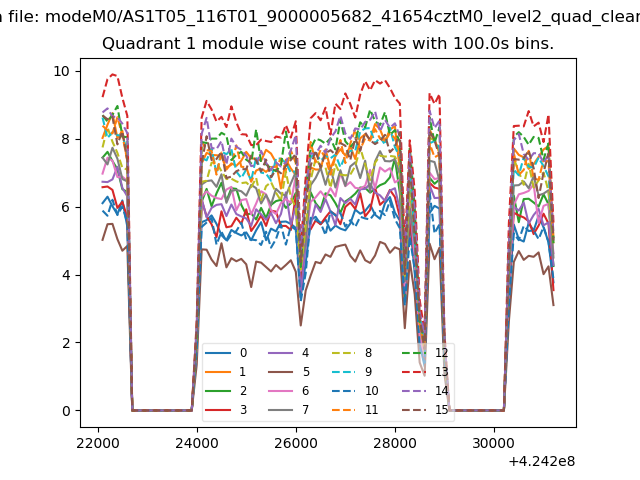
| Module-wise count rates for Quadrant A Data is divided into 100 sec bins |
 |
 |
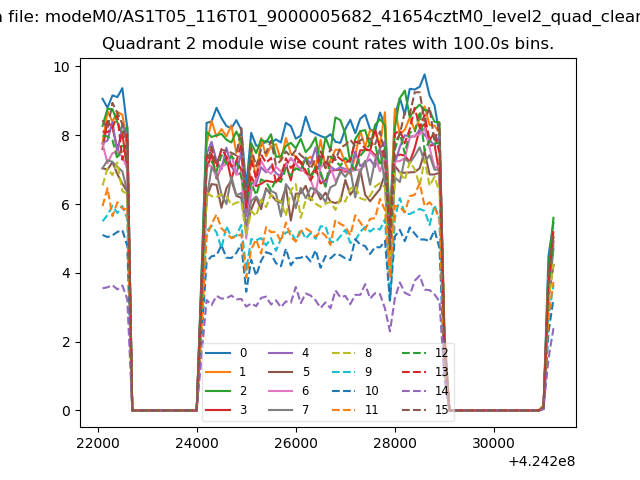
| Module-wise count rates for Quadrant B Data is divided into 100 sec bins |
 |
 |
| Module-wise count rates for Quadrant C Data is divided into 100 sec bins |
 |
 |
| Module-wise count rates for Quadrant D Data is divided into 100 sec bins |
 |
 |
| Parameter | Plot |
|---|---|
| CZT HV Monitor | 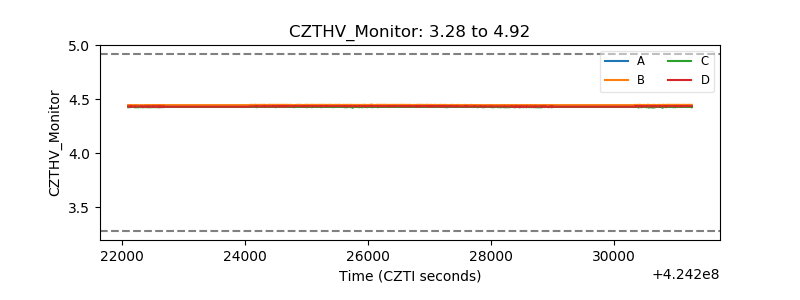 |
| D_VDD | 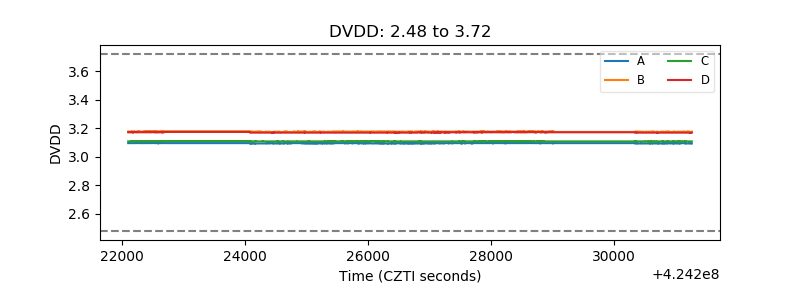 |
| Temperature 1 | 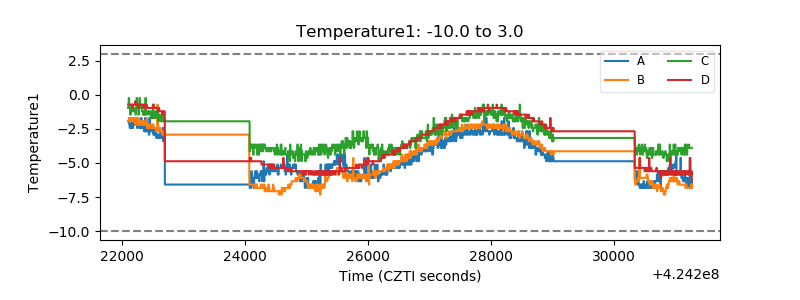 |
| Veto HV Monitor | 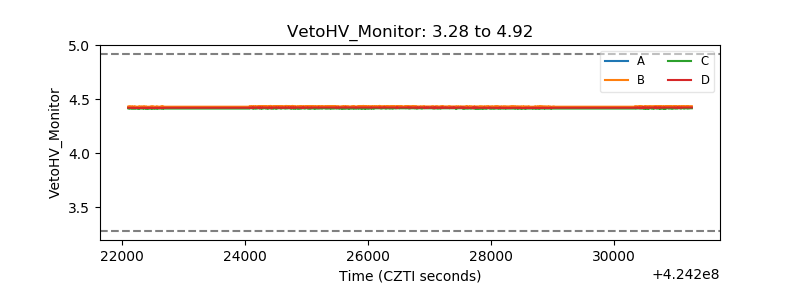 |
| Veto LLD | 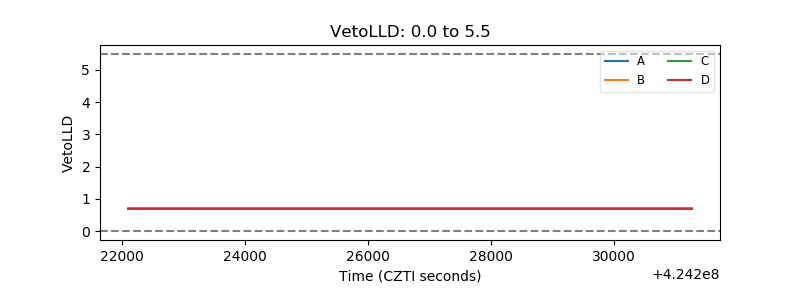 |
| Alpha Counter | 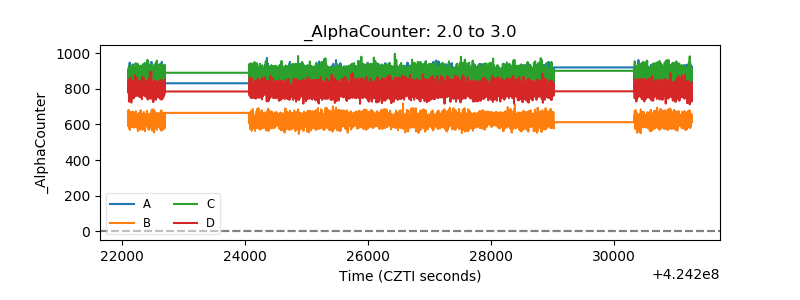 |
| _CPM_Rate | 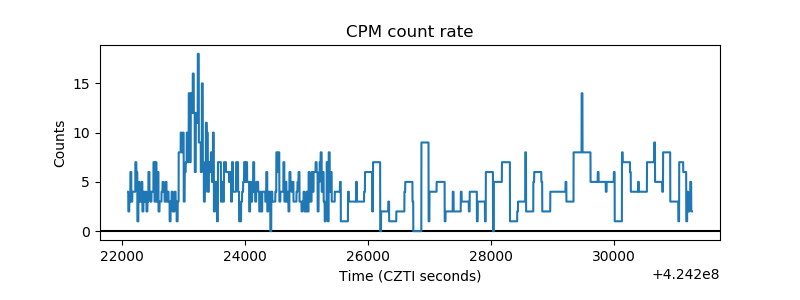 |
| CZT Counter | 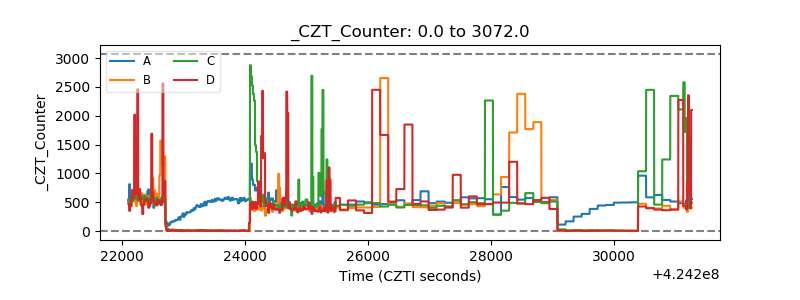 |
| +2.5 Volts monitor | 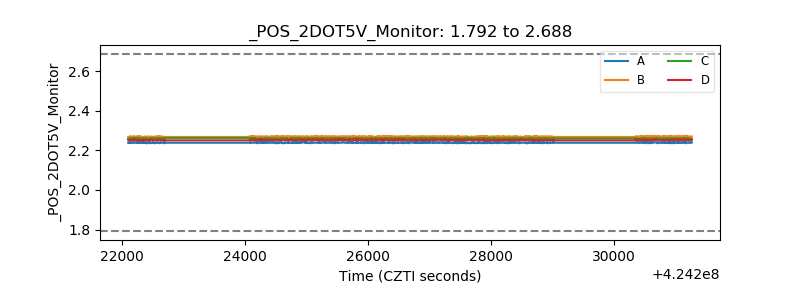 |
| +5 Volts monitor | 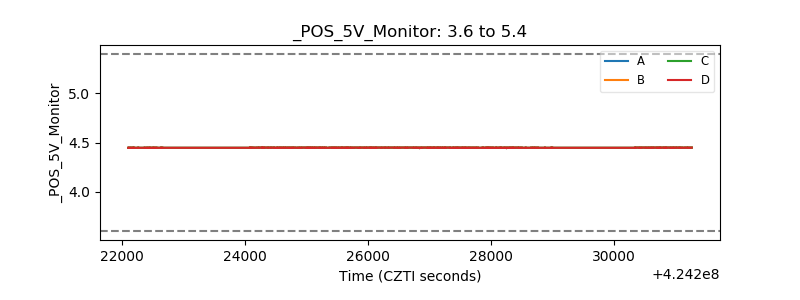 |
| _ROLL_ROT |  |
| _Roll_DEC | 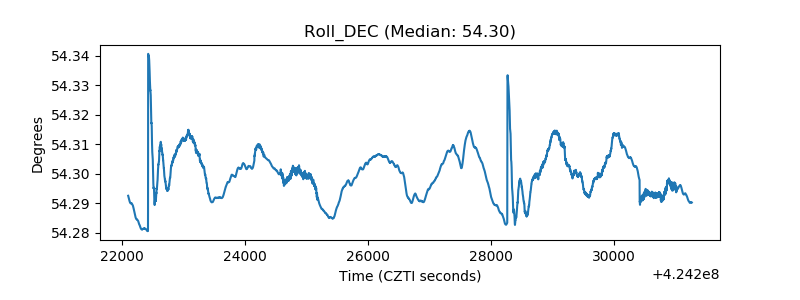 |
| _Roll_RA | 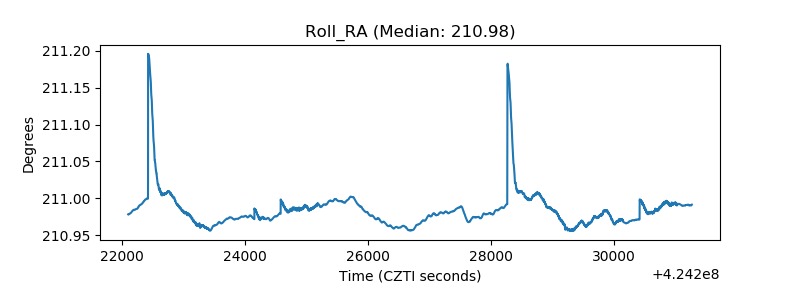 |
| Veto Counter |  |